Blog

Targeted Demand, Targeted Supply: Decarbonizing Private Aviation First

Greenhouse Gas Removal , Transportation

Private aviation could jump-start the market for truly carbon-negative jet fuel. By targeting a small group of high-end users, California can connect direct-air-capture carbon with waste-biomass hydrogen to produce sustainable aviation fuel—helping to decarbonize the skies faster than offsets ever could.

Aviation accounts for roughly 2.5% of  U.S. carbon dioxide emissions. Without mitigation, that share could double by 2050. Sustainable Aviation Fuels (SAF) can cut lifecycle emissions, but they cost two to ten times more than conventional jet fuel. This piece outlines a near-term pathway to carbon-negative SAF via the Fischer-Tropsch (FT) process using CO2 captured from air and hydrogen from sustainable biomass.

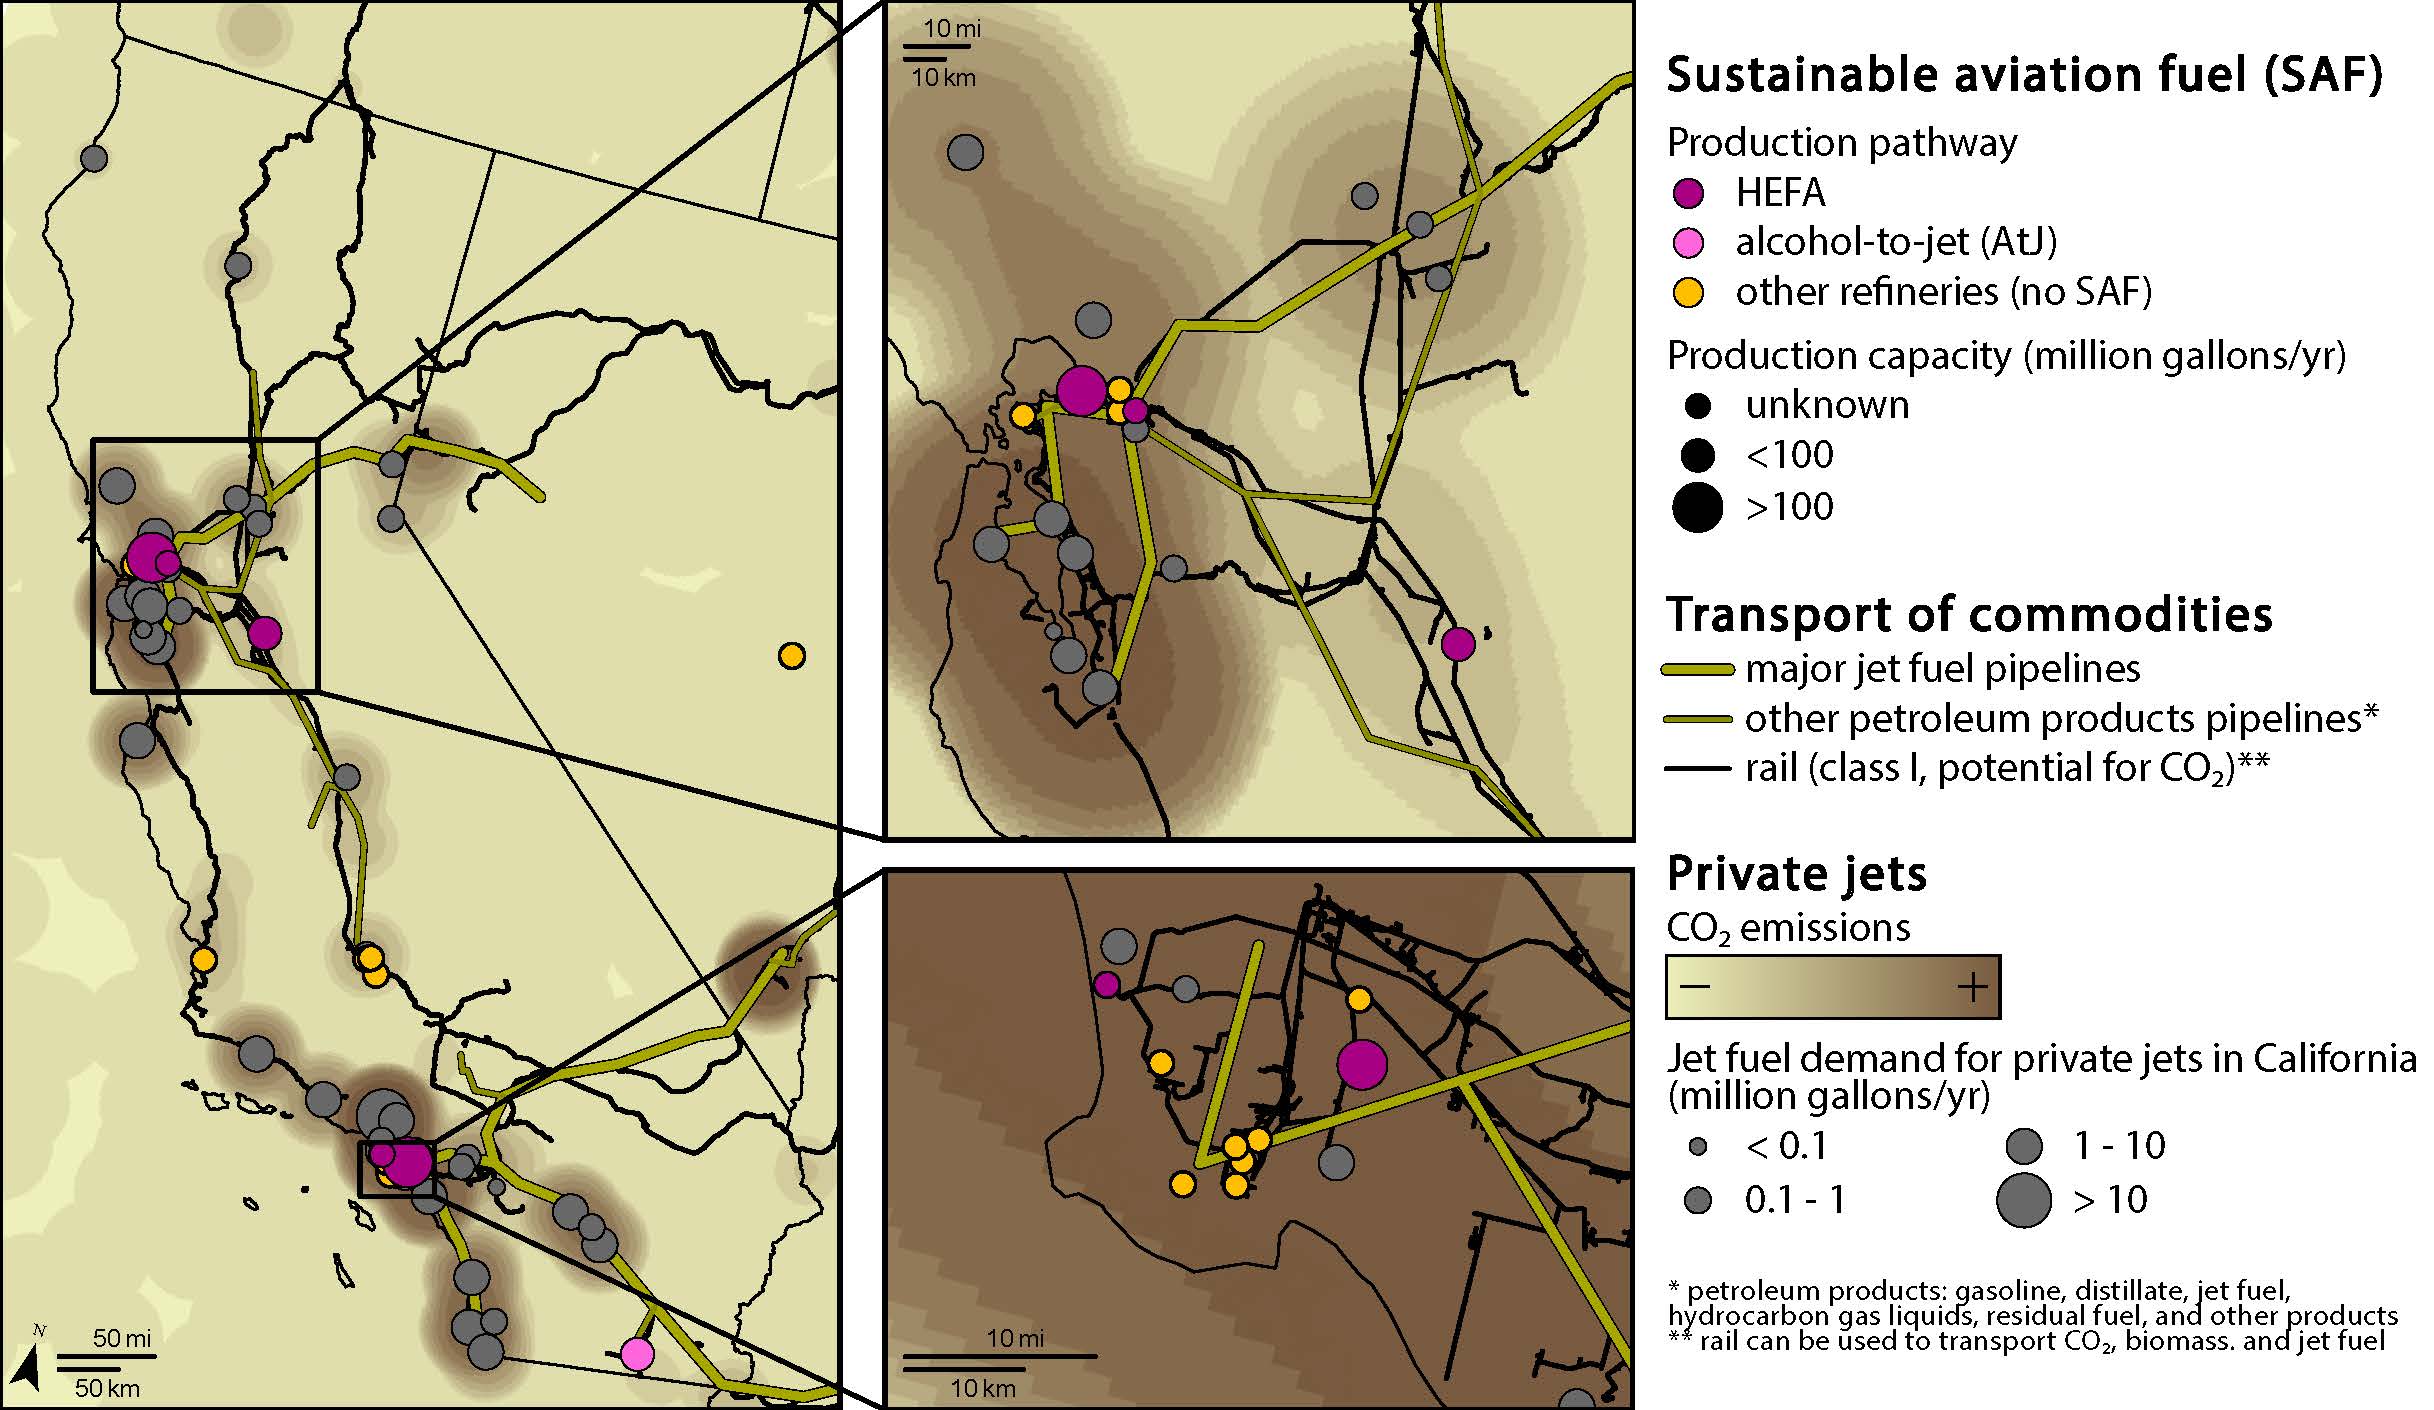
Starting with private aviation. To tackle aviation emissions, we should start with business and charter flights. These concentrate demand at a handful of airports and serve customers able to pay a premium. Many already buy carbon offsets, which vary widely in quality and rarely deliver durable, verifiable climate benefits. Redirecting that spending to high-integrity SAF offtakes can help scale production and lower costs. Philanthropic and corporate buyers can play a big role as first movers.

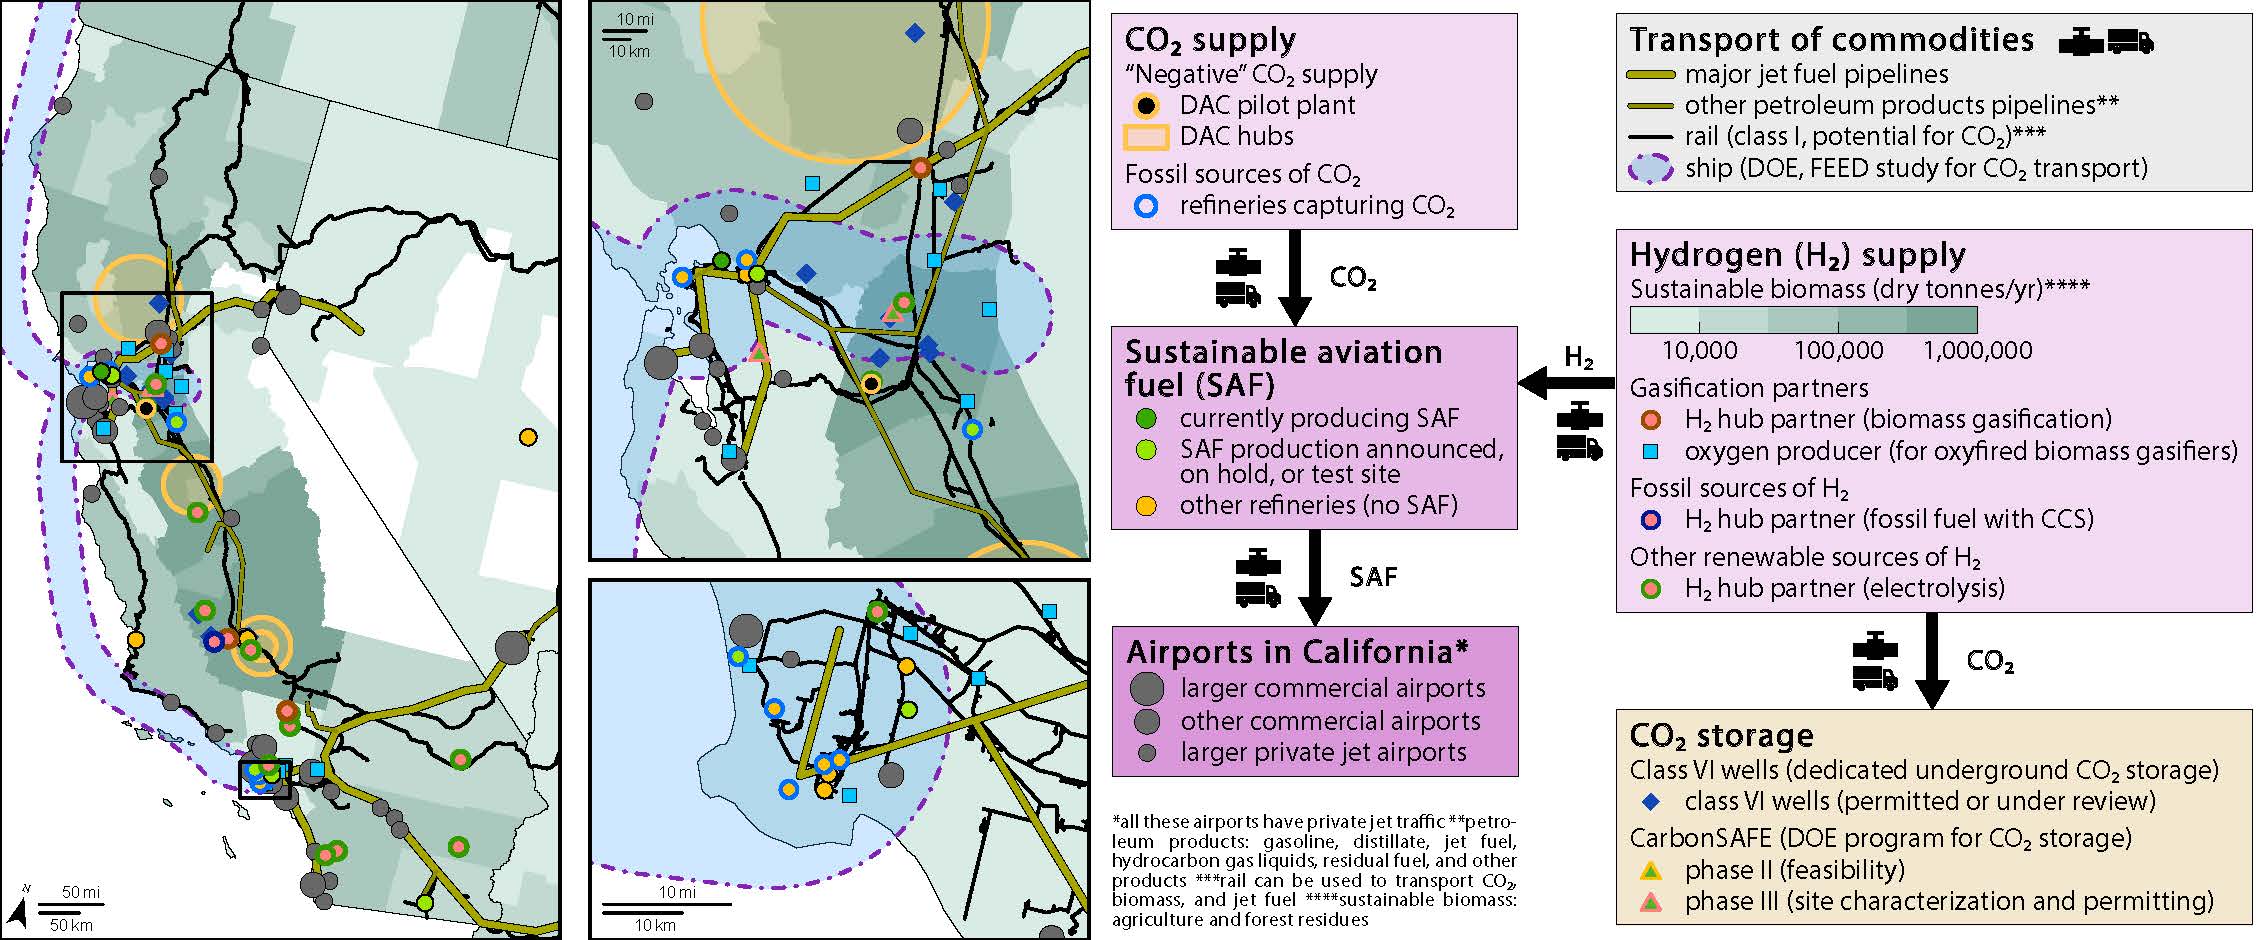
California as proving ground. We can also start where demand is concentrated. The Bay Area and Los Angeles are the perfect proving grounds: with ambitious climate targets, clean-fuel incentives, and refinery conversions (like Phillips 66 Rodeo, Chevron El Segundo). The region’s logistics—pipelines, ports, and rail—enable efficient feedstock and fuel transport (see Figures 1–2).

Figure 1: This figure is a map of California with zoomed in maps of the Bay Area and Los Angeles that concentrates most of the potential activity for SAF production. It shows locations of potential CO2 supply and hydrogen supply, locations of CO2 storage, existing locations of SAF production and locations of other refineries that could produce SAF in the future, and locations of commercial and main private jet airports in California. The map also shows pipelines for the transport of jet fuel, and rail and shipping lines that could be used for the transport of CO2 and biomass. Several options exist for the supply of CO2 and hydrogen to the Fisher-Tropsch process. The options for CO2 supply are a DAC pilot plant located in the Bay area and four DAC hubs located in the Central Valley for “negative” CO2 supply, and refineries capturing CO2 for fossil sources of CO2. Hydrogen can be supplied from biomass gasification, fossil fuels with CCS, or electrolysis. For the biomass gasification option, the map shows the dry tonnes of sustainable biomass available per county, with the highest potential in the Central Valley, hydrogen hub partners using biomass gasification, also located in the Central Valley, and oxygen producers located mostly in the Bay area and Los Angeles. One hydrogen hub partner plans to produce hydrogen from fossil fuels and to capture the CO2 with CCS in Kern County. The map also shows hydrogen hub partners using electrolysis (often powered with solar electricity) and located mostly in the Southern half of the state. Options for CO2 storage is class VI well for dedicated underground CO2 storage and mostly located in the Bay area and Kern County, and DOE CarbonSAFE projects phase III (site characterization and permitting) located in the Bay area.
Figure 1: Current SAF production in California, along with future opportunities for SAF production with a Fisher-Tropsch pathway (feedstock sourcing, transportation, CO2 storage) (NETL, ORNL, EPA-2022, EPA-2020, EPA-OW, EPA-GHGRP, airlines.org, ESRI-EIA, ESRI-FAA, ESRI-NTAD, ESRI-FAA, private-jets, OCED, Climate Program Portal, EIA, Aemetis, avancedbiofuelusa.info, aviationweek.com, californiaethanolpower.com)
Figure 2: This figure is a map of California with zoomed in maps of the Bay Area and Los Angeles that concentrates most of the potential activity for SAF production. It shows the location of current and potential SAF production pathways, jet fuel pipelines and rail for SAF transport, and private jet airports that could drive the demand for SAF. Current and announced SAF pathways in California are Hydrotreated Esters and Fatty Acids (HEFA), and alcohol-to-jet, and are in the Bay area and Los Angeles. Two refineries have announced production of over 100 million gallon per year, but others have not disclosed their production goals. Other refineries are also shown as potential locations for SAF production. An estimate of the CO2 emissions from private jets is shown as a density mapping layer and the jet fuel demand for private jet is shown in millions of gallons per year for each airport, most of the demand being concentrated in the Bay area and Los Angeles area.
Figure 2: Supply chain of SAF for private jets in California along with CO2 emissions and fuel demand from private jets (EPA, airlines.org, ESRI-EIA, ESRI-NTAD, private-jets, Climate Program Portal, EIA, Aemetis, avancedbiofuelusa.info, aviationweek.com, californiaethanolpower.com).

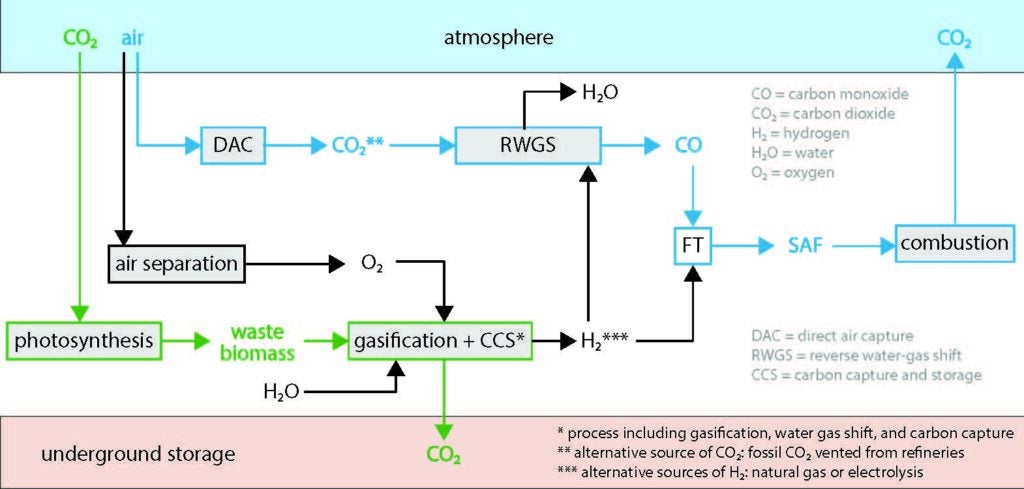
The pathway. FT synthesizes hydrocarbons from CO + H2. To stay fossil-free, CO2 from air is converted to CO via reverse water-gas shift (RWGS) using hydrogen from biomass gasification with CCS (see Figure 3). The CO2 captured from air becomes part of the fuel and returns upon combustion, while the biogenic CO2 from gasification is stored. When stored carbon exceeds lifecycle emissions, the fuel is net-negative. FT yields several products; the diesel-range fraction is upgraded to SAF.

Figure 3: This figure is a simplified process flow diagram of the SAF production process using a Fisher-Tropsch reaction. The top of the diagram is the atmosphere, and the bottom of the diagram symbolizes underground storage. The figure emphasizes the source of CO2 (the atmosphere) and the fates of CO2. Part of it gets stored in underground storage and part of it returns to the atmosphere. In this specific SAF pathway, CO2 is captured from the air using direct air capture and is transformed into carbon monoxide (CO) using a water gas shift process, which can then be fed to the Fisher-Tropsch reaction. Alternatively, CO2 could be sourced from high-purity CO2 currently vented at refineries. CO2 is also captured from the air by photosynthesis when biomass grows. Waste biomass is then fed into a gasifier along with oxygen and steam, to produce hydrogen. That gasifier is equipped with a carbon capture unit: the CO2 from biomass gasification is captured and stored underground. Alternatively, hydrogen could be sourced from natural gas with CCS or electrolysis. Part of the hydrogen is used in the aforementioned water gas shift reaction, and part of it is use in the Fisher-Tropsch reaction. The Fisher-Tropsch reaction produces SAF, and the CO2 contained in SAF returns to the atmosphere upon combustion in aircrafts.
Figure 3: Flow diagram of FT-SAF production from waste biomass and CO2 from the air (Pathway 1).

Activating the market. In the near term, FT-SAF production can use hydrogen from refineries with CCS (blue hydrogen), electrolysis, or high-purity CO2 streams now vented at refineries. While carbon negative FT-SAF production is ramping up, it can be blended with conventional jet fuel to progressively lower its carbon intensity at a small cost (see Figure 4). Under current ASTM D7566 specifications, FT-SAF can be blended up to 50 percent with conventional jet fuel (Jet-A) for commercial use—a threshold likely to expand as certification advances.

Figure 4: This figure is made of two panels showing graphs of the cost of SAF and carbon intensity for different blends of SAF with commercial Jet A for two SAF pathways. The horizontal axis represents the volume percentage of SAF, with 100% commercial Jet A on the left and 100% SAF on the right, with a vertical line symbolizing the 50-50 blend. The left-hand graph shows a blend of SAF with commercial Jet A, the hydrogen source is biomass gasification, and the CO2 source is direct air capture. The left vertical axis shows the cost in dollar per gallon at around 2.5 dollar per gallon for commercial Jet A. For 100% SAF, the unincentivized cost is about 14.8 dollar per gallon with a 3.3 dollar per gallon uncertainty. The cost drops when we consider incentives. Adding the 45V incentive for hydrogen production, that cost drops to 10.6 dollar per gallon. Adding also the 45Q incentive for carbon capture and storage, that cost drops further to 8.4 dollar per gallon. And adding also the low-carbon fuel standard, the cost with all the incentives drops to about 7.0 dollar per gallon. The right vertical axis shows the carbon intensity of the fuel. While jet A is carbon positive slightly below 10 kilograms of CO2 per gallon, SAF is carbon negative at about -22 kilograms of CO2 per gallon, and with a carbon neutral blend at 31% SAF 69 % jet A. The right-hand graph shows a blend of low-carbon synthetic jet fuel from fossil CO2 with commercial Jet A, the hydrogen source is biomass gasification, and the CO2 source is free industrial CO2. Some industries are currently venting high-purity fossil CO2 in the atmosphere. This study assumes that the CO2 is instead used for SAF production. The left vertical axis shows the cost in dollar per gallon at around 2.5 dollar per gallon for commercial Jet A. For 100% low-carbon synthetic jet fuel, the unincentivized cost is about 6.6 dollar per gallon with a 2.7 dollar per gallon uncertainty. The cost drops when we consider incentives. Adding the 45V incentive for hydrogen production, that cost drops to 2.4 dollar per gallon. Adding also the 45Q incentive for carbon capture and storage, that cost drops further to 1.6 dollar per gallon. And adding also the low-carbon fuel standard, the cost with all the incentives drops to about 0.2 dollar per gallon. The right vertical axis shows the carbon intensity of the fuel. While jet A is carbon positive slightly below 10 kilograms of CO2 per gallon, SAF is carbon negative at about -17 kilograms of CO2 per gallon, and with a carbon neutral blend at 37% SAF 63 % jet A.
Figure 4: Cost of FT-SAF pathways with policy incentives in California (45Q for CO2 capture, 45V for hydrogen production, and LCFS). Biomass gasification supplies H2 and captures biogenic CO2, but 45Q and 45V are not stacked; here, 45V applies to the H2 source and 45Q to the CO2 source. Pathway 2 uses CO2 from fossil streams and represents a transitional synthetic fuel. FT-SAF must currently be blended with at least 50 % conventional jet fuel (excluding greyed-out areas).

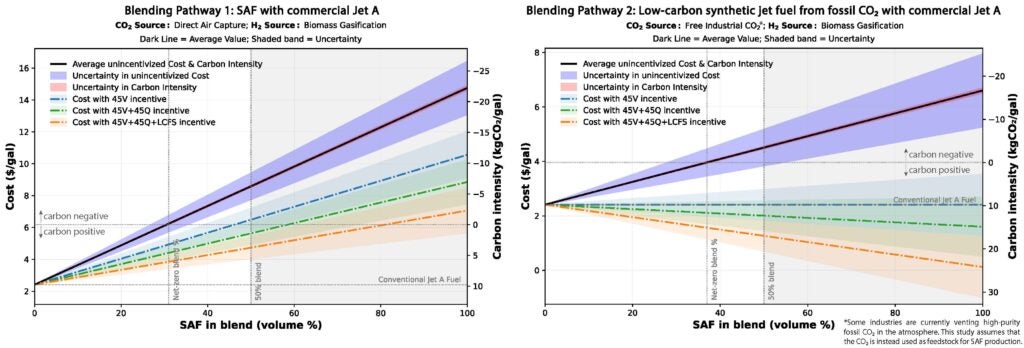
Economics and policy. Today, conventional jet fuel averages around $2 per gallon. Early FT-SAF will certainly carry a premium, but federal and state incentives can help close the cost gap. For example, California’s LCFS and federal 45Q, 45V, and 40B / 45Z credits reward verified lifecycle reductions. 40B applies through 2024, transitioning to 45Z in 2025. Each can pair with LCFS but not with each other.

Globally, CORSIA (the Carbon Offsetting and Reduction Scheme for International Aviation) sets standards for lifecycle accounting, meaning FT-SAF that meets these criteria can qualify for both compliance and voluntary markets. Premium-priced, multi-year offtake agreements from private aviation and philanthropic buyers can further accelerate deployment. Concentrated demand at a few airports simplifies logistics and enables targeted infrastructure: DAC and gasification co-located with refineries, oxygen supply, and Class VI wells for CO2 storage.

Next steps. Three actions can build momentum:

  1. secure multi-year offtakes for carbon-negative SAF at key private-aviation airports
  2. develop regional “SAF hubs” co-locating DAC, biomass-to-hydrogen, FT units, and storage (e.g., Bay Area, Kern County)
  3. ensure rigorous monitoring, reporting, and verification (MRV)

Though focused on California, we can use this model wherever biomass, storage, and low-carbon power align. Private-aviation and philanthropic leadership can accelerate circular jet fuel—using atmospheric carbon to make fuel rather than offset emissions.

Hélène Pilorgé

Research Associate, Clean Energy Conversions Lab

Hélène Pilorgé is a research associate with the University of Pennsylvania’s Clean Energy Conversions Laboratory. Her research focuses on carbon accounting of various carbon management solutions and on Geographic Information Systems (GIS) mapping for responsible deployment of carbon management.

Shrey Patel

PhD Candidate, Chemical and Biomolecular Engineering

Shrey Patel is a PhD candidate in the Department of Chemical and Biomolecular Engineering at the University of Pennsylvania. His research focuses on the integration of carbon dioxide removal with low carbon energy sources.

Greg Cooney

Senior Fellow

Greg Cooney is a senior fellow at the Kleinman Center. He previously served as director of the policy and analysis division in the U.S. Department of Energy’s Office of Carbon Management.

Makenna Damhorst

Undergraduate Seminar Fellow

Makenna Damhorst is a third year student in earth and environmental science. Damhorst is also a 2025 Undergraduate Student Fellow. She conducts research with the Clean Energy Conversions Laboratory.

Jennifer Wilcox

Presidential Distinguished Professor

Jen Wilcox is Presidential Distinguished Professor of Chemical Engineering and Energy Policy. She previously served as Principal Deputy Assistant Secretary for the Office of Fossil Energy and Carbon Management at the Department of Energy.