Leveraging Clean Energy to Alleviate Regional Water Stress

Today’s energy system requires an enormous amount of water for cooling and steam production. In addition to being low-carbon, renewable energy technologies such as photovoltaics and wind turbines are also low-water. In water-stressed regions, this may be another justification for a rapid transition to renewable energy.
At a Glance
Key Challenge
In total, approximately 16 billion cubic meters of water are consumed by the energy system each year—roughly equivalent to half of the total public supply of water distributed by water utilities to towns and cities across the country.
Policy Insight
Local water stress, and the relative water efficiency of different energy sources can be an additional criteria to inform the energy transition and prioritize legacy asset retirement.
Executive Summary
The global energy transition is a brown-to-green transition. The responsible, sustainable, and just retirement of legacy assets from two decades of industrial development is one of the greatest challenges facing the United States in the decades to come. Developing sound strategies for determining when and how to retire legacy power plant assets will be crucial in supporting a rapid transition to renewable energy sources such as solar and wind.
Typically, profitability has guided and prioritized asset retirement, but in the face of climate change, there have been various efforts to internalize the cost of carbon emissions into a roadmap for legacy assets. However, carbon emissions are far from the only externalized costs of legacy fossil fuel assets that could be used to help inform where and when retirement should be pursued. Water demand and consumption is another valid metric in measuring the true cost of continued reliance of fossil fuel powerplants—especially in regions that already experience a degree of water stress.
This report seeks to quantify local water stress in the U.S. by county and compare the water efficiencies of both carbon-based and low carbon energy sources. We find that local water stress is most concentrated in the Southwest, as one might expect, but that localized pockets of water stress can be found throughout the country, demonstrating that water consumption by the power sector is relevant to more than just a small handful of states.
Furthermore, we show that some carbon-neutral energy sources such as wind turbines and photovoltaics have extremely minimal water demands, whereas other sources such as solar thermal, geothermal, nuclear, and biomass energy have water demands that rival and, in some cases, even exceed the water demands of legacy fossil fuel assets.
We conclude that there are several counties concentrated in California, New Mexico, and Texas where the water consumption of legacy fossil fuel assets ought to be considered strongly in scheduling the retirement of said assets. We also observe that continued investment in power generation, even water-conserving technologies such as wind turbines or photovoltaics could still represent a significant burden on local water resources depending on their scale and on local levels of water stress.
Introduction
Nearly all of the devastating effects of climate change relate in some way to the changing distribution of water. Climate change is expected to make our planet warmer and wetter on average, but this trend will not be uniform worldwide. Many areas of the globe, especially those that already experience a degree of water scarcity, are expected to become even drier (CCES 2020).
Around the world—from the Southwestern United States to the Mediterranean, from Western China to the grasslands of Australia—arid regions are experiencing desertification, where moisture levels become insufficient to support existing ecosystems and soils (D’Odorico et al. 2013). In addition to these gradually-accumulating impacts of climate change, many regions are suffering the consequences of historically unsustainable water usage—reservoirs and rivers have been used to support an unsustainable level of demand at the cost of long-term availability (World Resources Institute 2019).
The energy-water nexus, the inextricable link between energy demand and water demand, is essential in understanding current water use, especially in energy-hungry developed nations (DOE 2014). In the United States, the energy sector (excluding non-consumptive hydropower) accounts for 40% of total water withdrawals.
In total, approximately 16 billion cubic meters of water are consumed by the energy system each year—roughly equivalent to half of the total public supply of water distributed by water utilities to towns and cities across the country (Grubert and Sanders 2018). Faced with the pressing environmental challenges of the 21st century, policymakers, advocates, and researchers have come to focus on our energy system’s carbon emissions as the primary measure of sustainability within the sector.
While the impact of carbon emissions on the planet’s atmosphere is the most urgent environmental consideration of energy use today, it is not the only resource constraint within which our global energy system operates. Furthermore, the global energy transition needs to be recognized as a “brown to green” transition (Hughes 2020). The legacy fossil fuel energy assets that sustain our economy today, such as coal power plants, pipelines, and refineries should not be ignored when developing a plan for how we build the energy system of tomorrow.
To ensure the smooth, rapid, and efficient cleaning of our energy system, it is critical that we have a roadmap for legacy asset retirement, including robust and consistent mechanisms for determining retirement prioritization.
A Roadmap for Asset Retirement
The default metric for determining infrastructure retirement is profitability. The primacy given to this single economic measurement is, in large part, the reason advocates for clean energy place such importance on the introduction of a carbon price, cap, or tax—a regulation that would immediately reduce the relative profitability of high-carbon energy assets. However, there are other measurements, often related to the natural resource constraints within which the energy sector operates, that can be used to inform a retirement roadmap for generation assets.
Emissions intensity, for example, is an alternative measurement for informing an assets retirement horizon; one that can be internalized with a carbon price by linking emissions intensity with an asset’s profitability. Incorporating emissions intensity measurements into the development of a legacy asset retirement plan would mean prioritizing the retirement of a coal-fired power plant over the retirement of an equally profitable natural gas fired power plant, for example (EIA n.d.).
Another reasonable determinant could be the public health impacts of energy sector emissions—prioritizing the retirement of legacy energy assets near population centers (particularly near vulnerable populations) by attaching a price to human health impacts.
Resource demands, including an asset’s withdrawals and consumption of water within the context of local water stress, should be considered as another important indicator in deciding when to retire legacy energy assets. By tracking regional levels of water stress and calculating the local water demands of power generators by county or facility, a roadmap for electricity generation asset retirement can be formulated that considers sustainable water use in addition to profitability, emissions, etc.
Although various historical and political considerations keep the actual price of water artificially low in most regions, this roadmap could introduce a higher water price for planning purposes (Fabiyi 2019). By proactively considering the water demands of a low-carbon energy system, this roadmap could also help to inform the optimal distribution of new energy investments.
This report attempts to lay the groundwork for this exercise by demonstrating the regional and county-level relationships between electricity sector water use and regional water stress.
Understanding U.S. Water Stress
Water stress, as defined by the World Resources Institute, is distinct from water availability. Where water availability describes a region or basin’s supply of freshwater, water stress describes a function of renewable freshwater resources against water withdrawals and consumption (Hofste et al. 2019). A basin could, for instance, have a high availability of water, but could still experience a high level of water stress if competition for water is high or if regional withdrawals and consumption rely upon a non-renewable source of freshwater (e.g. an aquifer that is being drawn from at a faster rate than it is being naturally replenished).
Counties in the continental United States experience a wide range of water stress levels, and some regions experience higher or lower water stress than their climatological characteristics would indicate because of exceptionally high or low demand for water resources within that basin.
Figure 1 shows the water stress by county for the continental United States. This data was collected using county centroids as inputs into the World Resources Institute’s Aqueduct Water Risk Atlas. Figure 1 and all subsequent map figures were created using the online Datawrapper mapping tool. These maps are free to create and offer functionality to share data as re-use.
The values for each county in Figure 1 represent WRI’s measurement of present day water stress as calculated by Equation 1:
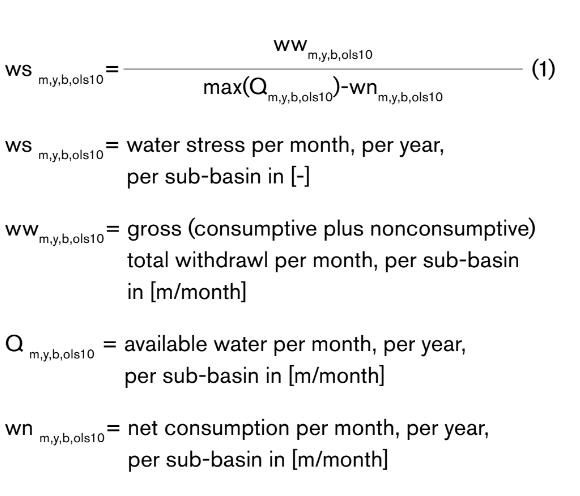
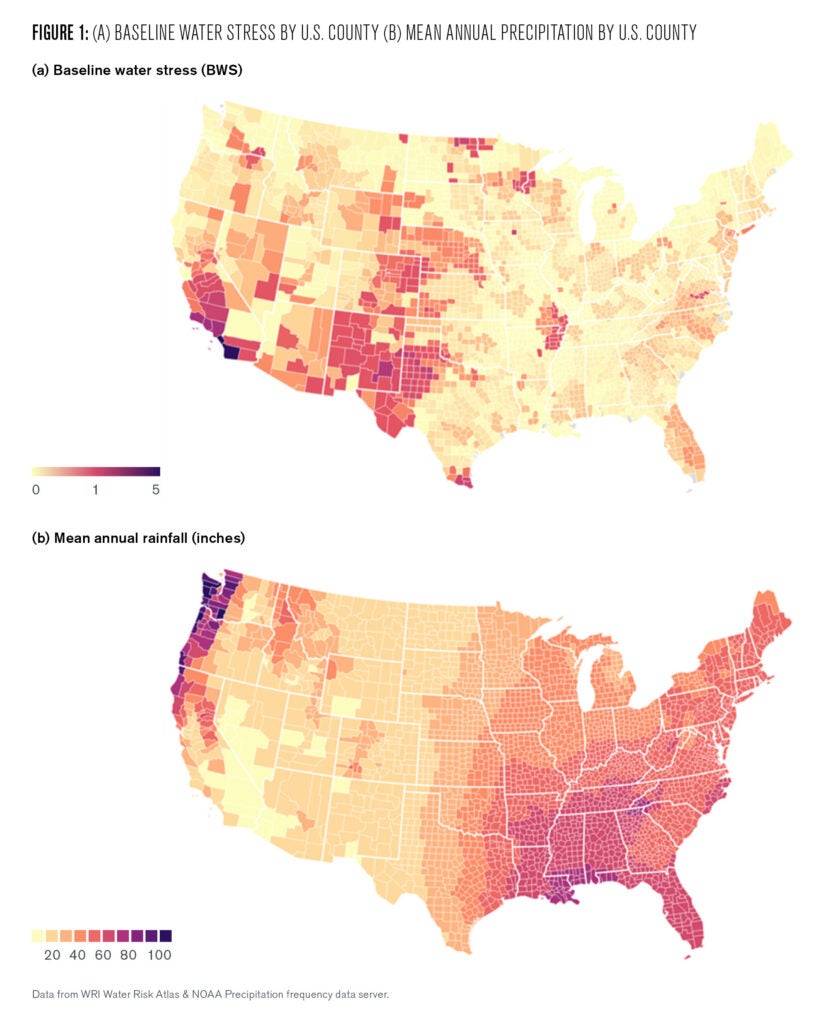
According to Equation 1, any county with a water stress value of 1 or higher is annually withdrawing more water than what is naturally replenished—either by depleting aquifer reserves or by borrowing from neighboring counties. Even counties with a water stress value close to 1 indicates a vulnerability to future water stress if demand increases or resources dwindle as climate change progresses.
Figure 1a shows that for the continental United States, water stress is primarily concentrated in areas of the Southwest, particularly Western Texas, New Mexico, Arizona, Southern California, and Colorado. One might expect these regions to experience high water stress given their low precipitation (Figure 1b). However, Figure 1 also reveals that states such as Florida, North Carolina, Virginia, New Jersey, Minnesota and North Dakota also experience somewhat elevated water stress despite access to abundant natural water resources.
Withdrawals vs. Water Consumption
Water use is typically measured in two ways: water withdrawals and water consumption. It is important to note that Equation 1 incorporates both water withdrawals and water consumption in its calculation of water stress (Duke Energy 2008). Water consumption describes the removal of water from its originating source without returning it to the basin. This characterizes water that evaporates, is transpired by plants, or consumed by livestock or people. Agriculture is the source of most water consumption (Wada et al. 2016). Water withdrawal, on the other hand, refers to the removal of water from its originating source without consideration of its fate after use. In other words, withdrawn water encompasses all types of water usage, including water that is eventually returned to its source and water that is consumed.
Although roughly 90% of withdrawn water is eventually returned to the same basin, total demand for water still has profound implications for regional sustainability. Withdrawn water is rarely returned directly to the same source and rarely at the same quality. Aquifer withdrawals may be discharged at the surface where they may eventually leave the county and pure water may be returned contaminated or at a different temperature (unless it undergoes treatment ahead of time). A region’s water supply is fundamentally limited by the water available for withdrawal at any given time—withdrawing too high a percentage of available water can lead to significant operational risk and ecological damage (World Economic Forum 2009).
Water Use by the Power Sector
Water use by the power sector is characterized by on-site generation demands and by each stage in the life cycle of a generation source. For example, water is required for the mining, refining, and transportation of several fossil fuels. These processes usually occur in locations that are not local to the electricity generation sites. Therefore, for the purposes of this analysis, we only consider the “on-site” water usage of electricity generation at the power plants. This allows us to determine the types of generation that could have immediate and substantial impacts on local water systems upon retirement.
The decision to analyze only on-site water use is further justified by the fact that more than 90% of withdrawn water in the existing energy system (excluding hydroelectric power) is used for the generation of electricity at power plants (see rows 2 and 3 in Table 1). Similarly, water consumption at power plants makes up almost 50% of energy-related consumption. This water use is mostly attributable to the cooling systems for steam-cycle turbines at thermoelectric facilities.
There are two main types of cooling systems that use water: once-through cooling and recirculating cooling systems. Once-through cooling systems use withdrawn water to cool down steam before discharging it to the original source after each use. About 75% of power plant withdrawals are used in these systems, but only 4% is consumed. On the other hand, recirculating cooling systems reuse water for multiple cycles and thus withdraw less water overall but consume up to 80% of the withdrawn water (Wartsila n.d.).
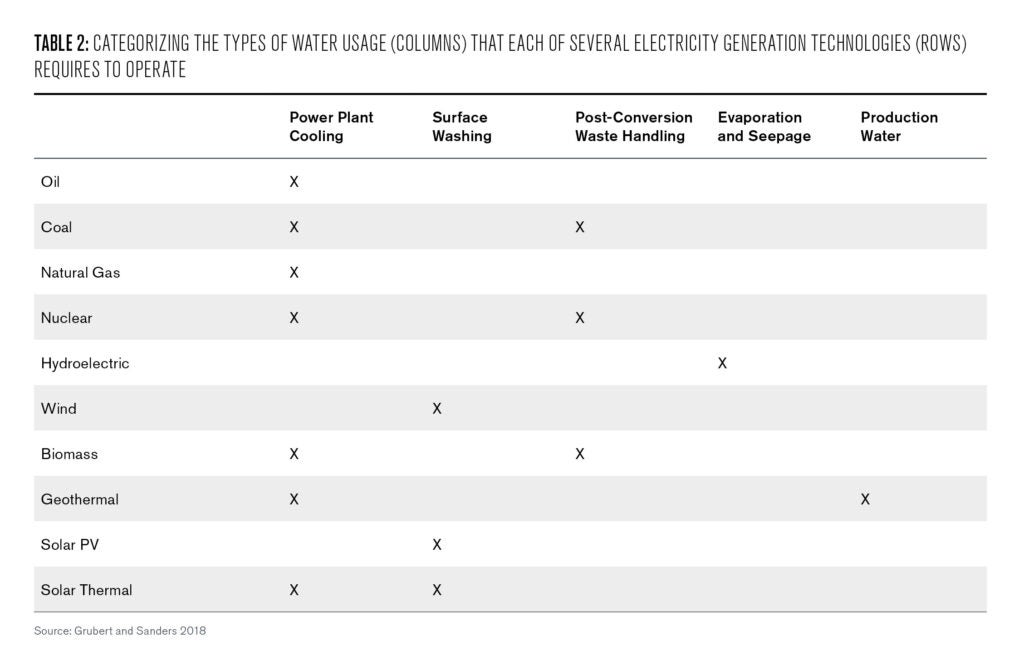
Geothermal plants consume additional water (referred to as production water) because of loses to the surrounding geological formation (Harto et al. 2013). In addition, a small percentage of water in the power sector is consumed during post-generation operations at the power plants: coal and solid biomass power plants consume water for ash handling and nuclear power plants consume water for spent-fuel pool operations.
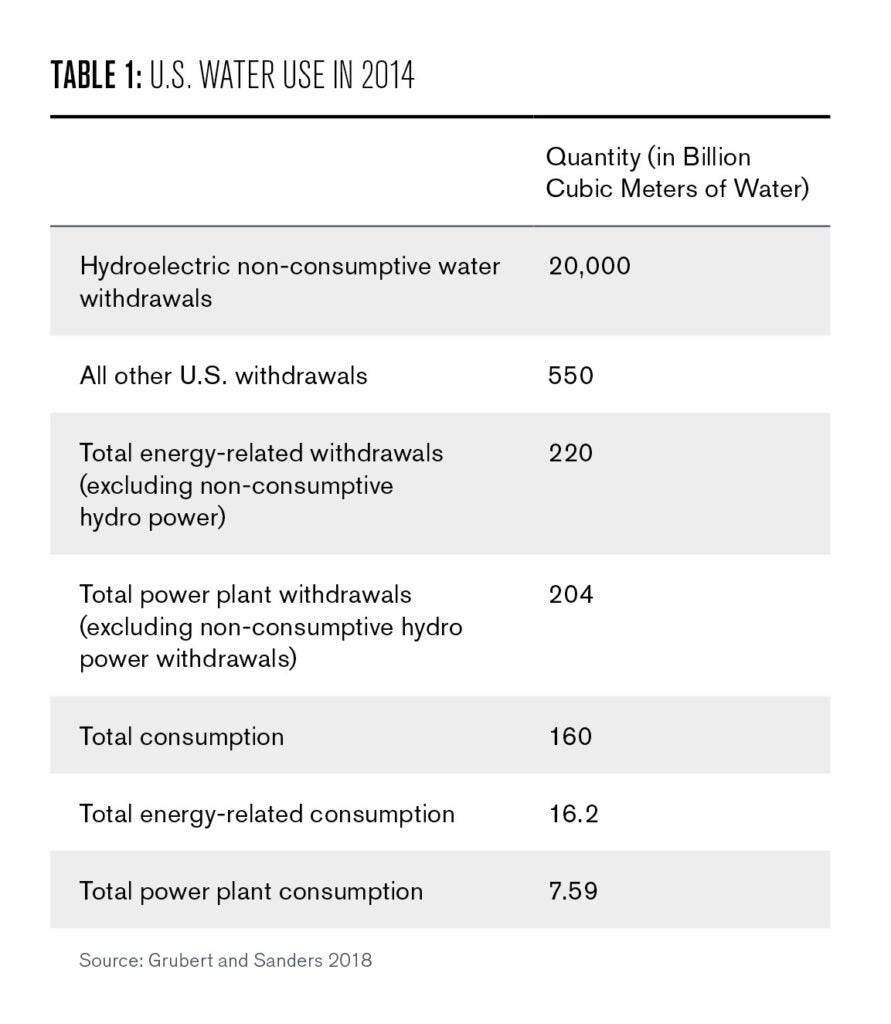
As is clear from Table 1, the water use characteristics of hydroelectric power plants are unique, to say the least. Alone, these facilities collectively “withdraw” approximately 50 times more water than all other water uses in the country combined. At the same time, hydroelectric dams can serve a critical role in ensuring a sustainable supply of water to nearby development—the American Southwest, in particular the cities of Phoenix, Las Vagas, and Los Angeles are sustained in part thanks to the reservoirs created by hydroelectric dams along the Colorado River (Di Baldassarre et al. 2021).
Granted, the construction of dams irreparably alters the hydrology and ecology of the downstream basin but dismantling them is not a viable solution for improving local water security. In most cases, it would have the exact opposite effect. Water consumption by hydroelectric facilities includes the water lost to evaporation in the reservoir and seepage into surrounding geological formations.
Water Usage by Generation Source
Grubert and Sanders conducted extensive water use analysis of multiple life-cycle stages of various generation sources in 2014. We extracted the on-site water use data from that work and tabulated the water usage for the processes listed in Table 2. The following generation sources were considered: oil, coal, natural gas, nuclear energy, solid biomass, biogas, hydropower, wind, geothermal, solar photovoltaic, and solar thermal.
Using national totals for each technology and generation source, we first compared the volume of water withdrawn each year in Figure 2. As mentioned before, hydroelectric power was more than two orders of magnitude larger than the next largest withdrawing source (coal-fired power plants). This outlying data point speaks to the unique generation method of hydroelectricity which uses water as the generation source. Following hydropower, coal-fired power plants (109 billion cubic meters), nuclear power (70.6 billion cubic meters) and natural gas (17.8 billion cubic meters) were the next largest withdrawing sources. For consumed water, the comparison is shown in Figure 3. The data on consumptive water exhibited similar trends to withdrawn water, with hydropower being the largest consumer followed by coal, nuclear, and natural gas.
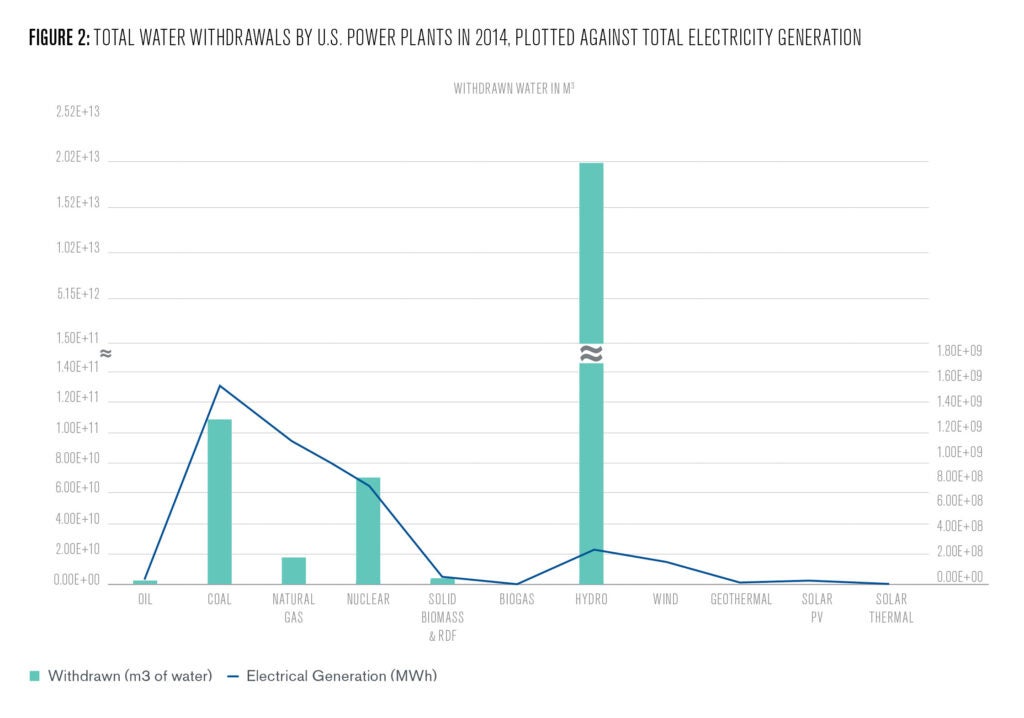
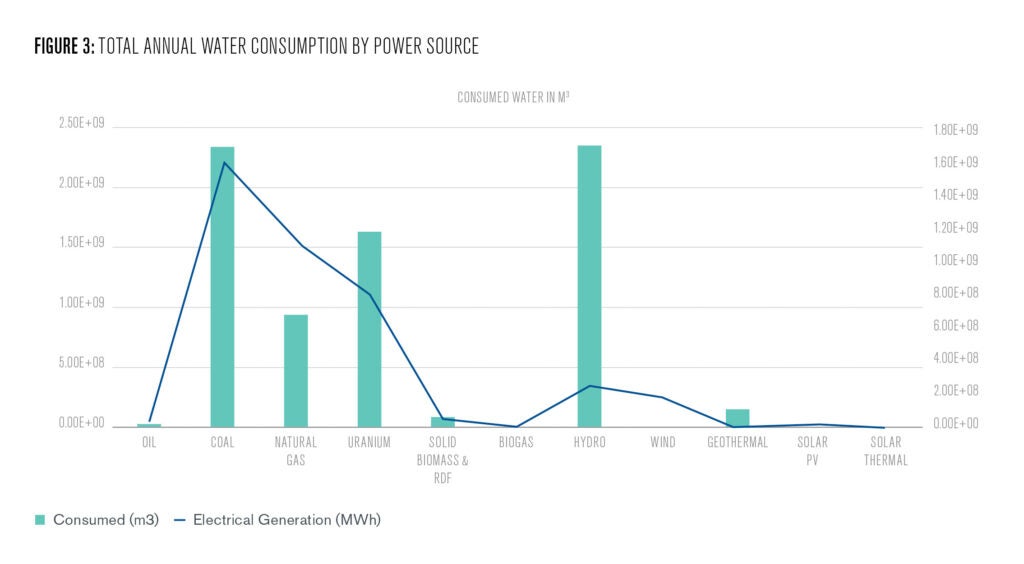
The intense water withdrawals of coal-fired and nuclear power plants can to some extent be attributed to the substantial electrical generation capacity of these plants. This is visualized in Figures 2 and 3 by the line plot showing the electricity generated by each source in 2014 (in MWh on the secondary y-axis).
Coal-fired power plants contributed the highest share of electricity to the U.S. energy system, totaling 1.58 billion MWh. Nuclear and natural gas generation also contributed significantly to total electricity generation. To decouple the overall generation capacity from the water data for a comparison of the water use efficiencies, we analyzed the volumes of water required per MWh of generation.
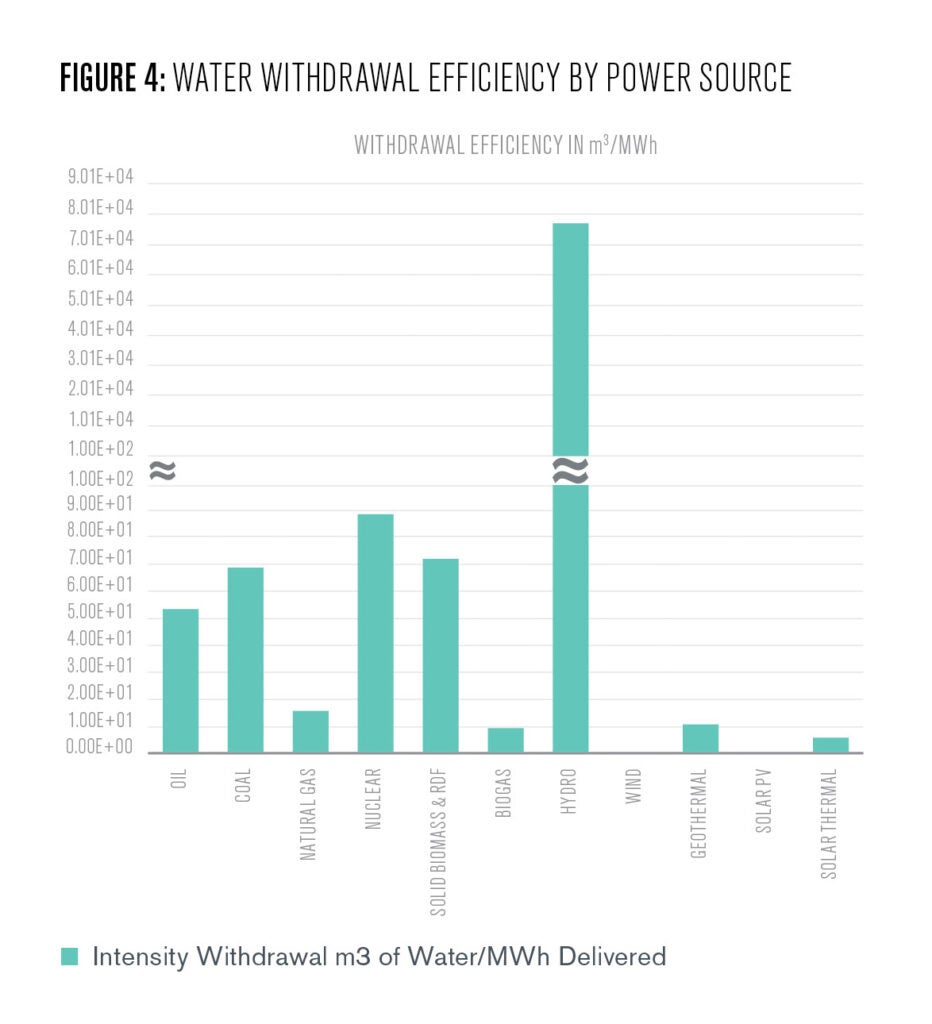
Figures 4 and 5 respectively show the amount of water withdrawn and consumed per MWh of electricity generated. Excluding hydropower, nuclear power demonstrated the worst withdrawal efficiency, requiring 88.6 m3 of water per MWh of electricity generated. Also notable was the fact that solid biomass generation has a worse withdrawal efficiency than the three fossil fuel sources that we analyzed (oil, coal, and natural gas).
These results highlight the water withdrawal intensity of steam-cycle power plants. Almost all coal, nuclear, and solid biomass generators, the three most withdrawal-intensive generation methods aside from hydropower, are steam-cycle power plants. Consistent with this observation, natural gas is relatively water efficient compared to other fossil fuel sources due to its use of gas turbines in addition to steam turbines in combined-cycle gas plants (Macknick et al. 2012). Steam-cycle turbines require significant amounts of cooling water to condense the steam back into water (Reimers 2018).
Analysis of consumption intensities shown in Figure 5 provides an interesting perspective on several generation sources that are often viewed as renewable and environmentally friendly. Hydropower and geothermal power showed the worst consumption efficiencies per unit of energy. Solar thermal generation is also relatively consumption intensive due to the lower generation temperature compared to fossil fuel-powered generation. This results in lower heat efficiencies and more water required for active cooling. Notably, steam-cycle power plants show better water consumption efficiency than hydro, geothermal, and solar thermal generation.
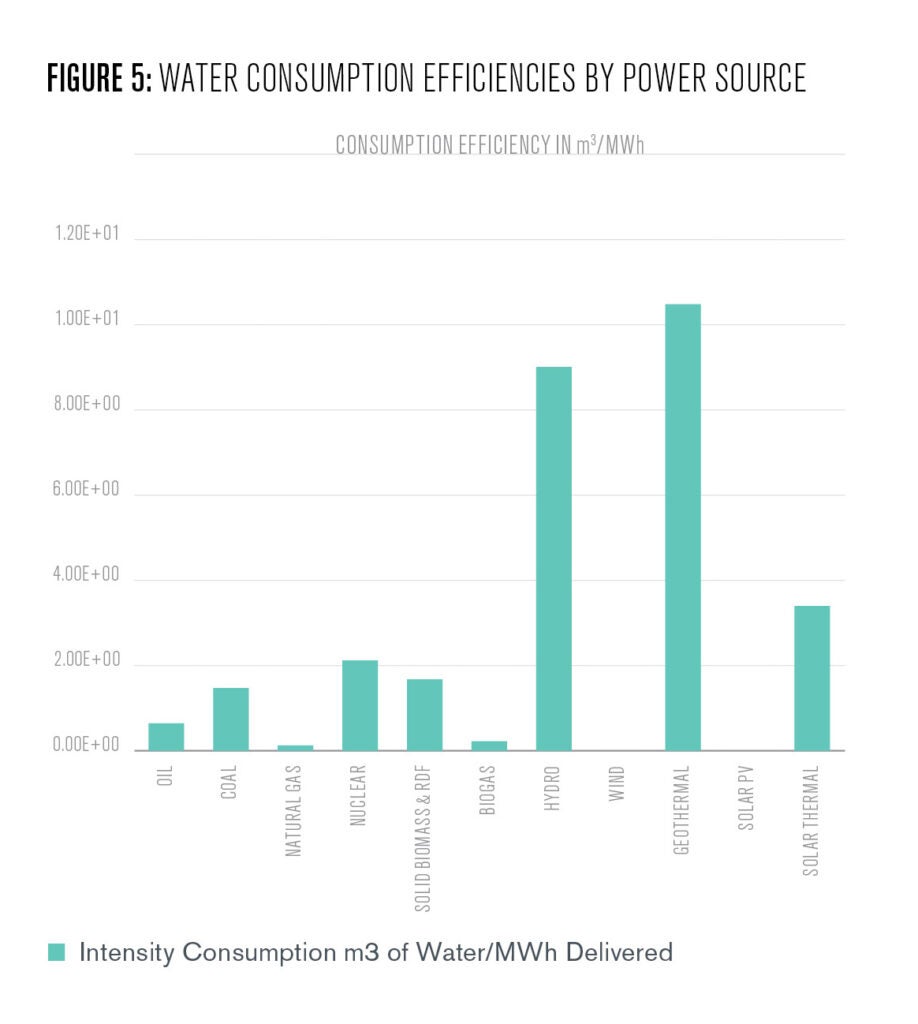
A consistent feature among the data presented above is the low water intensity of wind and solar photovoltaic (PV). The operation phase of a wind turbine and PV panel consumes small quantities of freshwater for periodic washing to maximize generation efficiency. It is worth noting, however, that water consumption and withdrawal during the operation phase of wind turbines and solar PVs comprise a relatively small portion of the water used in their life cycles
Despite this, water use over the entire lifecycle of a wind turbine or solar panel remains more efficient than the on-site usage of most other sources (Jin et al. 2019). The fact that off-site water use accounts for a large portion of the life-time water use for these generation methods does not affect the conclusion that these are currently the most water efficient generation sources.
Mapping Regional Power Sector Demands
The next phase of this analysis was to calculate county-level power sector demands using the withdrawal and consumption averages from the above graphs and county-level data of generation by source. These county-level demands include both local withdrawals and consumption as well as all existing exports of water to neighboring counties.
Throughout this phase of the analysis, we made the decision to exclude hydroelectricity. There were several reasons for this, the first being hydroelectricity’s unique relationship to water. Hydroelectric power withdraws a vast quantity of water in one sense, but also permanently concentrates water resources upstream of its turbines, supporting a much higher rate of local water use. This makes directly comparing the water use of hydroelectric power to other generation sources a considerable challenge.
Furthermore, hydroelectric power is much more geographically constrained and concentrated than other energy sources given its specific topographical requirements. Since the goal of this analysis is to inform the retirement of legacy assets and the development of new power plants, the inclusion of hydroelectric generation capacity only served to obscure the most relevant policy insights related to fossil fuel generation and renewables.
Figure 6 shows county-scale generation of all generation types with and without hydropower. These generation values were calculated using the nameplate capacity (greater than 1MW) of all individual power plants in a given county (NC), and multiplying them by the appropriate annual capacity factor (CF) for each generation type, see Equation 2 (EIA 2021).

n is the number of power plants in a county, NC is the annual nameplate capacity of a given power plant, CF is the capacity factor of that generation type.
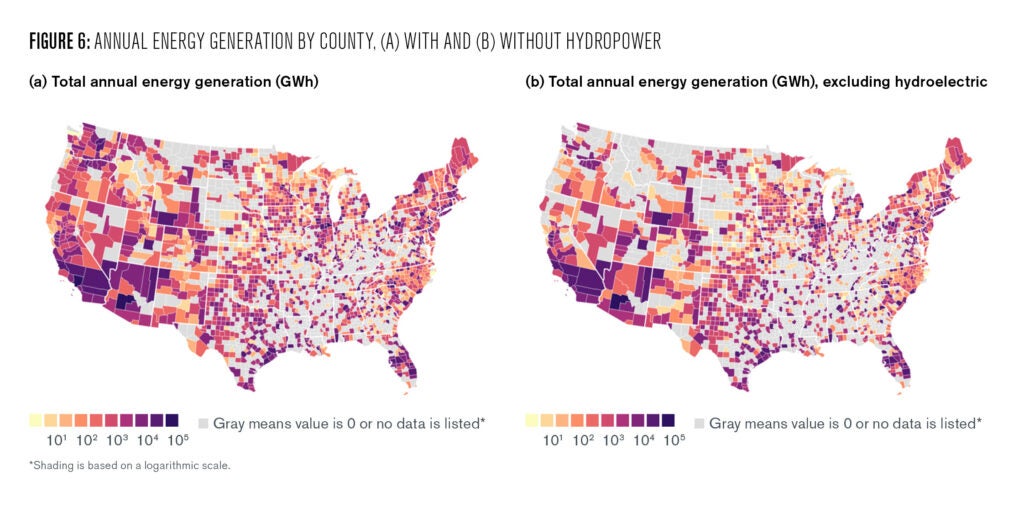
Figure 6 demonstrates that energy generation is regionally dispersed but shows some consolidation around population centers (e.g. Southern California, the Northwest, Southeastern Texas, Florida, the Northeast, and Lake Michigan). Figure 6 does not show any noticeable relationship between generation and baseline water stress or average rainfall (see Figure 1).
In Figure 7, we show the calculated county-specific water consumption from the power sector, with and without hydropower. The concentration of hydroelectric power in the Northwest and New England is made obvious by the comparison of 7a and 7b. These water consumption values are calculated by taking the total annual energy generation of each generation type in each county (as shown in Figure 6), and multiplying each energy type by the consumption intensity in Figure 5:

Where AEGj is the annual energy generation of a given generation type (i.e. coal, solar, wind, etc.) in a county, and CIj is the consumption intensity of that given generation type (from Figure 5).
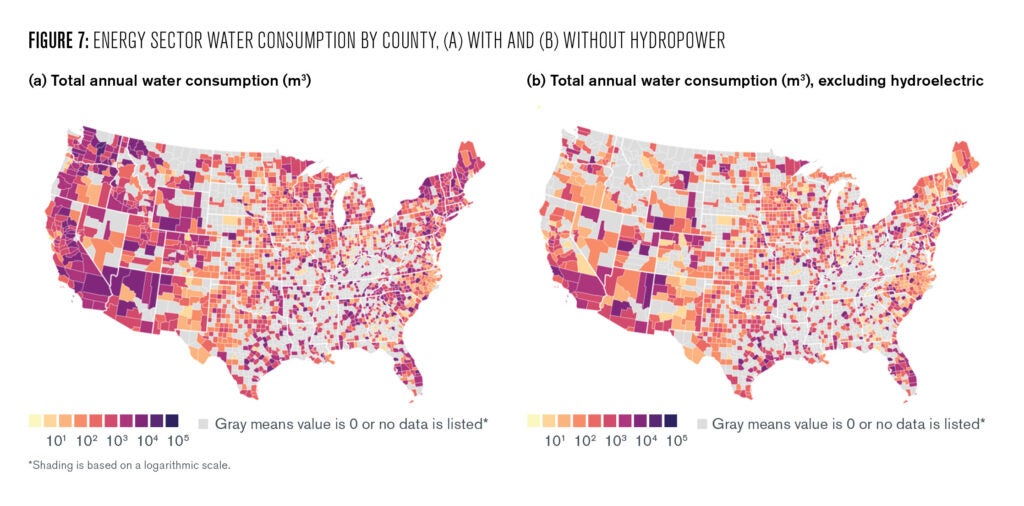
We then use the same Equation 3 to calculate the water withdrawals of all power sources excluding hydroelectric, since we already established earlier that the water withdrawal intensity of hydropower is orders of magnitude higher than other energy sources and has different characteristics.
We made the decision to focus our analysis on water withdrawals rather than water consumption, since the energy sector is a much larger contributor to this type of water demand. Withdrawn water, although technically returned to the same basin, still has considerable ecological ramifications and contributes strongly to regional water stress due to its displacement, heating, and contamination.
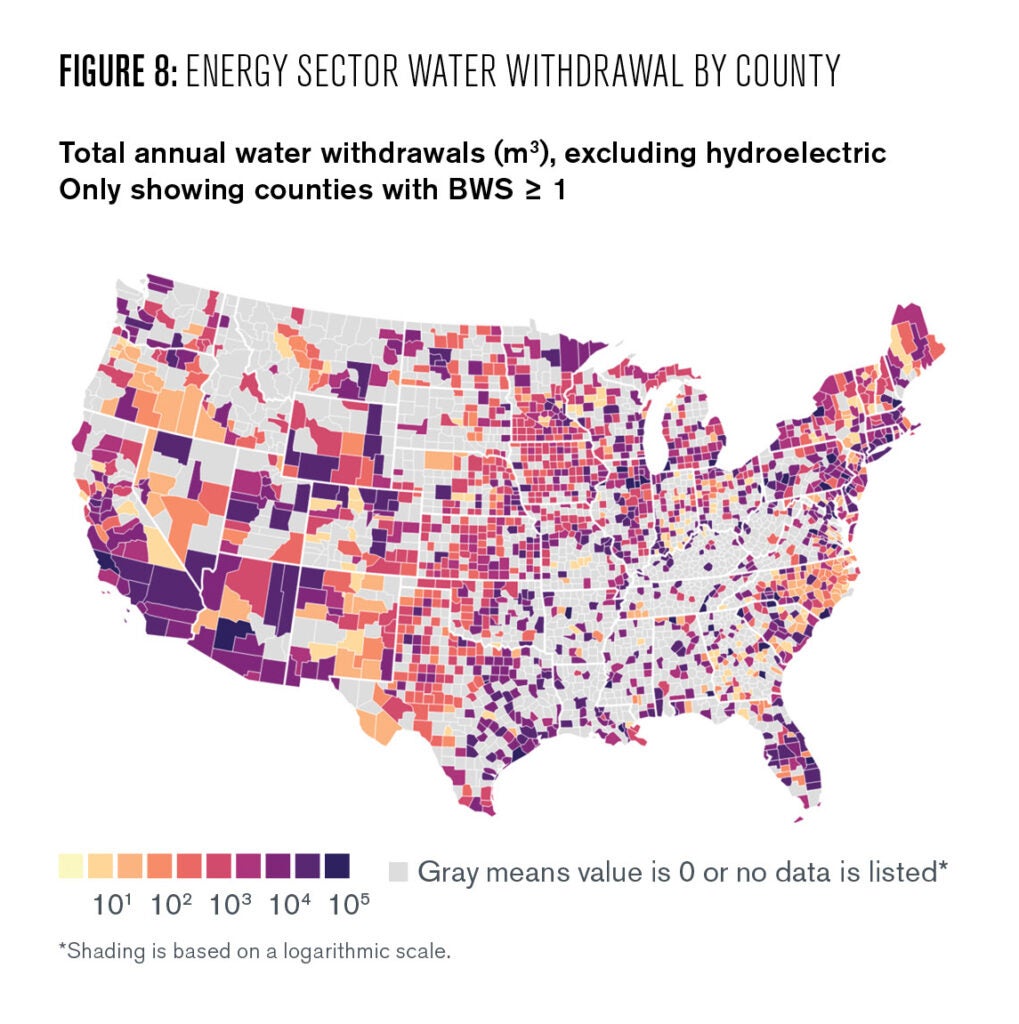
Much like generation capacity, Figure 8 suggests that water withdrawals from energy generation are geographically dispersed, closely aligned with population centers, and do not appear to strictly follow patterns of regional water availability. To further explore the relationship between power sector water demands and regional water stress, we highlight those counties from Figure 8 where the local water stress (BWS) value is 1 or higher—indicating that a county’s current use of water is unsustainable in the long-term.
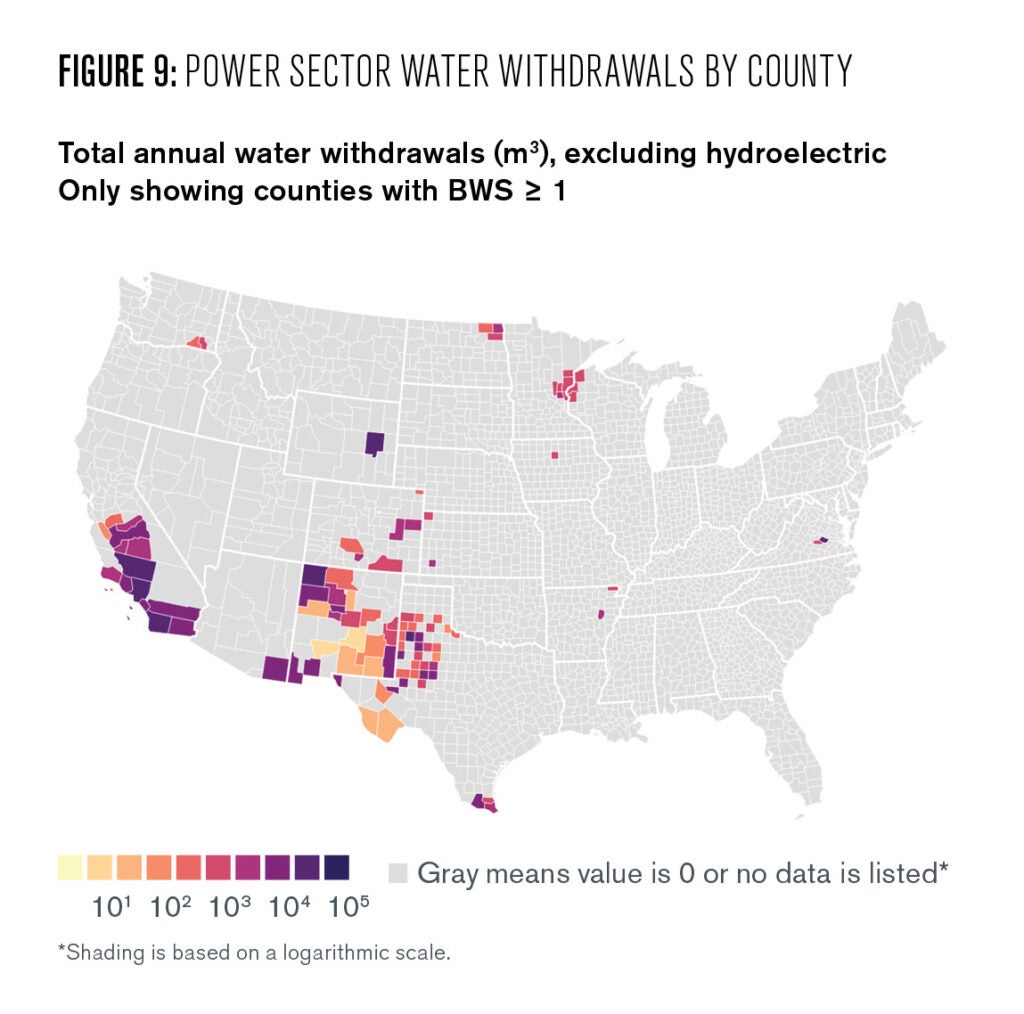
Any county that is highlighted in Figure 9 has existing grid-scale generation assets and is currently practicing some level of unsustainable long-term water use. Counties that are a shade of purple in Figure 9 have power sector water withdrawals in excess of 10,000,000 m^3 per year —enough to support the annual residential water needs of more than 70,000 Americans (USGS n.d.).
Understanding the types of generation present in these counties of highest concern is critical to understanding if and how changes in the U.S. generation portfolio may help or worsen local water stress. Figure 10 breaks down generation (GWh) by source for those counties with a BWS value ≥ 1.
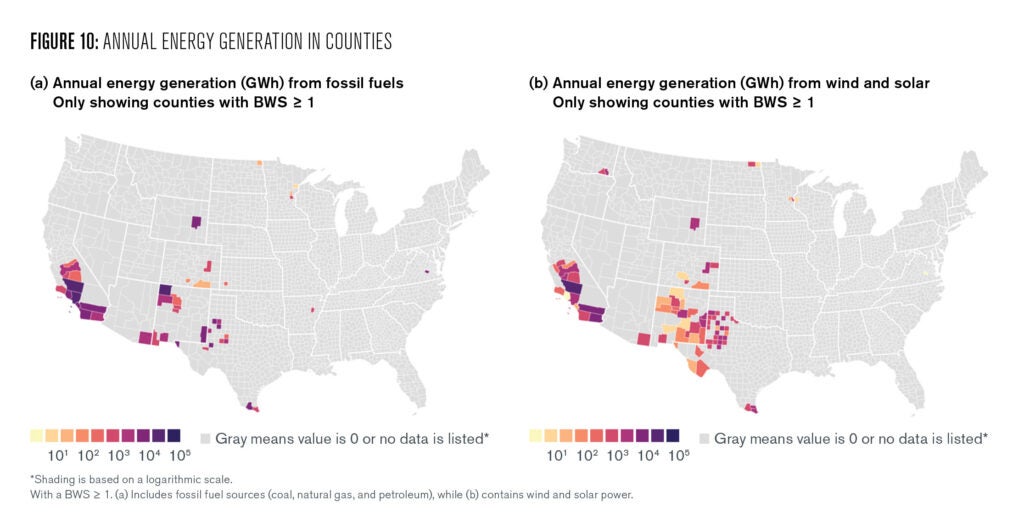
Finally, we begin to make some policy relevant observations about water use and legacy power plant assets. For instance, San Juan County in the northeast corner of New Mexico has BWS ≥ 1 and has significant fossil fuel generation capacity. It does not, however, have any significant utility scale solar or wind generation—sources that are much more water efficient than fossil fuels assets.
This indicates that the retirement of fossil fuel power plants in San Juan County and the development of renewable generation to meet existing demand would not only help to reduce regional emissions but could also significantly reduce regional water stress. On the other hand, counties in the southeast of Washington State already experience high water stress despite having no significant fossil fuel generation. This suggests that even the further deployment of water-efficient renewable generation like wind and solar should be undertaken with caution since they represent additional power sector water demands in an already stressed region.
Findings and Policy Discussion
Figures 9 and 10 do not provide a perfect roadmap for the prioritization of fossil fuel asset retirements, but they do offer some indication of regions where power sector water use ought to be strongly considered as an important pathway to sustainability. Prioritizing the retirement of thermoelectric assets in the counties highlighted in Figure 10a could help to significantly reduce regional water stress.
Although water withdrawals are a significant metric of power sector resource consumption more broadly, Figures 9 and 10 highlight those counties where the significance of power sector water demand is most pronounced. Taking a step back and looking more generally at the distribution of water stress in Figure 1, it is worth noting that regions of the Southwest and Great Plains—where solar and wind power are at their most productive—are also regions of increased relative water stress (EIA 2019). As demand for carbon-free electricity generation increases, it is important that local water stress becomes a criterion for the siting of new solar and wind.
Although the per MWh water efficiency of solar and wind power is extremely high relative to thermoelectric power generation, Figure 10 shows that not all high water stress counties support existing thermoelectric water demands. A solar array, for example, located in an arid region that did not previously support significant generation assets could pose a significant increase in local water stress and have long-term implications for groundwater resources, regional agriculture, water treatment, and industry.
A careful consideration of the long-term sustainability of future energy investments is even more critical when considering future deployment of nuclear, biomass, biogas, hydroelectric, geothermal, and solar thermal power plants—carbon-free energy sources that still have water demands comparable or exceeding the on-site water demands of fossil fuel generation. In particular, continued deployment of solar thermal capacity in arid countries of the Southwest is of particular concern because of its relatively high water demand compared to other clean energy sources.
In the same way that sources of energy generation are now frequently compared using a “social cost of carbon” defined by the global externalities of an additional ton of carbon emissions, perhaps energy asset comparisons should also incorporate a locally relevant social cost of water use.
The findings of this initial analysis indicate that for at least several dozen counties around the country, prioritization of legacy asset retirement could significantly lessen local water stress and improve overall sustainability within that region. We also demonstrate that although carbon-free energy is less water intensive than legacy fossil fuel assets, some generation types—especially nuclear, geothermal, hydroelectric, and solar thermal power—have significant water withdrawal and consumption demands and should be carefully deployed with regard for existing and projected levels of local water stress.
Finally, the analysis further emphasizes the environmental benefits of widespread photovoltaic and wind turbine generation asset deployment. Not only are these energy systems carbon-neutral (at the point of generation) but they also require exceptionally little water as compared to other power generation alternatives.
As long as we avoid exceptionally water-stressed regions that are already hosting utility-scale generation assets, new wind and solar installation would not present a significant local environmental risk in regard to water demand. In many locations, wind and solar development can help reduce water stress by displacing existing water-intensive generation assets.
Conclusion
No energy source can be harnessed without putting some strain on natural resources. That said, when it comes to the on-site water demands of various generation sources, renewable wind and photovoltaic power are by far the most sustainable of any available generation technology.
The United States encompasses large regions of relatively high water stress, and therefore stands to benefit from the clean energy transition—not just because of the climate benefits of decarbonization but also because of decreased power sector water demands. By using water demand and local water resource availability to help prioritize legacy asset retirement and new generation deployment, the U.S. can ensure that the transition to clean energy maximizes domestic sustainability in addition to meeting global emission limitations.
This report only attempts to compare the relative regional and source-specific water demands of the power sector. Perhaps the most urgent and achievable goal of the clean energy transition is the decarbonization and expansion of the nation’s electricity sector. Developing new metrics to use in guiding the phase-out of fossil fuel generation and phase-in of renewable generation is essential to ensuring a responsible transition.
However, future research could and should build on this analysis to construct a more complete picture of the entire energy sector’s impact on domestic water resources. Such an analysis would incorporate water use data on resource mining and refining, as well as manufacturing and transportation of energy infrastructure and fuels.
Whereas solar and wind power use very little water on sight, they do require water during the manufacturing and materials mining processes. Furthermore, solar and wind power depend on lithium and cobalt dense batteries for load balancing, further increasing the imbedded off-site water demands of solar and wind power generations (Serpell et al. 2021).
This analysis also does not explore in great detail the scalability of inter-county or inter-basin water exchange. One approach to reducing water stress is to lower local demand; the other is to import water resources to meet demand. Whereas existing water exchanges are captured in the WRI water stress data (adding to the water consumption of the providing county), the possibility for increased future exchanges is not clear.
In almost all scenarios it will be significantly easier and less expensive to increase the transportation of electricity between counties than it would be to increase the cross-county transportation of water. That is to say that local water availability and transportation infrastructure ought to inform energy investments, not the other way around.
Oscar Serpell
Deputy DirectorOscar Serpell oversees all student programming, alumni engagement, faculty and student grants, and visiting scholars. He is also a researcher, writer, and policy analyst working on research initiatives with students and Center partners.
Wan-Yi “Amy” Chu
Assistant Professor, Mills College, Oakland, CaliforniaWan-Yi “Amy” Chu is an assistant professor at Mills College in Oakland, California and a former postdoctoral researcher in the Goldberg Group, located in the Department of Chemistry at the University of Pennsylvania.
Benjamin Paren
Alumni Research FellowBenjamin Paren is an alumni research fellow at the Kleinman Center and a postdoctoral research associate in the Research Laboratory of Electronics at the Massachusetts Institute of Technology.
Center for Climate and Energy Solutions. 2020. “Drought and Climate Change.” Accessed 27 Jul 2021: https://www.c2es.org/content/drought-and-climate-change/
Datawrapper. n.d. “Build Your Own Chart.” Accessed 28 Jul 2021: https://app.datawrapper.de/select/map
Department of Energy (DOE). 2014. “The Water-Energy Nexus: Challenges and Opportunities.” Accessed 28 Jul 2021: https://www.energy.gov/articles/water-energy-nexus-challenges-and-opportunities
Di Baldassarre, G., Mazzoleni, M. & Rusca, M. 2021 “The Legacy of Large Dams in the United States.” Ambio. Accessed 28 Jul 2021: https://link.springer.com/article/10.1007/s13280-021-01533-x#citeas
D’Odorico P, Bhattachan A, Davis KF, et al. 2013. “Global Desertification: Drivers and Feedbacks.” Advances in Water Resources 51:326–344. Accessed 28 Jul 2021: https://www.sciencedirect.com/science/article/pii/S0309170812000231
Duke Energy. 2008. “Water and Energy – Withdrawal vs. Consumption.” Accessed 28 Jul 2021 : https://sustainabilityreport.duke-energy.com/2008/water/withdrawal.asp
Grubert E, Sanders KT. 2018. “Water Use in the United States Energy System: A National assessment and UNIT Process inventory of water consumption and withdrawals.” Environmental Science & Technology 52:6695–6703. Accessed 28 Jul 2021: https://pubs.acs.org/doi/pdf/10.1021/acs.est.8b00139
Harto C, Schroeder J, Martino L et al. 2013. “Geothermal Energy: The Energy-Water Nexus” Proceedings, 38th Workshop on Geothermal Reservoir Engineering at Stanford University. Accessed 28 Jul 2021: https://pangea.stanford.edu/ERE/pdf/IGAstandard/SGW/2013/Harto.pdf
Hofste R, Kuzma S, Walker S, et al. 2019. “Aqueduct 3.0: Updated Decision-Relevant Global Water Risk Indicators.” World Resources Institute. Accessed 28 Jul 2021: https://www.wri.org/research/aqueduct-30-updated-decision-relevant-global-water-risk-indicators
Hughes, MA. 2020. “Energy Transitions Are Brown Before They Go Green.” The Kleinman Center for Energy Policy. Accessed 28 Jul 2021: https://kleinmanenergy.upenn.edu/wp-content/uploads/2020/03/KCEP-Energy-Transitions-Brown-Before-Green-D24.pdf
Jin Y, Behrens P, Tukker A, Scherer L. 2019. “Water Use of Electricity Technologies: A Global Meta-analysis.” Renewable and Sustainable Energy Reviews 115:109391. Accessed 28 Jul 2021: https://www.sciencedirect.com/science/article/pii/S1364032119305994
Macknick J, Newmark R, Heath G, Hallett KC. 2012. “Operational Water Consumption and Withdrawal Factors for Electricity Generating Technologies: A Review of Existing Literature.” Environmental Research Letters 7. Accessed 28 Jul 2021: https://iopscience.iop.org/article/10.1088/1748-9326/7/4/045802/pdf
NOAA’s National Weather Service. n.d. “Precipitation Frequency Data Server.” Accessed 28 Jul 2021: https://hdsc.nws.noaa.gov/hdsc/pfds/
Reimers, A. 2018. Making Electricity Consumes a Lot of Water – What’s the Best Way to Fix That?” Scientific American. Accessed 28 Jul 2021: https://blogs.scientificamerican.com/plugged-in/making-electricity-consumes-a-lot-of-water-whats-the-best-way-to-fix-that/
Serpell O, Chu A, Paren B. 2021. “Rare Earth Elements: A Resource Constraint of the Energy Transition” The Kleinman Center for Energy Policy. Accessed 28 Jul 2021: https://kleinmanenergy.upenn.edu/research/publications/rare-earth-elements-a-resource-constraint-of-the-energy-transition/
U.S. Energy Information Administration (EIA). 2019. “Southwestern States Have Better Solar Resources and Higher Solar PV Capacity Factors” Accessed 28 Jul 2021: https://www.eia.gov/todayinenergy/detail.php?id=39832
— n.d. “Frequently asked Questions (FAQs): How Much Carbon Dioxide is Produced When Different Fuels are Burned?” Accessed 28 Jul 2021: https://www.eia.gov/tools/faqs/faq.php?id=73&t=11
— n.d. “Electric Power Monthly Table 6.07.A. and Table 6.07.B.” Accessed 28 Jul 2021: https://www.eia.gov/electricity/monthly/epm_table_grapher.php?t=epmt_6_07_b & https://www.eia.gov/electricity/monthly/epm_table_grapher.php?t=epmt_6_07_a
United States Government Survey (USGS). n.d. “Water Q&A: How Much Water Do I Use at Home Each Day?” Accessed 28 Jul 2021: https://www.usgs.gov/special-topic/water-science-school/science/water-qa-how-much-water-do-i-use-home-each-day?qt-science_center_objects=0#qt-science_center_objects
Wada Y, de Graaf IE, van Beek LP. 2016 “High-Resolution Modeling of Human and Climate Impacts on Global Water Resources.” Journal of Advances in Modeling Earth Systems 8:735–763. Accessed 28 Jul 2021: https://agupubs.onlinelibrary.wiley.com/doi/full/10.1002/2015MS000618
Wartsila. n.d. “Combustion Engine vs Gas Turbine: Water Consumption” Wartsila. Accessed 28 Jul 2021: https://www.wartsila.com/energy/learn-more/technical-comparisons/combustion-engine-vs-gas-turbine-water-consumption
World Economic Forum. 2009. “Energy Vision Update 2009: Thirsty Energy: Water and Energy in the 21st Century.” Accessed 28 Jul 2021: http://d3n8a8pro7vhmx.cloudfront.net/foe/legacy_url/1868/Water-energy-2009CERA.pdf?1471405077
World Resources Institute (WRI). 2019. “WRI Aqueduct Water Risk Atlas.” Accessed 28 Jul 2021: https://bit.ly/3zKM6XL


