How Effective Are Vehicle Exhaust Standards?

We've made great progress in reducing vehicle emissions in the United States, but new-car standards don't address the dirtiest polluters: old cars. Fiscal policies targeting used vehicles could help.
At a Glance
Key Challenge
Most federal U.S. policies focus on cleaning up new vehicles but leave the oldest, dirtiest vehicles unregulated.
Policy Insight
A promising way to disincentivize driving an old car is through a system of annual registration fees or property taxes on vehicles that vary with the vehicle’s age.
Introduction
Local air pollution emissions from vehicles account for 40% of total U.S. emissions and are associated with more than 37,000 deaths in the U.S. (rivaling annual traffic fatalities) and more than 250,000 deaths globally each year.1 Even those dire health consequences represent a large improvement: over the past fifty years, emissions of hydrocarbons (HC), nitrogen oxides (NOx), and carbon monoxide (CO) from vehicles have seen an impressive larger-than-99% reduction. Perhaps the largest decrease in emissions by any other major sector or country.
Looking at the current vehicle fleet, used vehicles older than 10 years cause a majority of exhaust emissions and vehicles older than 15 years produce between one-fourth and one-half of emissions— despite these older cars being a relatively small part of the vehicle fleet. This is not just because newer models are cleaner; even more importantly, cars get much dirtier as they age and their pollution-control equipment starts to degrade.
The regulatory landscape that addresses local air pollution from vehicles is complex. An increasingly stringent set of exhaust standards that impose limits on HC, NOx, and CO form the most important policy in the U.S. Despite the prominent role of these standards, there is hardly any research in environmental economics that studies their effectiveness. In a recent research paper, we therefore ask if exhaust standards have caused the observed reductions in pollution and, if so, if the same environmental savings could have been achieved in a more cost-effective way (Jacobsen et al. 2022).
Exhaust standards regulate both new-vehicle emissions and, until the year 2017, address deterioration over a vehicle’s first 50,000 miles. Importantly, they fail to target the substantial pollution from older vehicles. This raises an important question: should we complement exhaust standards with other policies that could prove more effective at reducing transport emissions, especially by encouraging the early retirement of the oldest, dirtiest cars?
Data and Regulations
To assess the efficacy of exhaust regulations, we use the most comprehensive and high-quality data on new and used vehicle pollution emissions ever constructed. These data span over half a century starting in 1957 and provide identical measurement methods for exhaust emissions of new vehicles.
We add to this more than 65 million vehicle test records, including used-vehicle inspections and roadside remote sensing measurement for individual cars. The latter test is impervious to any devices manufacturers might use to cheat on tests performed under controlled conditions (as happened in the Dieselgate scandal), and serves as an important validity check for the results we obtain using the other data sets.
The unprecedented breadth and detail of the data we have assembled allow us to study several important questions:
- How have vehicle emissions changed over time?
- Have exhaust standards caused the remarkable decreases in emissions rates?
- Have these standards reduced emissions at the lowest possible cost?
- Which counterfactual policies could policy makers add to the mix to make vehicle-pollution regulation more cost effective?
Exhaust standard regulation began in 1968 and has since become increasingly strict—with the latest set of standards imposed for vehicles with model years 2017–2025. Despite the regulatory complexity, one could summarize standards by four policy categories in chronological order: Tier 0 (1968-1993), Tier 1 (1994-2003), Tier 2 (2004-2016) and Tier 3 (2017-current).
It is important to distinguish exhaust standards that address local air pollution from Corporate Average Fuel Economy Standards that regulate the average fuel economy (and thus address climate change) of the new vehicle fleet. We focus on local air pollution only.
Historically, these standards became “technologically forcing,” as they effectively pushed every vehicle to have a catalytic converter—a device that uses precious metals to neutralize the emissions of local pollutants. Over time, as standards got tighter, catalytic converters became more effective at eliminating pollution.
The basic approach has changed little since the 1970s: thin layers of precious metals inside the catalytic converter convert pollution into harmless gases. The precious metal palladium abates CO and HC, rhodium abates NOx, and platinum abates all three. These reactions can eliminate essentially all pollution, but only under high temperatures and the right mix of air and fuel in the engine. Over time, catalytic converters and combustion techniques have improved substantially, allowing for increasingly large reductions in pollution.
Up to the year 2000, standards were written as “maximum standards” for two vehicle classes: cars and light-duty trucks. The standards required every vehicle in each class to emit less than the standard. Since 2000, regulations began imposing fleet-wide averages for emissions of a specific pollutant, in addition to tightening the maximum standards for all pollutants.2
To determine compliance with exhaust standards, the U.S. Environmental Protection Agency (EPA) uses the Federal Test Protocol (FTP), calculates “deterioration factors” for a group of similar vehicle models with the same engine family, and performs random tests for “in-use” compliance for a small subset of vehicles that have reached the 50,000-mile mark.
The FTP is designed to simulate an average urban commute in a brand-new vehicle under lab conditions (U.S. EPA 1993). The “deterioration factor” helps estimate how emissions will change as a vehicle gets older, but until recently, this has only been done for vehicles up to five years old or 50,000 miles, whichever comes first. The standards then regulate the product of the FTP result and this deterioration factor.
Today’s Cars Are Cleaner
The rich vehicle-emissions data we constructed show a very clear pattern: over the past fifty years, cars have become much cleaner. Emissions from local pollutants have decreased rapidly and we estimate—using various econometric techniques—that the majority of this decrease was caused by the implementation of exhaust standards. Other policies, including fuel-economy standards, likely played a negligible role.
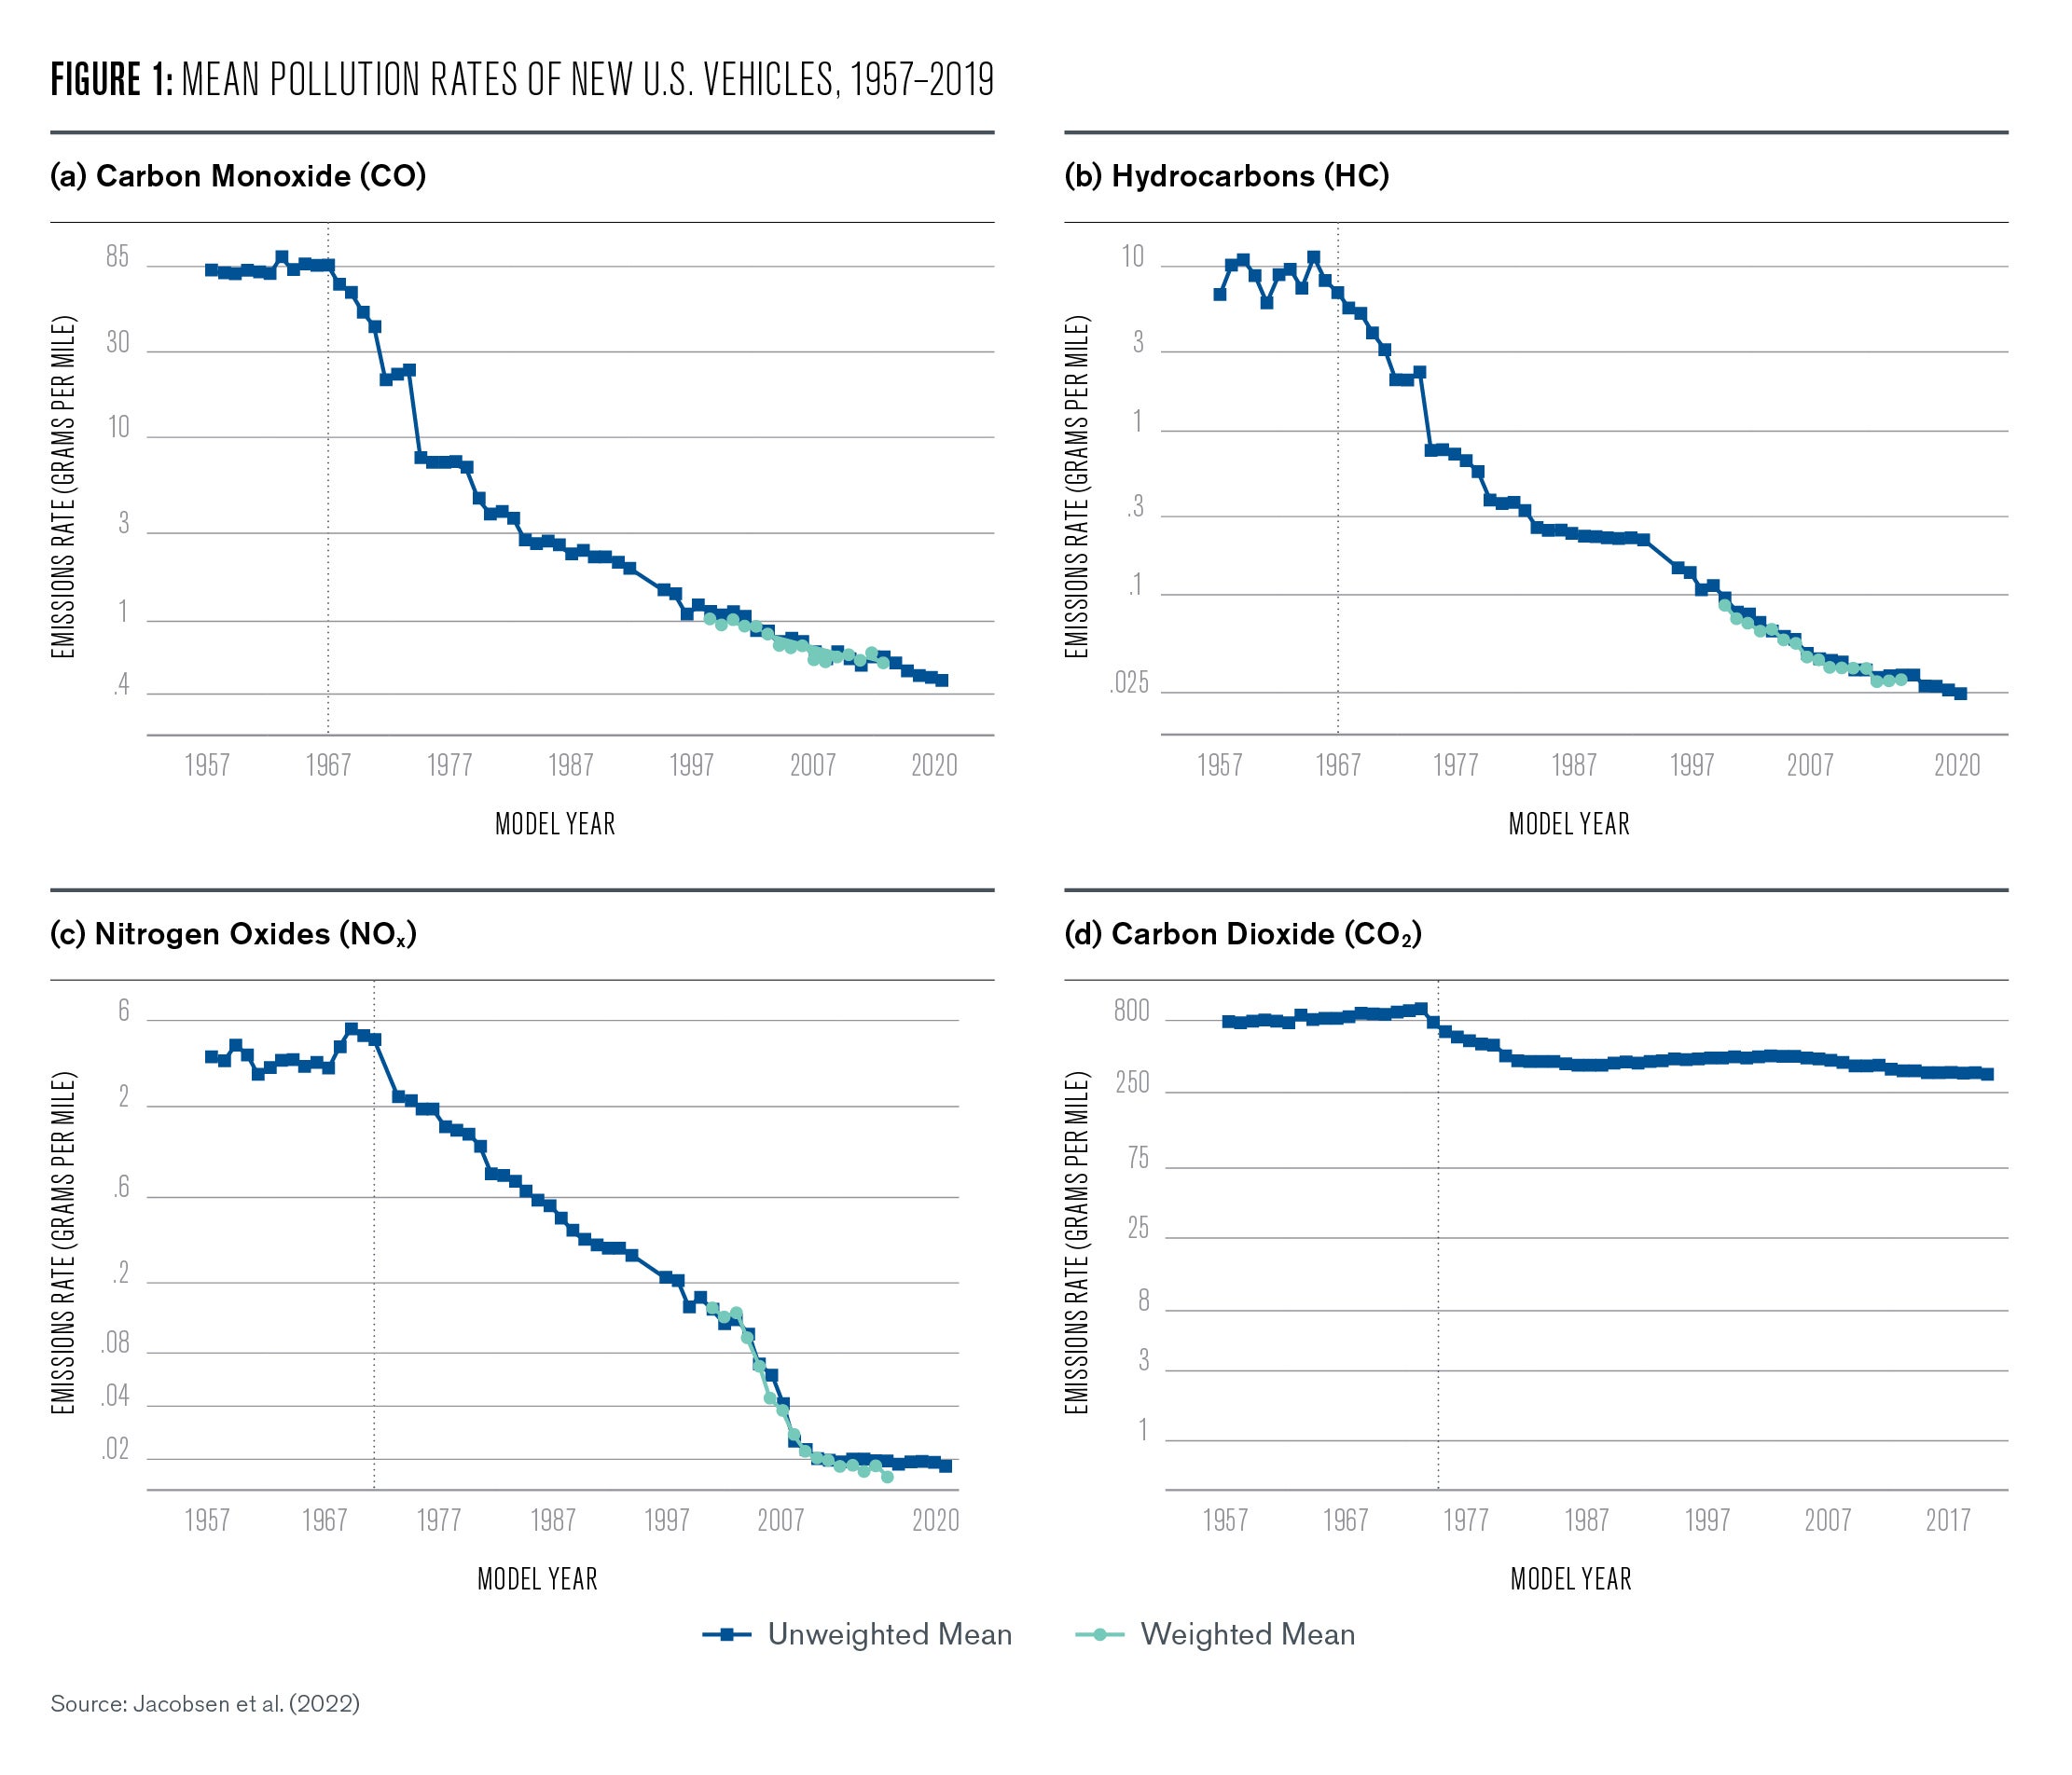
Figure 1 plots the average emissions per mile of all light-duty vehicles (including passenger cars, SUVs, minivans, and pickup trucks) in the U.S. from model years between 1957 and 2020. Each panel shows how different exhaust emissions and carbon dioxide (CO2) rates have changed over time. Panels A, B, and C show that CO, HC, and NOx emissions rates have fallen, respectively, by 99.5%, 99.7%, and 99.6%.
Before regulations began in 1968, no such trends were visible, so there was little progress in the absence of regulation. In comparison, between 1990 and 2018, ambient pollution levels of CO, NO2, and ozone decreased by 20% and 75% (U.S. EPA 2018), which suggests that new vehicles faced a much faster decrease in emissions rates than other sources of pollution did.
To study if this spectacular reduction in pollution can be attributable to standards, we look at several pieces of evidence. The first uses the implementation of the first generation of exhaust standards. Using data for vehicle model years 1957–1971, we estimate that the implementation of Tier 0 standards in 1968 substantially decreased emissions from CO and HC. But NOx and CO2, which were not regulated until 1972, did not decrease at all.
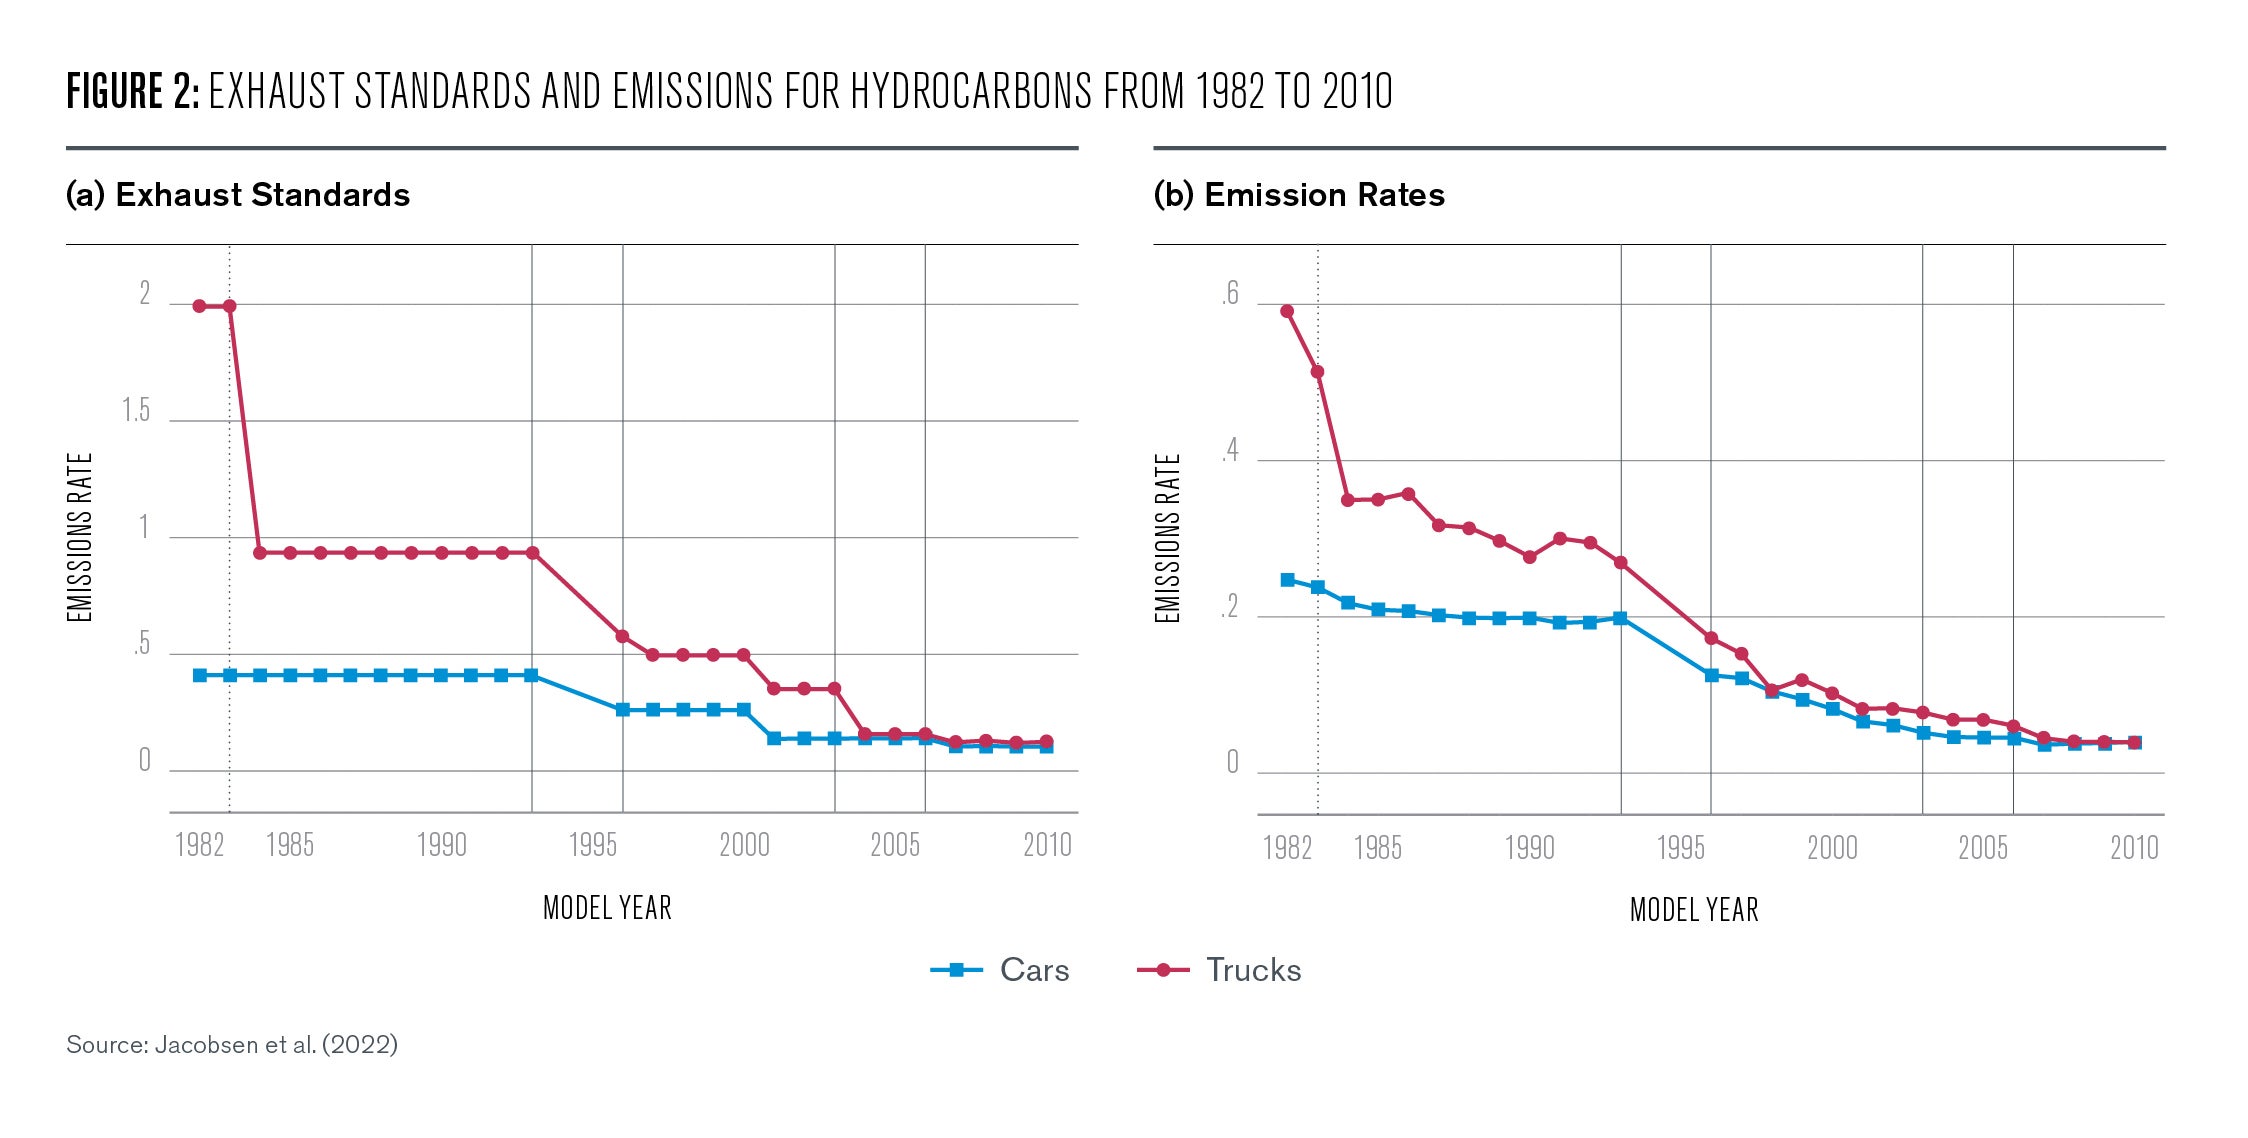
We also study later regulatory tiers in which standards for light-duty trucks change in different ways from the standards for cars. Figure 2 provides an example of such type of variation in exhaust standards. Panel A shows exhaust standards over the years 1982–2010. The red line depicts standards for light-duty trucks, while the blue line depicts standards for passenger cars. The vertical lines show years when standards changed.
Panel B shows the actual emissions rates for these vehicles, measured by new-vehicle tests. We find similar patterns for used-vehicle emissions, so improvements in new-vehicle technology persist as vehicles age. The qualitative patterns in emissions documented in Panel B mirror the standards from Panel A closely, suggesting a causal role for standards. Figure 2 also shows that emissions rates are on average only a third of standards. This over-compliance provides automakers with a form of insurance against costly recalls if they violate standards when re-tested once the odometer reaches 50,000 miles.3
As another piece of evidence, we estimate that new-vehicle emissions rates strongly predict the emissions rates of the same vehicle when it becomes much older. This is reassuring: restrictions imposed by exhaust standards not only decrease new vehicle rates, but also reduce pollution when these cars are older. Exhaust standards thus do not reduce emissions when the cars are fresh off the production line; but vehicles consistently emit less as they age.
Cars Get Dirtier as They Age
Because emission control systems deteriorate with a vehicle’s age, it is not surprising that a large portion of exhaust emissions can be attributed to older vehicles, which are not directly regulated by exhaust standards. More than two-thirds of air pollution in a given year comes from vehicles older than 10 years, and between one-fourth and one-half of pollution emissions come from vehicles older than 15 years. Interestingly, in contrast, gas mileage does not deteriorate at all with vehicle age.
Figure 3 plots emissions per mile for local pollutants and carbon dioxide emissions by vehicle age for all vintages from 1982 to 2009. While CO2 emissions remain stable throughout the lifetime of a vehicle, there is a clear upward trend for HC, NOx, and CO. Older vehicles produce much higher emissions of local pollutants: the scale of the vertical axis implies that a vehicle that is 25 years old emits about five times as many hydrocarbons compared to its emissions rate when it is four years old.
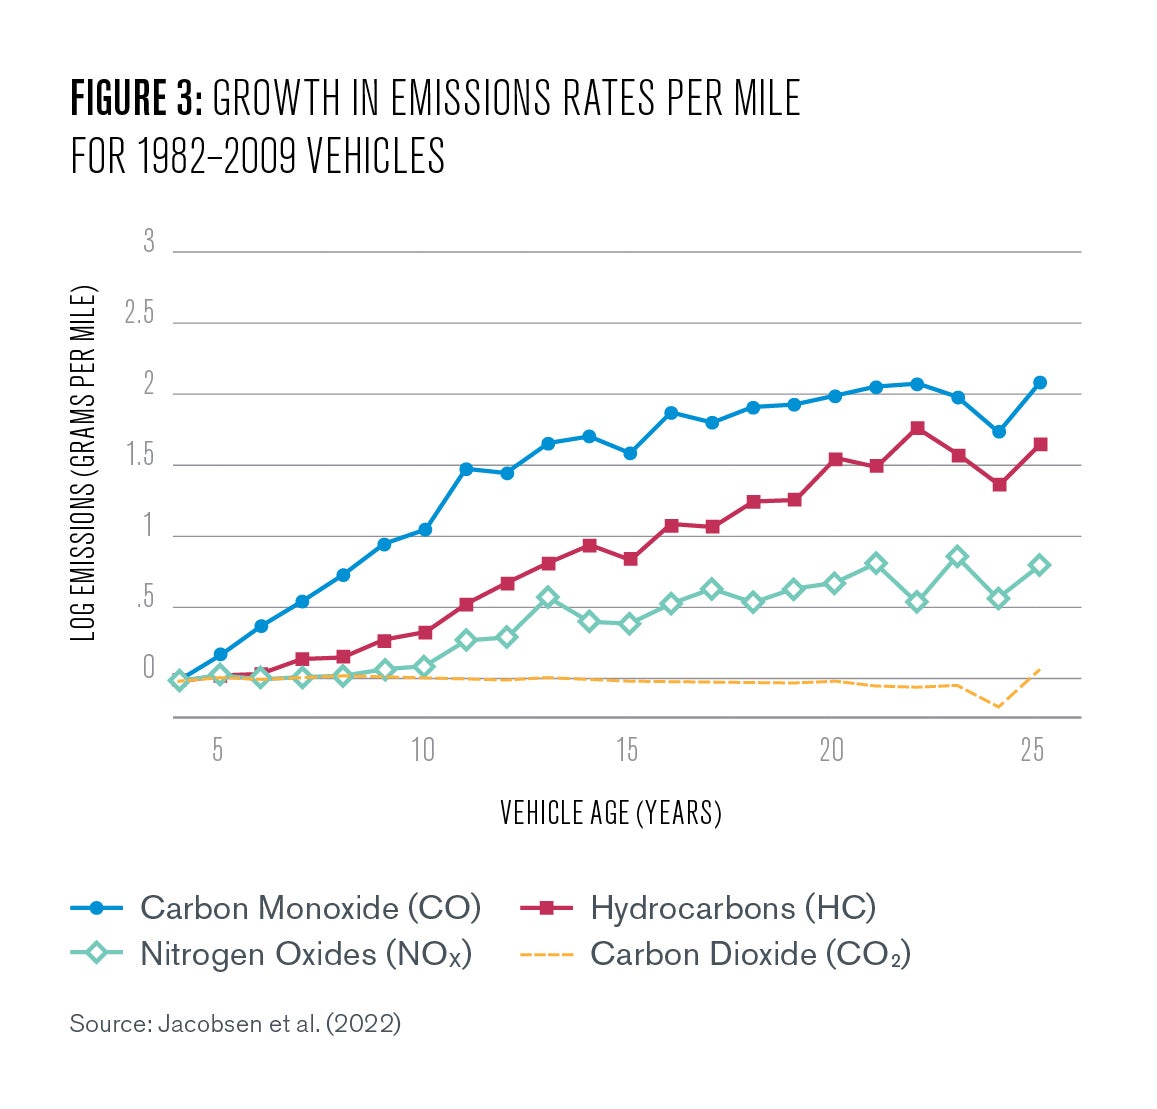
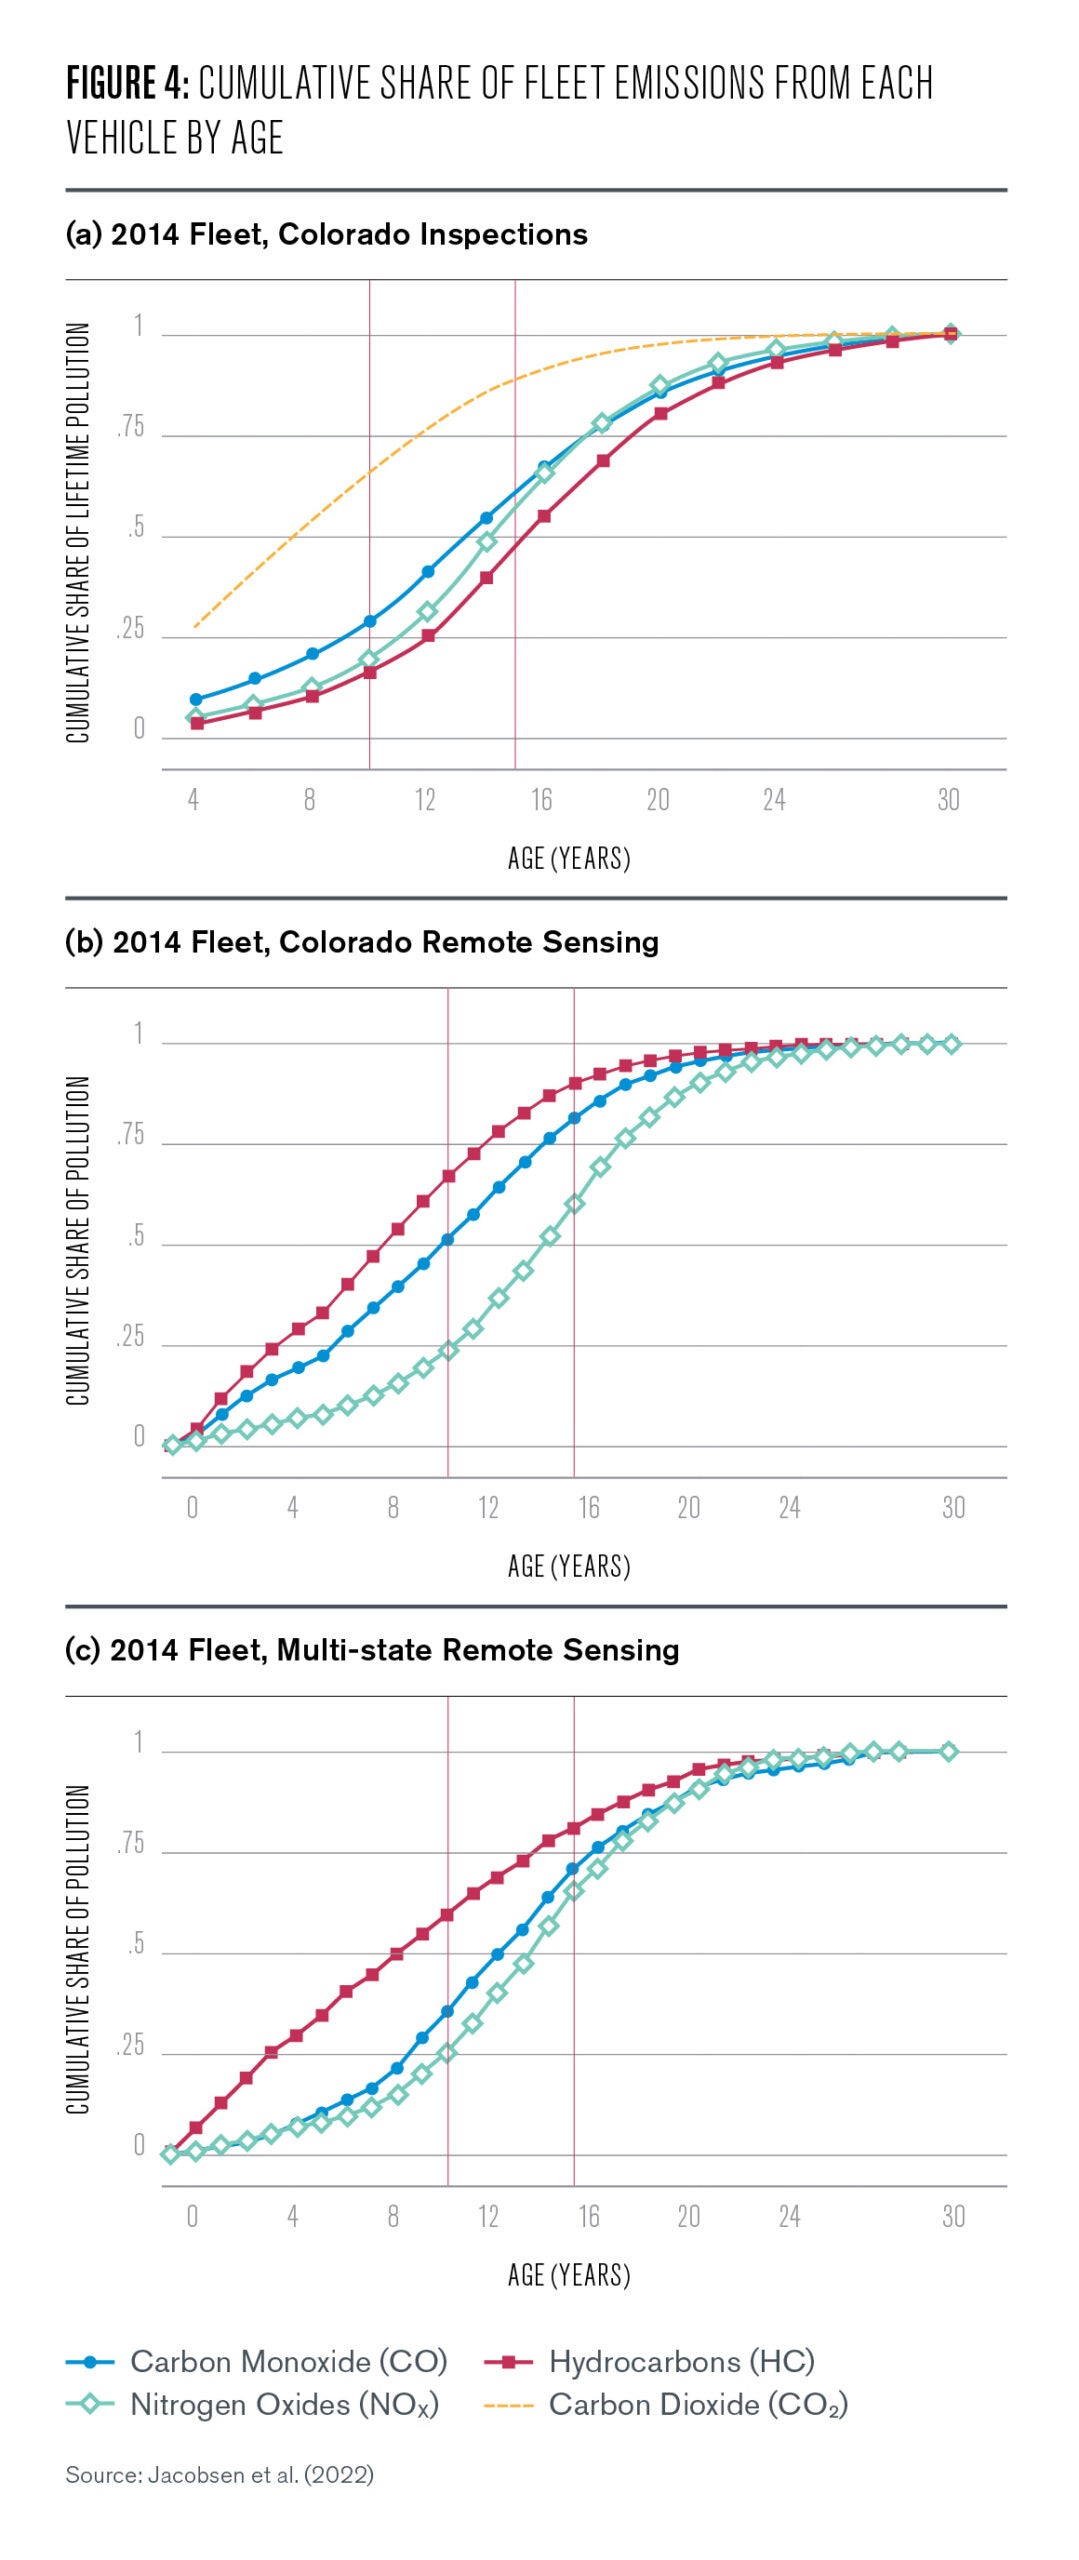
Figure 4 details how older vehicles contribute the vast majority of air pollution. The figure shows the cumulative share of fleet emissions: the vertical axis indicates the percentage of total pollution from vehicles of a given age or younger. Panels A, B, and C plot cumulative emissions for the 2014 vehicle fleet from three separate inspection sources. In Panel A, 70%–80% of local pollution emissions come from vehicles older than 10 years, while only 30% of CO2 emissions come from vehicles older than 10 years.
Certain parts of the latest exhaust standards, Tier 3, apply until a vehicle is 15 years old, but even at that age, we can see from Panels A, B, and C of Figure 4 that a third to a half of the emissions from vehicles on the road in the year 2014 come from vehicles older than 15 years.
One of the reasons for these trends is that the existing regulation does not provide adequate incentives to solve the problem of emissions from old vehicles. Over time, manufacturers have been forced to produce new vehicles that comply with increasingly stringent standards. Yet, manufacturers are not incentivized to target pollution from vehicles that are older than 10 or 15 years.
At the same time, exhaust standards have an unintended consequence. They make new vehicles more expensive, so consumers increase their demand for older, dirtier vehicles as an alternative. This, in turn, inflates resale values for the oldest cars, so they will be scrapped at lower rates—a phenomenon estimated in the economics literature (Jacobsen and van Benthem 2015). This highlights the need for an alternative policy that taxes vehicles based on their true emissions connected with their age and vintage.
Alternative Policies
Emission standards have been highly effective at reducing new-vehicle pollution. At the same time, the steep age deterioration suggests that the same reductions could have been achieved at lower costs had regulation been more directly targeted at older cars. To study alternative policies that complement exhaust standards, we developed analytical and quantitative models of the U.S. new and used vehicle fleets to quantify the benefits from various policies.4 We focus on simulating policies over the period 2000–2020, to analyze how outcomes could have been different.
Annual Pollution Tax
We find that an annual tax that charges each vehicle the average annual pollution damage for its age, class, and manufacturer leads to large societal gains. Such taxes that truly reflect the environmental and health damages from pollution are extremely high for the vehicle fleet in the year 2000—starting at a few hundred dollars per year for the youngest cars and increasing to $2,000–$3,000 annually for vehicles older than 20 years (even taking into account that older vehicles are driven less).
This leads to widespread scrappage of old vehicles—essentially, these taxes remove vehicles 25 years and older from the road and the policy bears resemblance to a scrappage mandate after 25 years. As a result, overall air pollution damages would decrease by approximately one third.
A clear issue with such high taxes is that, while they adhere to the “polluter pays principle,”5 they will likely face an uphill climb in politics due to politicians’ adversity to new taxes and because of their distributional consequences—the dirtiest cars are disproportionately driven by the poorest households.
Annual Registration Fees
More incremental and possibly more politically feasible policies can still yield large societal gains. Currently, many U.S. states charge vehicle owners annual vehicle property taxes or registration fees that decrease with the resale value of the car. In other words, driving old, cheap cars is cheaper than driving cleaner new vehicles. This subsidizes cheap (and thus old and dirty) cars.
We simulate the consequences of correcting this perverse policy in such a way that annual registration fees would be the same for each vehicle age. This entails reducing registration fees for new cars by $50, while increasing the annual registration fee for the oldest vehicles by between $30. This tax on old cars is much below the true cost of pollution and does not target the oldest, dirtiest vehicles very efficiently, but is somewhat less regressive than the full externality-based tax.
We find that such a more modest intervention could achieve between a quarter and a third of the societal benefits that the full-damage tax would achieve, in exchange for a less inequitable impact on vehicle owners. These relatively large benefits stem from the existence of a large group of highly polluting vehicles that offer limited value to their current owners, and even a small fee would convince them to scrap. That being said, questions about fairness still arise as annual registration fees for old cars would increase substantially. Scrappage subsidies could mitigate this concern, but are fiscally expensive.
Conclusion
The history of local vehicle emissions in the United States is largely a success story: new cars are dramatically cleaner than half a century ago and environmental policy has been responsible for at least half and perhaps close to all of these pollution reductions. At the same time, exhaust standards—the flagship policy to reduce vehicle tailpipe emissions—do not target the dirtiest, oldest vehicles and therefore cannot be a cost-effective solution to pollution reduction.
Our research program investigates if we can do better by adding age-based registration fees and other policies that target fleet turnover. Such policies are worthwhile studying, since they already exist and their implementation would be fairly straightforward and not easily subject to manipulation. As our research agenda unfolds, we plan to investigate how these policies affect vehicle owners across the income distribution, project the performance of future policies, and model the costs and benefits from further tightening of the exhaust standards.

Arthur van Benthem
Associate Professor of Business Economics and Public PolicyArthur van Benthem is an expert in environmental and energy economics, exploring the economic efficiency of energy policy. He is a faculty fellow at the Kleinman Center and an associate professor of Business Economics and Public Policy at Wharton.

Mark Jacobsen
Professor, University of California San DiegoMark Jacobsen is a professor of economics at the University of California, San Diego and a research associate at the National Bureau of Economic Research. In 2015-2016, he was a visiting scholar at the Kleinman Center.

James Sallee
Associate Professor, University of California BerkeleyJames Sallee is an associate professor in the Department of Agricultural and Resource Economics at the University of California Berkeley and a research associate of the National Bureau of Economic Research.

Joseph Shapiro
Associate Professor, University of California BerkeleyJoseph Shapiro is an associate professor in the Department of Agricultural and Resource Economics at the University of California Berkeley and a Research Associate at the National Bureau of Economic Research.
Chambliss, S.E., R. Silva, J.J. West, M. Zeinali, and R. Minjares. 2014. “Estimating Source-Attributable Health Impacts of Ambient Fine Particulate Matter Exposure: Global Premature Mortality from Surface Transportation Emissions in 2005.” Environmental Research Letters 9.
Fann, N., C.M. Fulcher, and K. Baker. 2013. “The Recent and Future Health Burden of Air Pollution Apportioned Across U.S. Sectors.” Environmental Science & Technology 47(8), 3580-3589.
Goulder, L.H., M.R. Jacobsen, and A.A. van Benthem. 2012. “Unintended Consequences from Nested State and Federal Regulations: The Case of the Pavley Greenhouse-Gas-per-Mile Limits.” Journal of Environmental Economics and Management 63(2): 187-207.
Jacobsen, M.R. and A.A. van Benthem. 2015. “Vehicle Scrappage and Gasoline Policy.” American Economic Review 105(3), 1312-1338.
Jacobsen, M.R., J.M. Sallee, J.S. Shapiro, and A.A. van Benthem. 2022. “Regulating Untaxable Externalities: Are Vehicle Air Pollution Standards Effective and Efficient?” Working paper.
U.S. EPA. 1993. Federal Test Procedure Review Project: Preliminary Technical Report. Technical report. https://nepis.epa.gov/Exe/ZyPURL.cgi?Dockey=00000G9Q.TXT
U.S. EPA. 2014. “National Emissions Inventory 2014.” Visited 1/30/2017. https://www.epa.gov/air-emissions-inventories/2014-national-emission-inventory-nei-report
U.S. EPA. 2018. Our Nation’s Air: Status and Trends Through 2018. Technical report. https://nepis.epa.gov/Exe/ZyPURL.cgi?Dockey=00000G9Q.TXT
World Bank. 2014. Transport for Health: The Global Burden of Disease from Motor Road Transport. Technical report. https://openknowledge.worldbank.org/bitstream/handle/10986/17613/863040IHME0T4H0ORLD0BANK0compressed.pdf;sequence=1
- For U.S. damages, see Fann et al. (2013) and U.S. EPA (2014); for global damages, see Chambliss et al. (2014) and World Bank (2014) [↩]
- Fleet averaging allows manufacturers to over-comply with some models and under-comply with others, as long as the sales-weighted average pollution level meets the standard. [↩]
- Industry engineers and regulators we interviewed describe over-compliance as typical, even as they expected abatement technology to outperform the standards substantially. [↩]
- The quantitative model we use builds on existing frameworks from Goulder et al. (2012) and Jacobsen and van Benthem (2015), but adds local pollution levels, taxes, and standards. [↩]
- The “polluter pays principle” refers to the concept of an environmental tax equal to a vehicle’s externality, a common concept in economics that represents the damages to society at large that are not paid directly by the producer and the consumer of a product (in this context, a vehicle). [↩]
