The percentage of U.S. homes heated with electricity has increased steadily from 1% in 1950 to 40% in 2020. New research explores the implications of this increase for a growing number of policies aimed at electrifying buildings.
At a Glance
Key Challenge
Policymakers are increasingly turning to building electrification in an effort to reduce externalities.
Policy Insight
The economic case for electrification is strongest in places where electric generation is relatively green.
U.S. households burn vast amounts of fossil fuels on site for space heating: 2.7 trillion cubic feet of natural gas, 2.9 billion gallons of heating oil, and 2.5 billion gallons of propane annually. This is the carbon equivalent of having 40 million cars on the road.
Policymakers are increasingly turning to electrification in an effort to reduce these externalities. The “electrify everything” movement gained attention in January 2020, when Berkeley CA, became the first city in the United States to ban natural gas on new residential construction. More than 50 cities in California, Washington, New York, Massachusetts, and Rhode Island have now enacted measures limiting or prohibiting natural gas in new homes.
Proponents argue that electrifying buildings is critical if the U.S. is to sharply reduce carbon emissions from the building sector. The U.S. electricity sector has become much less carbon-intensive, making this a more viable path to decarbonization than even just a few years ago. Critics argue that electric heat costs more per unit of heating, so electrification mandates are expensive.
Mostly missing from this discussion, is that home electrification is nothing new. In new research, I document the growth in residential electric heating over the last seven decades and ask two questions:
- What explains this increase?
- What is the economic cost of an electrification mandate?
This research is directly relevant to a growing number of policies aimed at building electrification. Several recent interdisciplinary studies consider pathways to decarbonize the U.S. economy by mid-century. Rapid electrification of residential heating plays a prominent role in virtually all considered pathways, so understanding the cost of such a transition is of critical policy importance.
Rapid Growth in Electric Heating
Back in 1950, only 1% of U.S. homes used electricity as their primary heating fuel. By 1970, this had increased to 8%, with electric heating becoming more common in southern states like Tennessee and Florida, as well as in western states like Washington and Nevada.
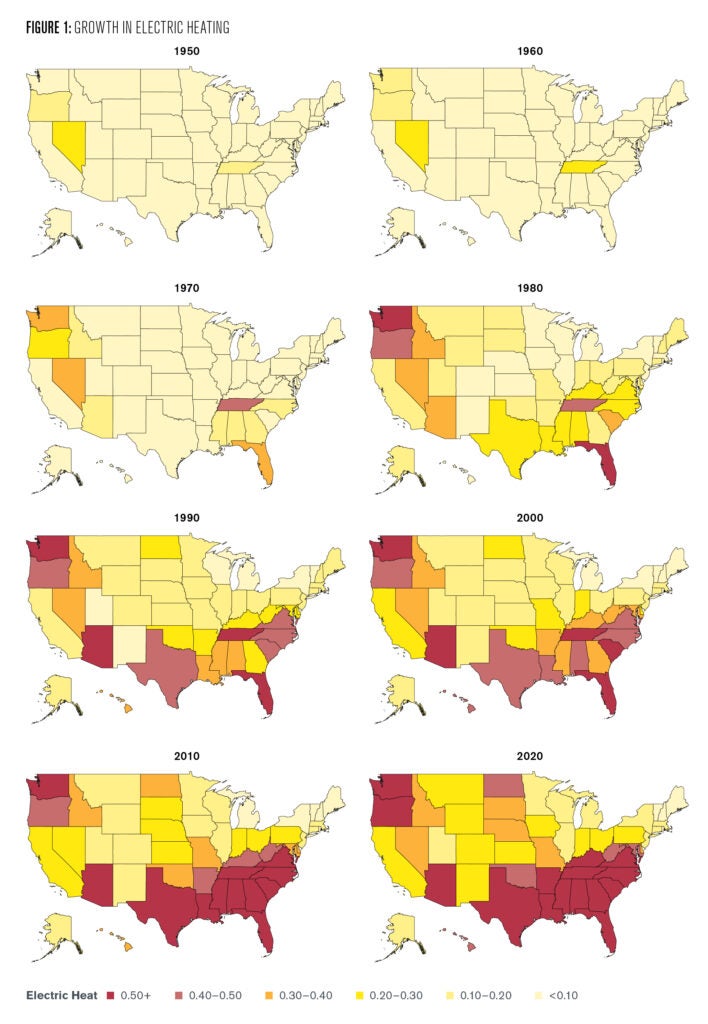
As shown in Figure 1, electric heating reached 18% in 1980, 26% in 1990, 30% in 2000, 35% in 2010, and 40% in 2020. Electricity heating is the dominant form of heating in the Southeast, more than 50% throughout the region and more than 90% in Florida. Electric heating is also prevalent throughout the West and Midwest, particularly in the Pacific Northwest.
In this new research, I use data on heating choices from millions of U.S. households over this 70-year period to investigate the key determinants of this increase in electrification. The key dataset is compiled using information from five waves of the U.S. decennial census, along with twenty waves of the U.S. American Community Survey.
All of these surveys ask respondents about their primary form of home heating. The key question asks “Which fuel is used most for heating this home?” These data also provide information on the age of the home, household income, housing characteristics, and the state of residence.
What explains the increase in electric heating? This policy digest proposes five hypotheses, collects data on all five, and then designs an empirical framework aimed at testing and quantifying each factor.
At the heart of the empirical framework is a linear regression model. The dependent variable is an indicator variable for homes with electricity as the primary form of space heating. The independent variables include electricity, natural gas, and heating oil prices, as well as household income, climate variables, housing characteristics, and other factors.
This is one of the first economic analyses of electrification. This digest is the first to document or attempt to understand this 70-year increase in electric heating, and the first to calculate the economic cost of an electrification mandate.
Prices, Prices, Prices
Overall, the five hypotheses are shown to explain more than 90% of the increase in electrification since 1950. By far, the single most important factor is energy prices. Figure 2 shows residential prices by state over 1950 to 2020.
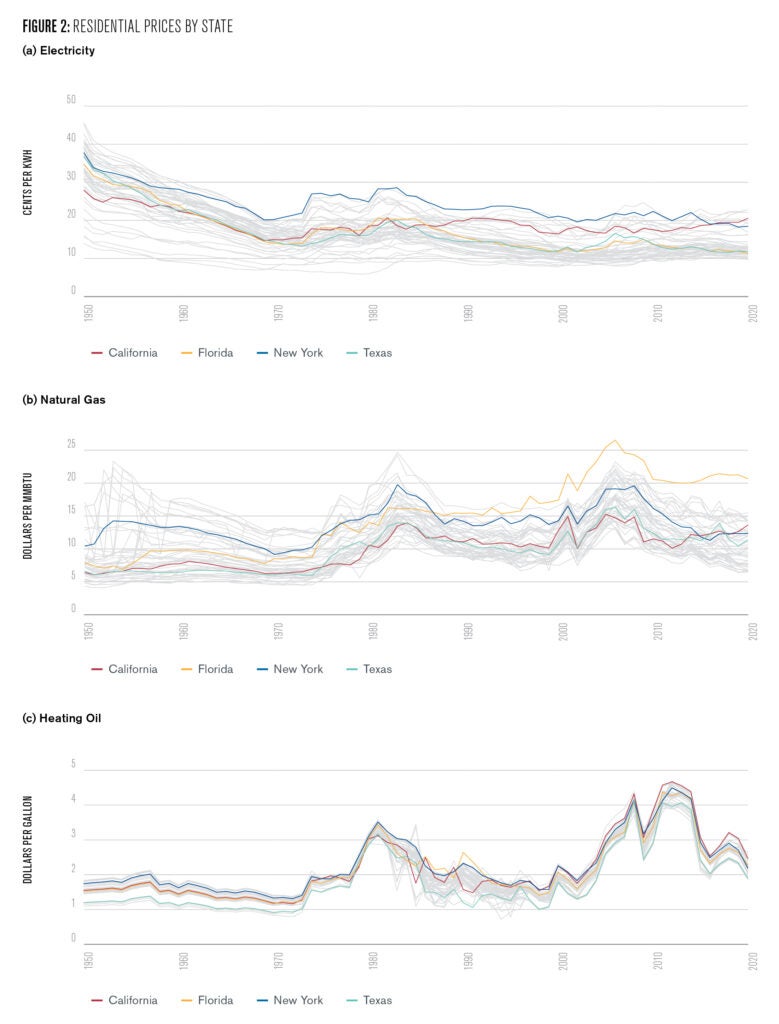
U.S. residential electricity prices decreased over 50% in real terms during this period, while residential natural gas and heating oil prices increased by 30% and 80%, respectively. Had these changes not occurred, the model predicts that there would have been dramatically less electrification over this period.
I find that residential heating system choices are highly sensitive to energy prices. Households are much more likely to choose electric heating when electricity prices are low. A 10% increase in electricity prices decreases electric heating by 4.2 percentage points.
This effect is strongly statistically significant and large in magnitude. Everything else equal, going from 22 cents per kilowatt hour (the current price in Massachusetts) to 10 cents per kilowatt hour (the current price in Louisiana) implies a 32-percentage point increase in electric heating.
Natural gas and heating oil prices matter too. These cross-price effects are expected to be positive, and the point estimates are indeed positive. For instance, a 10% increase in natural gas prices increases electric heating by 2.1 percentage points. This effect is strongly statistically significant and large in magnitude.
I use a decomposition analysis to calculate how much of the increase in electrification can be explained by each hypothesis. Changing energy prices are by far the single most important factor, explaining two-thirds of the increase in electrification since 1950.
This finding that household heating choices are highly sensitive to energy price points to the critical importance of pricing energy efficiently, a long-standing theme in economic analyses of energy markets and utility rate design (Borenstein and Bushnell, forthcoming).
Geography, Climate, and Other Factors
Heating degree days (HDDs) have a strong negative impact. In particular, an additional 1000 HDDs annually decreases electric heating by 6 percentage points.
This is a large effect. For example, current HDDs in Minnesota and Florida are 8,400 and 600, respectively. My estimates imply that, everything else equal, households in Minnesota are 47 percentage points less likely to choose electric heating than households in Florida.
Electric heating has lower initial capital costs than other forms of heating, so is preferred by households in warmer climates. Over this 70-year period there has been a pronounced shift in new housing construction toward warmer states, and this changing geography can explain about 7% of the increase in electrification since 1950.
In addition, climate change is making all parts of the United States more conducive to electric heating, and this factor can explain about 4% of the increase in electrification.
Other factors matter less. Household income has only a small impact on heating choices. Higher income households are slightly less likely to choose electric heating. But the effect is small enough that income is essentially irrelevant for understanding the growth in electric heating since 1950.
Measuring Willingness to Pay
These data and framework are next used to calculate the economic cost of an electrification mandate for new homes. The analysis uses a discrete choice model to measure the expected change in utility from requiring households to choose electric heating. In the model, households weigh energy prices, climate, geography, housing characteristics, and other factors when making heating system choices.
The data and key variables are the same as in the linear regression model described earlier. However, the discrete choice model makes a functional form assumption about the error term and other assumptions which make it possible to calculate willingness to pay (WTP). These modeling choices are informed by a long history of economists using discrete choice models to describe household-level energy decisions (Mansur, Mendelsohn, and Morrison, 2008; Davis and Kilian, 2011).
Whereas the historical analysis uses data from 1950 to 2020, the WTP analysis is forward looking, using data from homes built in 2000 to 2020. Since 2000, about 90% of new U.S. homes use electricity or natural gas for their primary heating system. Accordingly, the choice set is restricted to those two options. Homes heated with heating oil, propane, and other less common heating fuels are excluded when estimating the discrete choice model and from the calculations of willingness to pay.
After estimating the model, I calculate WTP as the expected difference in utility between the status quo in which households may choose either heating fuel and an electrification mandate that requires all households to use electric heating. Households who strongly prefer natural gas have a high WTP while households who strongly prefer electricity have a WTP near zero.
Geography Matters
Figure 3 plots average WTP by state. Households in warm states throughout the Southeast tend to prefer electric heating anyway, so are willing to pay less than $300 annually on average to avoid an electrification mandate. Households in Florida, for example, already overwhelmingly choose electric heating so the average WTP is only $130 to avoid an electrification mandate.
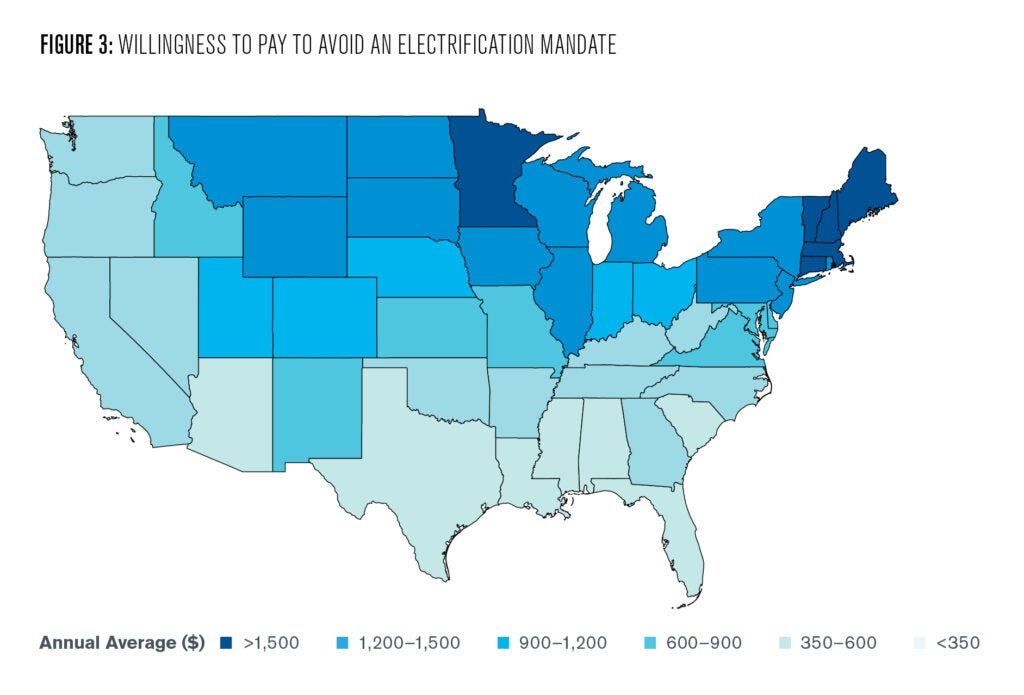
The West Coast is more temperate, with WTP $850 in California, $790 in Oregon, and $820 in Washington. The somewhat higher WTP in California reflects, in part, higher than average electricity prices. By the same argument, WTP tends to be lower in states with below average electricity prices including Kentucky ($330), West Virginia ($360), and Oklahoma ($410).
Household in cold states tend to strongly prefer natural gas so are willing to pay more than $1000 annually on average to avoid an electrification mandate. This includes populous states like Pennsylvania ($1,140), Ohio ($1,160), New York ($1,370), and Illinois ($1,410).
Finally, WTP is above $1500 annually in particularly cold states Wyoming ($1,570), Vermont ($1,590), New Hampshire ($1,600), and Montana ($1,680).
The model also reveals considerable variation within states. For example, households in multi-unit homes have lower overall demand for heating and thus lower WTP to avoid mandates. These households thus represent a potential opportunity for electrification.
What About Heat Pumps?
An important caveat is that the model is estimated using historical data, and thus cannot speak to how the impact on households will be affected in the future by technological change. Probably most importantly, industry experts expect electric heat pumps to continue becoming more energy efficient.
Whereas traditional electric resistance heating converts electricity into heat, a heat pump uses electricity to move heat from one place to another, and thus can be used for both heating and cooling. Heat pumps have become more energy-efficient over this period along with other compressor-based appliances.
About 10% of U.S. households have heat pumps, with three-quarters of those households located in the Southeast where winter temperatures are mild and heat pumps are most effective. Heat pump performance degrades at lower temperatures and thus far there has been relatively little heat pump adoption in the Northeast or Midwest.
Many experts expect heat pumps to continue to gain popularity. In part, this depends on technological innovation. If heat pumps continue to become more energy-efficient, they could become cheaper than alternative technologies in more U.S. regions which would further increase adoption and decrease the cost of electrification policies.
Conclusion
One broader implication of the research is that, nationally, it may be a lot easier than is generally believed to encourage electrification. The steady historical trend over the last seven decades means that 50 million U.S. households have already electrified. Moreover, the analysis identifies large numbers of additional households for whom adopting electric heating would impose relatively modest costs.
An important goal for future research is to ask whether electrification mandates pass a societal cost-benefit test. These WTP estimates provide a starting point, but they are calculated based on current residential energy prices and thus reflect private, not social costs. These costs would then need to be compared to the benefits from reduced fossil fuel emissions.
The generation mix matters too. U.S. electricity generation has become much cleaner (Holland, et al., 2020), but emissions vary regionally and there are large parts of the country that continue to rely heavily on coal. The economic case for electrification is strongest in places where electric generation is relatively green.
Lucas Davis
Jeffrey A. Jacobs Distinguished Professor, UC BerkeleyLucas Davis is the Jeffrey A. Jacobs Distinguished Professor in Business and Technology at the Haas School of Business at UC Berkeley. Davis is a 2021-2022 Kleinman Center Visiting Scholar.
Borenstein, Severin and Jim Bushnell. “Do Two Electricity Pricing Wrongs Make a Right? Cost Recovery, Externalities, and Efficiency.” American Economic Journal: Economic Policy (forthcoming).
Davis, Lucas. 2021. “What Matters for Electrification? Evidence from 70 Years of U.S. Home Heating Choices.” Energy Institute at Haas (working paper).
Davis, Lucas and Lutz Kilian. 2011. “The Allocative Cost of Price Ceilings in the U.S. Residential Market for Natural Gas.” Journal of Political Economy 119 (2), 212–241.
Holland, Stephen, Erin Mansur, Nicholas Muller, and Andrew Yates. 2020 “Decompositions and Policy Consequences of an Extraordinary Decline in Air Pollution from Electricity Generation.” American Economic Journal: Economic Policy 12 (4), 244-274.
Mansur, Erin, Robert Mendelsohn, and Wendy Morrison. 2008. “Climate Change Adaptation: A Study of Fuel Choice and Consumption in the U.S. Energy Sector.” Journal of Environmental Economics and Management 55 (2), 175-193.
