
As the number of electric vehicles in large cities increases dramatically, the development of supporting infrastructure, particularly public charging stations, has influenced the transformation of urban spatial patterns.
The increasing environmental crises including air pollution and carbon emissions have caused great social concern. The World Health Organization (WHO) reported in 2012 that over a million people died from outdoor air pollution in China within one year. Pressed by severe environmental consequences as well as resulting social discontent, the Chinese government has carried out aggressive measures to promote the electrification of the transportation sector, in addition to other policies such as relocating heavy industries and increasing energy efficiency.
Stimulated by generous consumer incentives, enormous investments in infrastructure, and tough regulations by local governments to discourage gasoline vehicles, the production and sale of electric vehicles have surged in China. In 2019, EVs registered in China have reached 3.44 million, accounting for 60 percent of the world’s total electric fleet.
The EV has also been promoted enthusiastically worldwide. Many developed countries have defined goals in terms of the number of EVs on the road within a certain timeframe. For example, EVs in the United States will predictably increase to 3.6 million by the end of 2025. In Europe, EVs and hybrid-energy cars accounted for over 50 percent of new car sales in 2017, and keep growing; Germany has set up a goal to reach a million EVs by 2020.
Correspondingly, many questions have arisen in terms of charging demands and infrastructure planning to accommodate such growth, as well as the impact on urban layout and urban lifestyle. Deployment of infrastructure and supply-demand management will need to develop in coordination with proper urban form designed around the principles of smart growth, urban livability, and social inclusion. Otherwise, it might backfire: with a system that underperforms, aggravates socio-environmental inequality, and acts against urban sustainability.
This study focuses on infrastructure planning through studying actual EV owners’ charging demands, using Location-Based Service (LBS) data embedded in individual smartphones. Although Public Charging Stations (PCS) account for less charging activities than households and workplaces, and have a smaller portion in supporting routine commuters, it is crucial to estimate the dynamic charging demands currently provided by public charging stations.
Like other public amenities, these stations are a shared amenity without a set of dedicated users. However, the availability and location of PCS can significantly influence EV driver behavior. These features can also influence the choice of purchasing an EV or a gasoline vehicle. Travel range due to limitation of battery power can cause driver anxiety.
With an increase in EVs on the road, the demands for public charging infrastructure must also grow rapidly, especially from EV owners without access to dedicated charging and those who travel long distances. This is particularly important for EV users in China, because most of them live in high-density neighborhoods without or with a shortage of charge stations.
A lack of public charging stations also puts pressure on the urban electric grid by increasing the frequency of home or workplace charging. For these reasons, the density and layout of charging infrastructure are important issues for both the adoption and efficiency of the EV system and the sustainable development of cities.
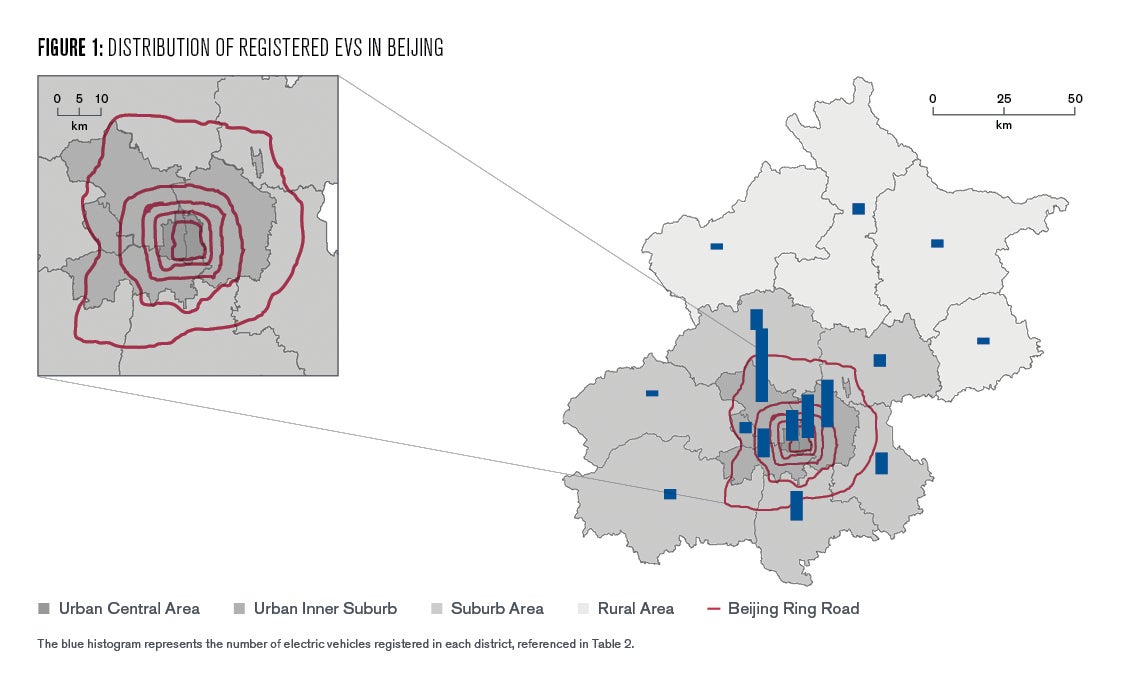
We use Beijing, China as the main case study in this project. China’s capital has been leading in this decisive move toward electric transportation with enormous support from the government to improve the city’s environmental quality. Spatially, Beijing’s historic centripetal structure, characterized by a series of ring roads, dominates the urban layout and land use of the city, resulting in perennial traffic congestion and environmental degradation as the city grows to an unsustainable scale.
Research indicates that transportation accounts for 25 percent of air pollution in Beijing. The city has implemented aggressive measures in transportation to encourage EV over gasoline vehicles. This includes separating the quota of license plates for EVs and that for conventional cars, with the former increasing year by year and latter being reduced incrementally, making it more difficult for drivers to get a license for gasoline cars through already competitive lottery cycles. As the result, the number of EVs has recorded a growth of 2,630 percent in five years to reach 224,000 in 2018.
In the meantime, 3,075 public charging stations have been installed for public usage; each station normally includes more than four charging piles. Several questions draw our particular interest with such rapid increase:
- How well does new infrastructure match the growing charging demands?
- Is there any correlation between the most used facilities and the spatial characteristics of the neighborhood and urban environment?
- How does the rapid growth of PCS influence the changing urban form in Beijing?
Probing these questions will allow us to understand which policies, investment, plans, and guidelines of developing new infrastructure serve the growing EV fleet in Beijing and other cities. Furthermore, exploring the options of infrastructural development for EVs in large cities like Beijing can also inform our discussions of climate change, energy policy, and urban sustainability with the foreseeable growth of transport electrification in the cities throughout the world.
Research Design and Data Analysis
Location-based service (LBS) embedded in individual smartphones provides datasets for navigation, route planning, and location inquiry. It generates an enormous amount of real data and facilitates a deeper understanding of human mobility, including EV. In this study, we use the data generated by Baidu Map, the leading map service provider and big data operator in China. EV drivers use LBS for different purposes including:
- Searching for nearby charging stations. The most common charging demands occur when the EV drivers on the road realize that the car is in low battery, then search for nearby PCS.
- Navigation to charging destination. When EV drivers travel somewhere distant, they often consider battery power and plan the trip with an end-of-route charging location.
- Route optimization. EV drivers tend to route plan in order to avoid congestion and maximize energy efficiency, particularly when commuting in a large city like Beijing, even though they know how to get to the destination.
With these three behaviors in mind, this study involves collecting and sorting EV user data to map the locations of charging demands and charging activities. 13,621 EV drivers’ records of public charging activities are extracted from LBS during a 5-day period. All location data is processed and downscaled to a 100m resolution grid, which balances privacy protection and data accuracy.
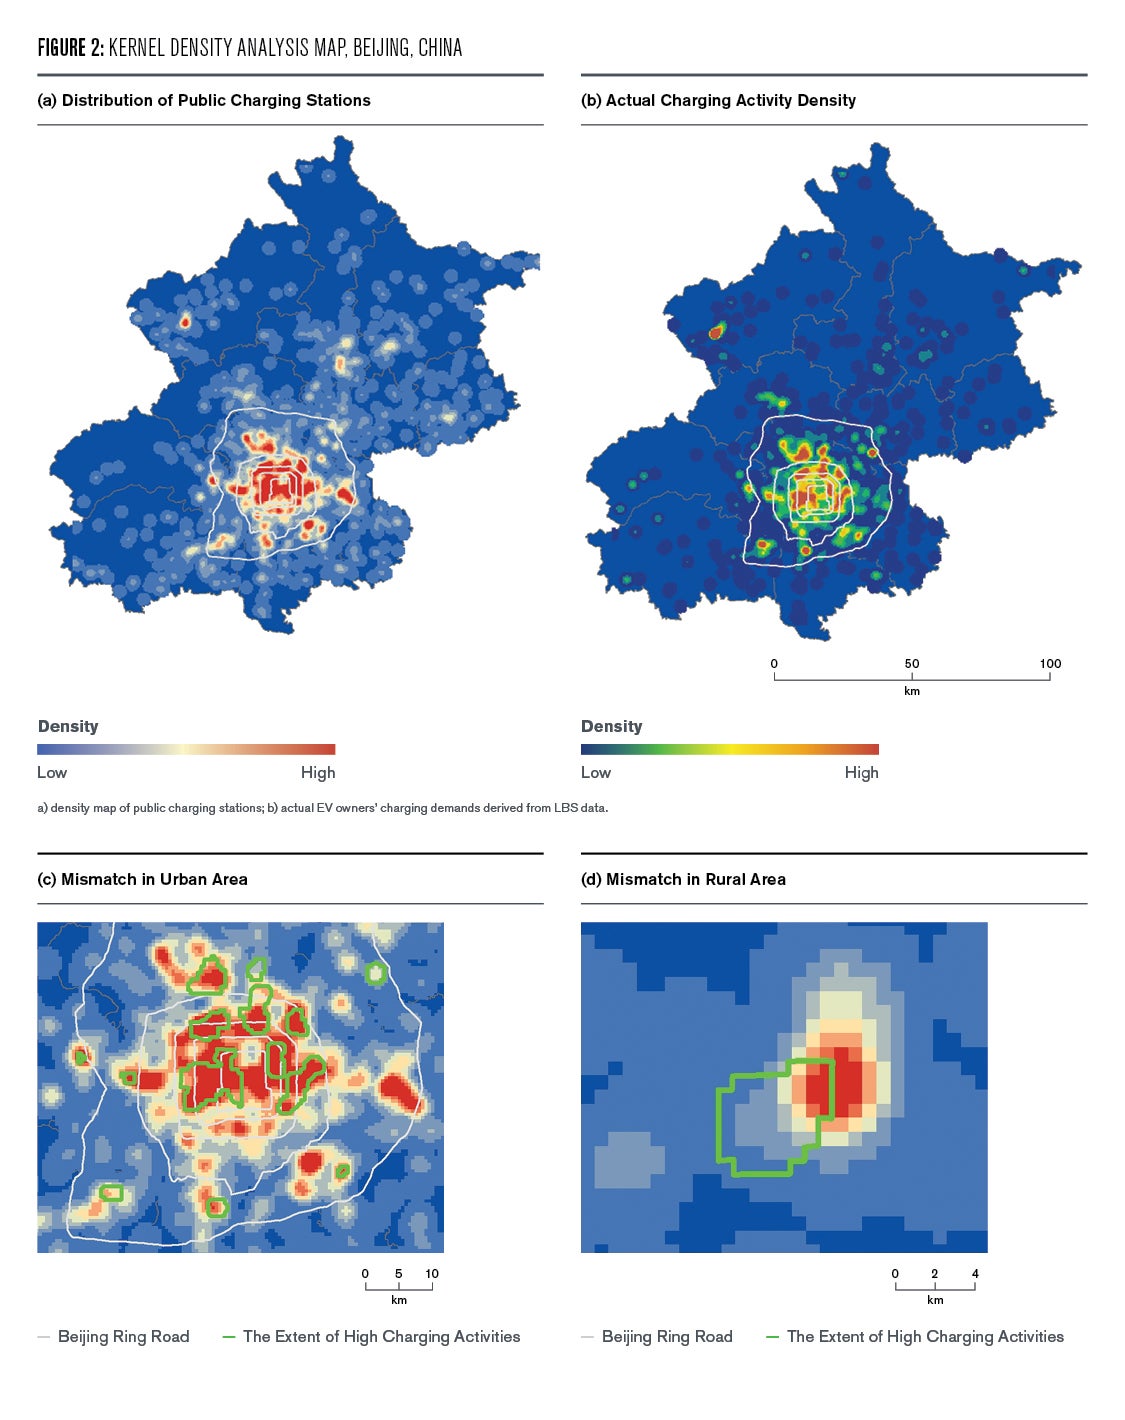
We use Kernel Density Function and spatial statistics to investigate the distribution of charging activities, and to analyze to what extent the charging demands match the current distribution of EV infrastructure. The combination of macro-scale and micro-scale analyses reveals a spatial-temporal heterogeneity of charging activities.
We also compare the mapping of charging activities with the spatial characteristics of urban districts and neighborhoods, and explore the reciprocal relationship between the frequency of usage of charging stations and the land use and transportation conditions of the location. This methology is described in more details in the appendix.
Mapping the Charging Supply and Demand
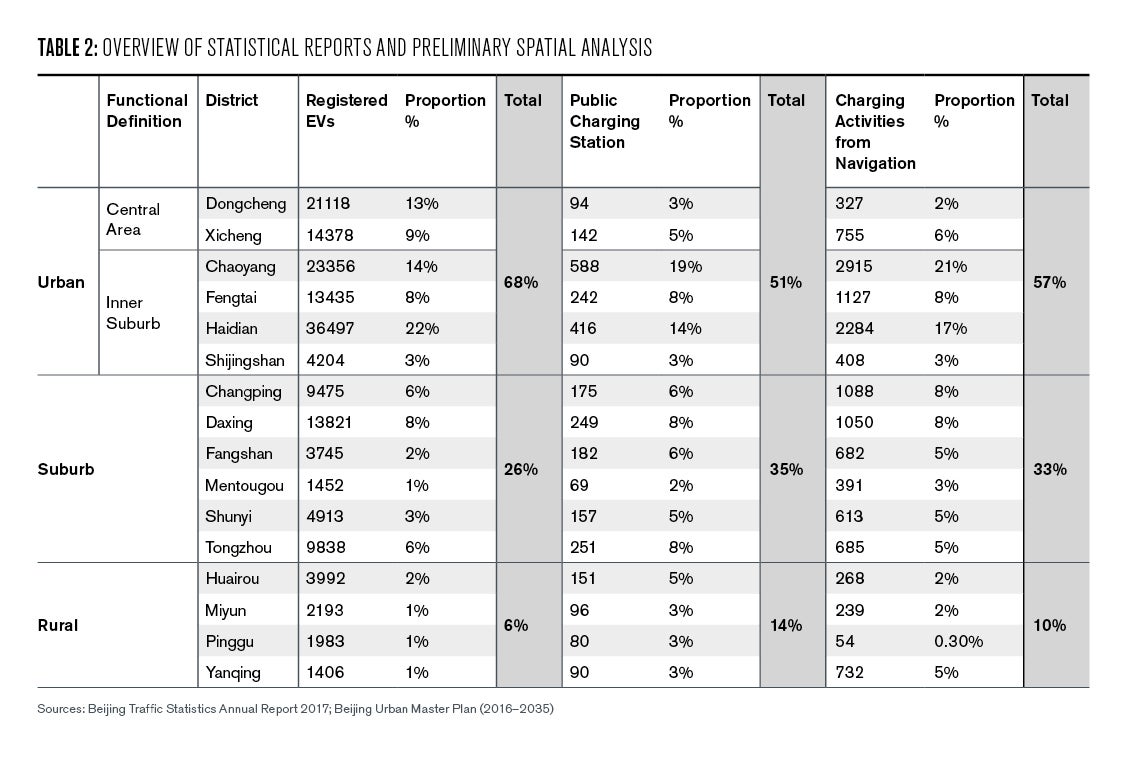
The research generates findings in several aspects of EV drivers’ travel and charging behaviors, as well as their relation to the geo-spatial pattern of the city. In line with the findings of previous studies in other countries and cities, Beijing’s urban center witnesses a higher level of concentration of deployment of PCS. According to the 2017 Beijing Traffic Statistics Annual Report, 68 percent EVs are registered in the six central districts—Dongcheng, Xicheng, Haidian, Chaoyang, Fengtai, and Shijingshan. These center city districts have a total area of 1381 km2.
Consequentially, 51 percent of the 3,075 PCS are deployed in these six districts, compared to 35 percent in the suburb districts, and the remaining 14 percent in the rural areas in the greater Beijing Metropolitan Region (figure 2a, table 1). However, the locations where EVs are registered do not accurately reflect the dynamic spatiality of actual usage of vehicles or their travel patterns, because it is common for an owner to register the car at one location but live in another due to such factors as registration quota availability, financial incentive, and ownership of multiple properties.
Therefore, what the previous studies and initial statistics cannot tell us is the substantial spatial heterogeneity in charging demands, and the characteristics in land use or density associated with different charging demands. Some issues arising from the rapid development without sufficient study or suitable precedent include mismatch of supply and demand, non-interoperability and sharing of charging piles, low overall utilization for layout, and time constraints for parking.
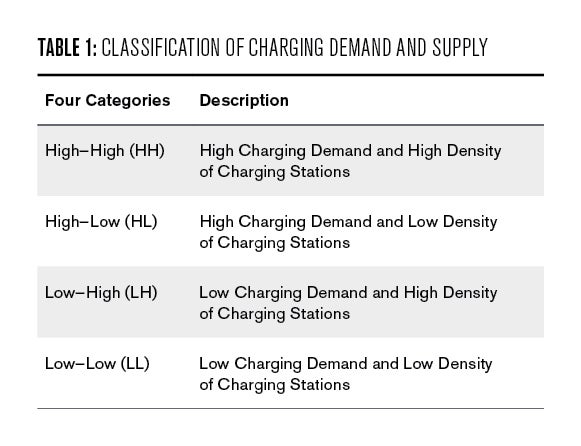
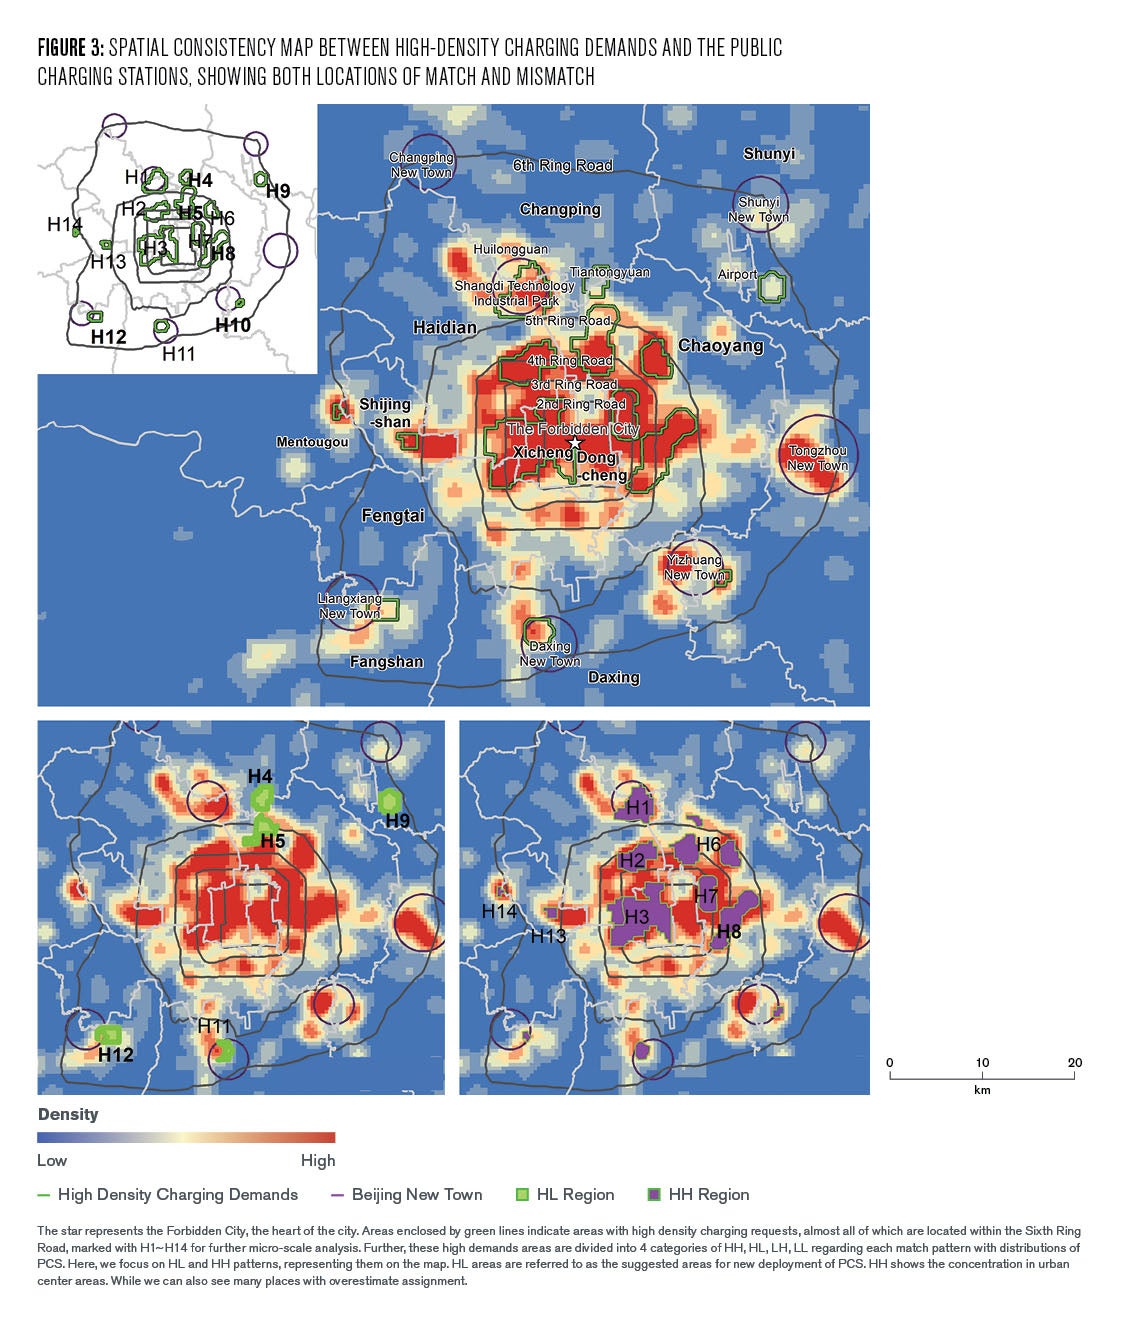
Our initial study focuses on the issue of mismatch between the deployment of charging stations and the actual charging demand. We classify the conditions into four categories: high demand-high availability (HH), high demand-low availability (HL), low demand-low availability (LL), and low demand-high availability (LH), as described in table 1. The demand is characterized by the frequency of LBS associated with the identified locations (Figure 2&3). HL and LH are what we consider mismatched conditions and deserve attention or intervention (Figure 3).
The HL areas are places where new infrastructural investment is needed. Based on the geo-spatial data, H4, H5, H9, H11, and H12 belong to this category (Figure 3). Different from the city center where a high-density charging facility network has been established, HL areas are mainly located between the Fifth and Sixth Ring Roads in Beijing connecting the urban center and suburban areas (Table 2, Figures 3).
They can be further divided into two groups by location, land use, and density, namely large-scale residential community areas (such as H4, H5) and transportation hubs (H9, H11, and H12). The latter refers to the places located at the intersection of metro lines and highways, especially highways leading to airports or high-speed rail stations, or connecting Beijing and rural county seats.
We recommend that new installation be restricted in the LH areas, until the supply-demand dynamics become more balanced. Our mapping indicates that both Tongzhou New Town (which has been designated as the new administrative district of Beijing as part of the effort to consolidate the old city as the National Capital) and Dongcheng District (east side of Beijing’s city center) are equipped with a high density of charging stations that are underutilized. New infrastructural investment should be cautiously considered in these areas.
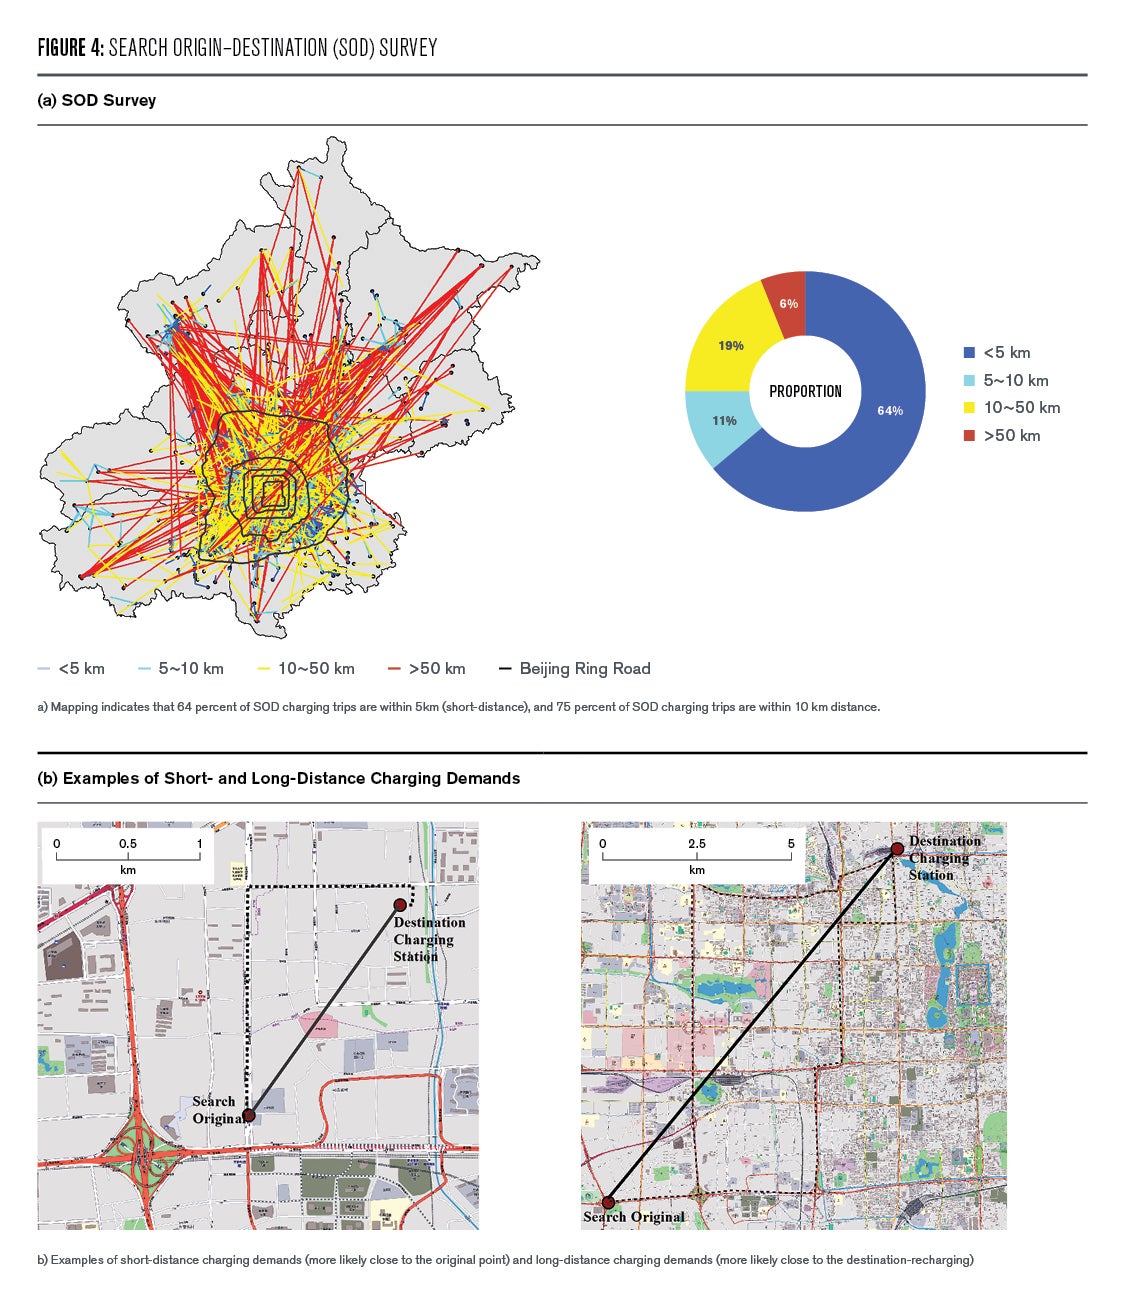
We use the Search Origin-Destination (SOD) survey to estimate EV owners’ charging demands. It confirms that EV users are more dependent on path optimization than drivers of conventional cars. They tend to choose a route with charging stations and consistent with the direction from the origin to the destination (Figure 3). The SOD survey indicates different patterns based on the distance between the original location and destination location of route search. When the SOD distance is less than 5km, the charging demands are more likely occur near the original point, or the target PCS. When SOD is father than 5km, the charging demands tend to occur near the destination point.
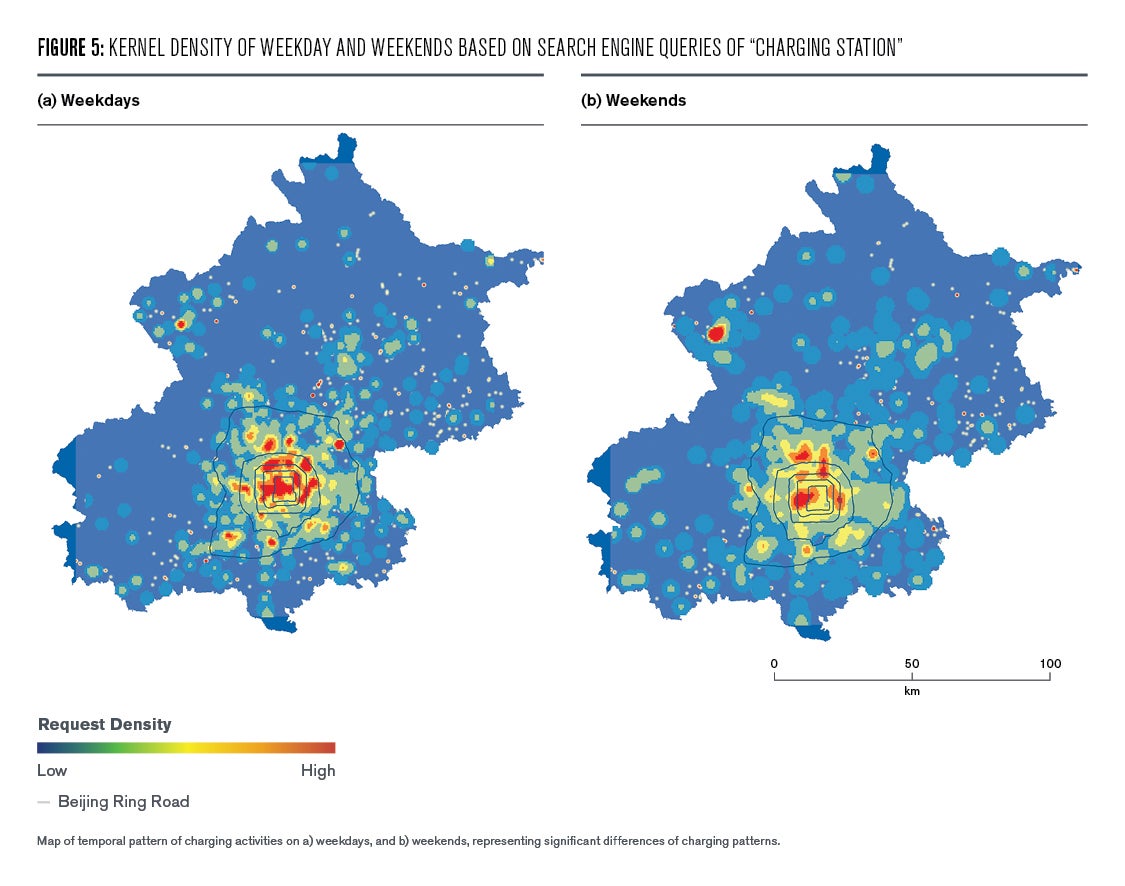
The patterns of charging activities associated with PCS also show significant differences on weekdays and on weekends. The charging activities on weekdays are distributed in various functional areas across the whole city, and are often tied to commuting and business activities (Figure 5).
In contrast, charging activities on weekends are notably concentrated at certain city areas, including two specific types of functional areas. The first features the cultural and entertainment centers and the historic attractions within the city center, as well as the CBD of Chaoyang District where large shopping malls and entertainment facilities are located.
The second type includes large residential neighborhoods mostly located in the northern part of the city center. These residential areas are characterized by middle-class residents and migrant populations, yet underserved by commercial facilities, i.e. Huilongguan and Tiantongyuan neighborhoods.
Spatial Heterogeneity and Social Inequity
HH represent the areas where the supply and demand of charging facilities match and are both at a high level. We zoom in scale to analyze these areas and investigate their differences with the HL areas in order to learn more about the characteristics of high charging demands. Why do these types of areas draw higher charging activities? Most of large-scale HH areas are located within the Fifth Ring Road, and are characterized by high level of mixed use, business zones and education zones, as well as high-tech new towns.
The connection between land use/density and charging demand is further verified by the underutilized charging stations just outside these zones. It is also worth noting that, although in general the HH areas have sufficient supplies of charging stations, the “matching” pattern has to be attributed to a certain degree of over-deployment of infrastructure in these areas. The level of redundancy is necessary due to the prospect of continuing growth of these economic zones and new towns in the near future.
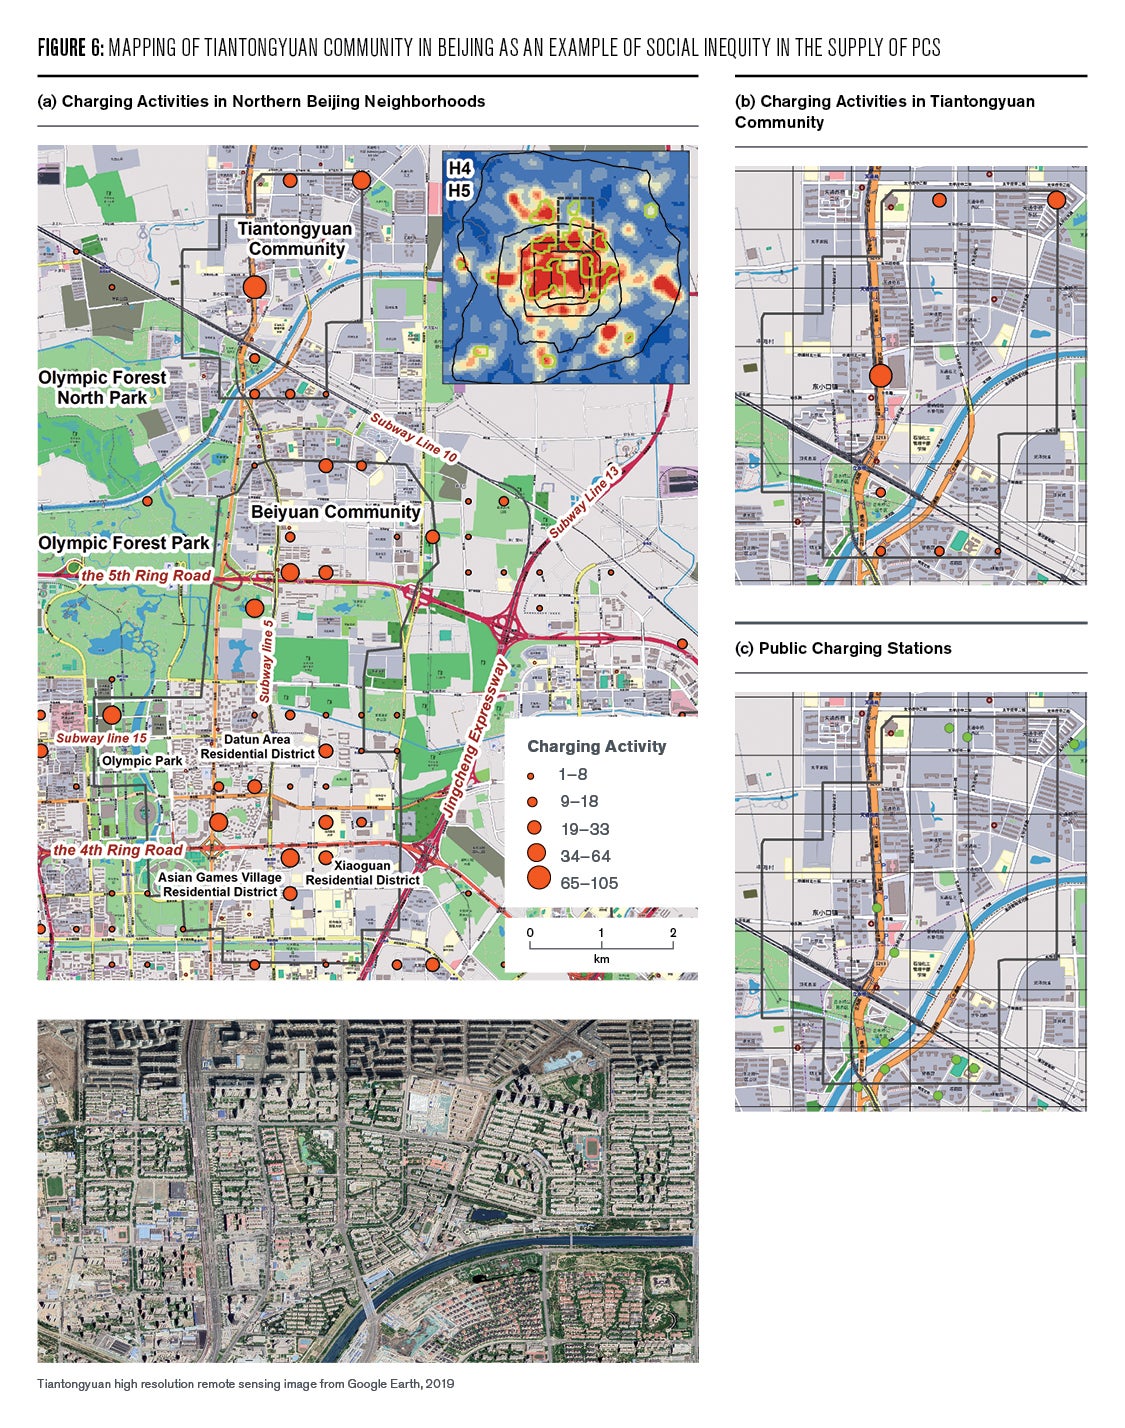
In sharp contrast to the HH areas, the mismatch HL areas often expose the problem of social inequity in association with their spatial heterogeneity in the micro-scale analysis. For example, Tiantongyuan (H4) is a residential neighborhood developed during Beijing’s rapid urbanization in the 2000s. Often regarded as the largest high-density community in Asia, it houses more than 700,000 residents over an area of 8 km2, most of whom are migrant workers attracted by the relatively low housing price and rent.
There is, however, an insufficient supply of amenities including commercial facilities, education resources, open spaces, and parking. This area suffers from overcrowding as well as poor urban sanitation. The investment of EV infrastructure also lags behind other high-density neighborhoods in Beijing and is unable to meet the large and growing demand of such a population.
Policy Implications
The findings from this research generate a deeper knowledge of the EV system, which can potentially inform the planning of cities in the age of electric mobility. They can be broken down to several aspects:
Heavy Use Areas
- Compact, mixed-use, and socially inclusive urban areas including commercial centers and mixed-use neighborhoods tend to produce higher charging demands.
- Higher-education and high-tech industrial parks also perform better with high-level charging activities if these urban job centers are surrounded by residential communities. Some new towns in the outskirts of Beijing also testify this rule.
Lower Use Areas
- New towns located away from the city center tend to rely on public transportation systems like metro, airport, and railway. These areas may not justify new charging infrastructural investment.
Variable Use Areas
- Shopping districts, parks, and attractions have charging activities that fluctuate more significantly between weekdays and weekends or holidays. This requires consideration of flexibility in the deployment of charging stations.
Building infrastructural systems that support electric transportation is a significant public investment, especially considering the rate of growth in a city like Beijing. Therefore, decisions must be made based on concrete investigations of the need and the trend of urban growth. The current PCS network in Beijing basically follows the city’s centripetal pattern, with more resources concentrated in the urban center.
Spatial study at a finer-grain, however, suggests an asymmetric and less centralized pattern of demand. Greater attention must be paid to the high-density condominium neighborhoods. As a prevalent housing typology in Chinese cities, this kind of neighborhood often sees high numbers of EV users who rely on public charging facilities as few residents can afford private parking spaces.
Locations linked to public services, particularly transit stations, shopping centers, parks, and institutions around the communities provide opportunities for destination-charging and parking, and represent optimal locations for charging facilities in the city.
Future Considerations
Two fundamental changes are influencing the spatial pattern of Beijing as well as many other large cities, and thus require adjustment in the way in which we plan and develop the EV infrastructure.
On the one hand, as the directive from the central government to decentralize Beijing is carried out in phases, the current spatial structure of a centralized pattern will be gradually dissolved as more and more residents and industries will be relocated to the urban periphery, forming clusters of urban zones with specific focuses on demography and industry. The spatial heterogeneity discovered in this study will become stronger and thus requires more in-depth analysis of the actual demand-supply dynamics affecting the wider territory.
On the other hand, the rapid development of ride-sharing continues to reduce the demand for car ownership. And the world of electric mobility is moving toward a higher level of automation as the technology of driverless vehicles is advancing.
These trends imply not only a more decentralized distribution of EV infrastructure but also a greater role that PCS has to play in the industry. The importance of coordination with other sectors of transportation including mass transit, regional rail, and aviation will significantly increase, a trend this research indicates.
Feature Photo: iStock.com/zevei-wenhui

Zhongjie Lin
Associate Professor of City and Regional PlanningZhongjie Lin is an associate professor of city and regional planning at the Stuart Weitzman School of Design.

Jing Kang
Researcher, Tsinghua UniversityJing Kang is a visiting researcher at the University of Pennsylvania Institute for Urban Research and a postdoc researcher in the Department of Urban Planning at Tsinghua University.
Arias, Mariz B., and Sungwoo Bae. 2016. “Electric vehicle charging demand forecasting model based on big data technologies,” Applied Energy, 183: 327-339. DOI: 10.1016/j.apenergy.2016.08.080
Beijing Traffic Statistics Annual Report 2017, unpublished report, Beijing, China.
Csiszar, Csaba, Balint Csonka, David Foldes, et al. 2019. “Urban public charging station locating method for electric vehicles based on land use approach”. Journal of Transport Geography, 74: 173-180. DOI: 10.1016/j.jtrangeo.2018.11.016
Kester, Johannes, Benjamin K Sovacool, Lance Noel, Gerardo Zarazua de Ruberis. 2020. “Rethinking the spatiality of Nordic electric vehicles and their popularity in urban environments: Moving beyond the city?” Journal of Transport Geography, 82: 102557. DOI: 10.1016/j.jtrangeo.2019.102557
Nicholas, Michael, Dale Hall, and Nic Lutsey. 2019. “Quantifying the electric vehicle charging infrastructure gap across U.S. markets”. White paper, The International Council on Clean Transportation. https://theicct.org/publications/charging-gap-US
Yuepeng, Pan, Tian Shili, Liu Dongwei, et al. 2016. “Fossil Fuel Combustion-Related Emissions Dominate Atmospheric Ammonia Sources during Severe Haze Episodes: Evidence from 15N-Stable Isotope in Size-Resolved Aerosol Ammonium”. Environmental Science & Technology, 50(15): 8049-8056. DOI: 10.1021/acs.est.6b00634
Schmidt, Marc, Philipp Staudt, and Christof Weinhardt. 2020. “Evaluating the importance and impact of user behavior on public destination charging of electric vehicles”. Applied Energy, 258: 114061. DOI: 10.1016/j.apenergy.2019.114061
World Health Organization. 2014. “ WHO: 7 million deaths in 2012 due to air pollution.” Mar 25, 2014, accessed Mar 30, 2020. https://www.who.int/china/news/detail/25-03-2014-world-health-organizati…
Yang, Yang, Yao Enjian, Yang Zhiqiang, and Zhang Rui. 2016. “Modeling the charging and route choice behavior of BEV drivers”. Transportation Research Part C: Emerging Technologies, 65: 190-204. DOI:10.1016/j.trc.2015.09.008
