
The Andlinger Center’s ‘Net-Zero America’ Report Highlights the Importance of Downscaled Planning
A recent report highlights the paths to a clean energy transition and the challenge we have ahead of us to reach net-zero by 2050.
Last week, The Kleinman Center hosted Princeton University researchers, Jesse Jenkins and Eric Larson, to present the Andlinger Center’s recent Net-Zero America report.
This ambitious scenario-modeling effort, involving 18 researchers, “aims to inform and ground political, business, and societal conversations regarding what it would take for the U.S. to achieve an economy-wide target of net-zero emissions of greenhouse gases by 2050.”
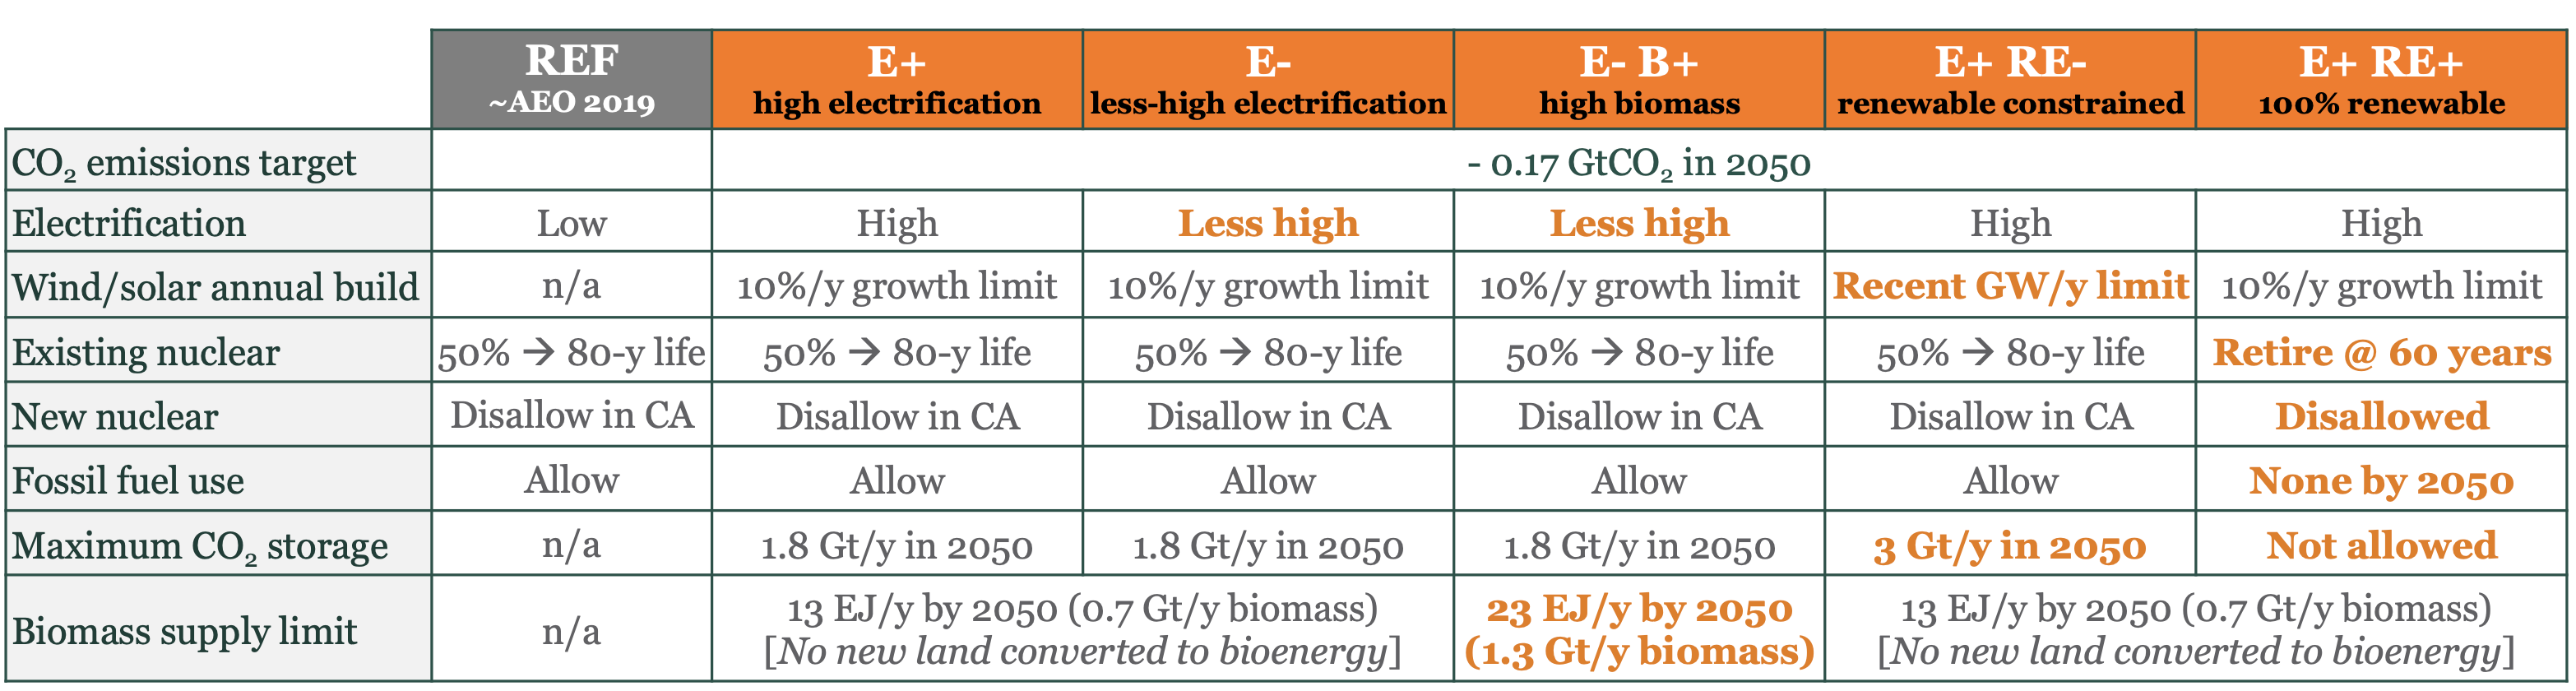
This report is structured around five least-cost pathways, summarized in figure 1, for reaching net-zero emissions by mid-century. Jenkins explained that although the actual path to carbon neutrality is unlikely to look precisely like any of these scenarios, they collectively capture the impacts and policy implications of the following four uncertainties:
- The rate and scale of electrification in the transportation and building sectors
- Land-use limitations and its impact on biomass production for renewable fuels
- Limitations on the rate and scale of wind and solar deployment
- Reliance on nuclear power and carbon capture, sequestration, or utilization.
These pathways serve to illustrate many of the profound implications these uncertainties have on future primary energy supply (see figure 2), public health, transmission investments, jobs, and land-use. These differences between the pathways offer numerous insights for policy and decisionmakers in this space. However, the similarities and common requirements of the five scenarios are no less fascinating or informative.
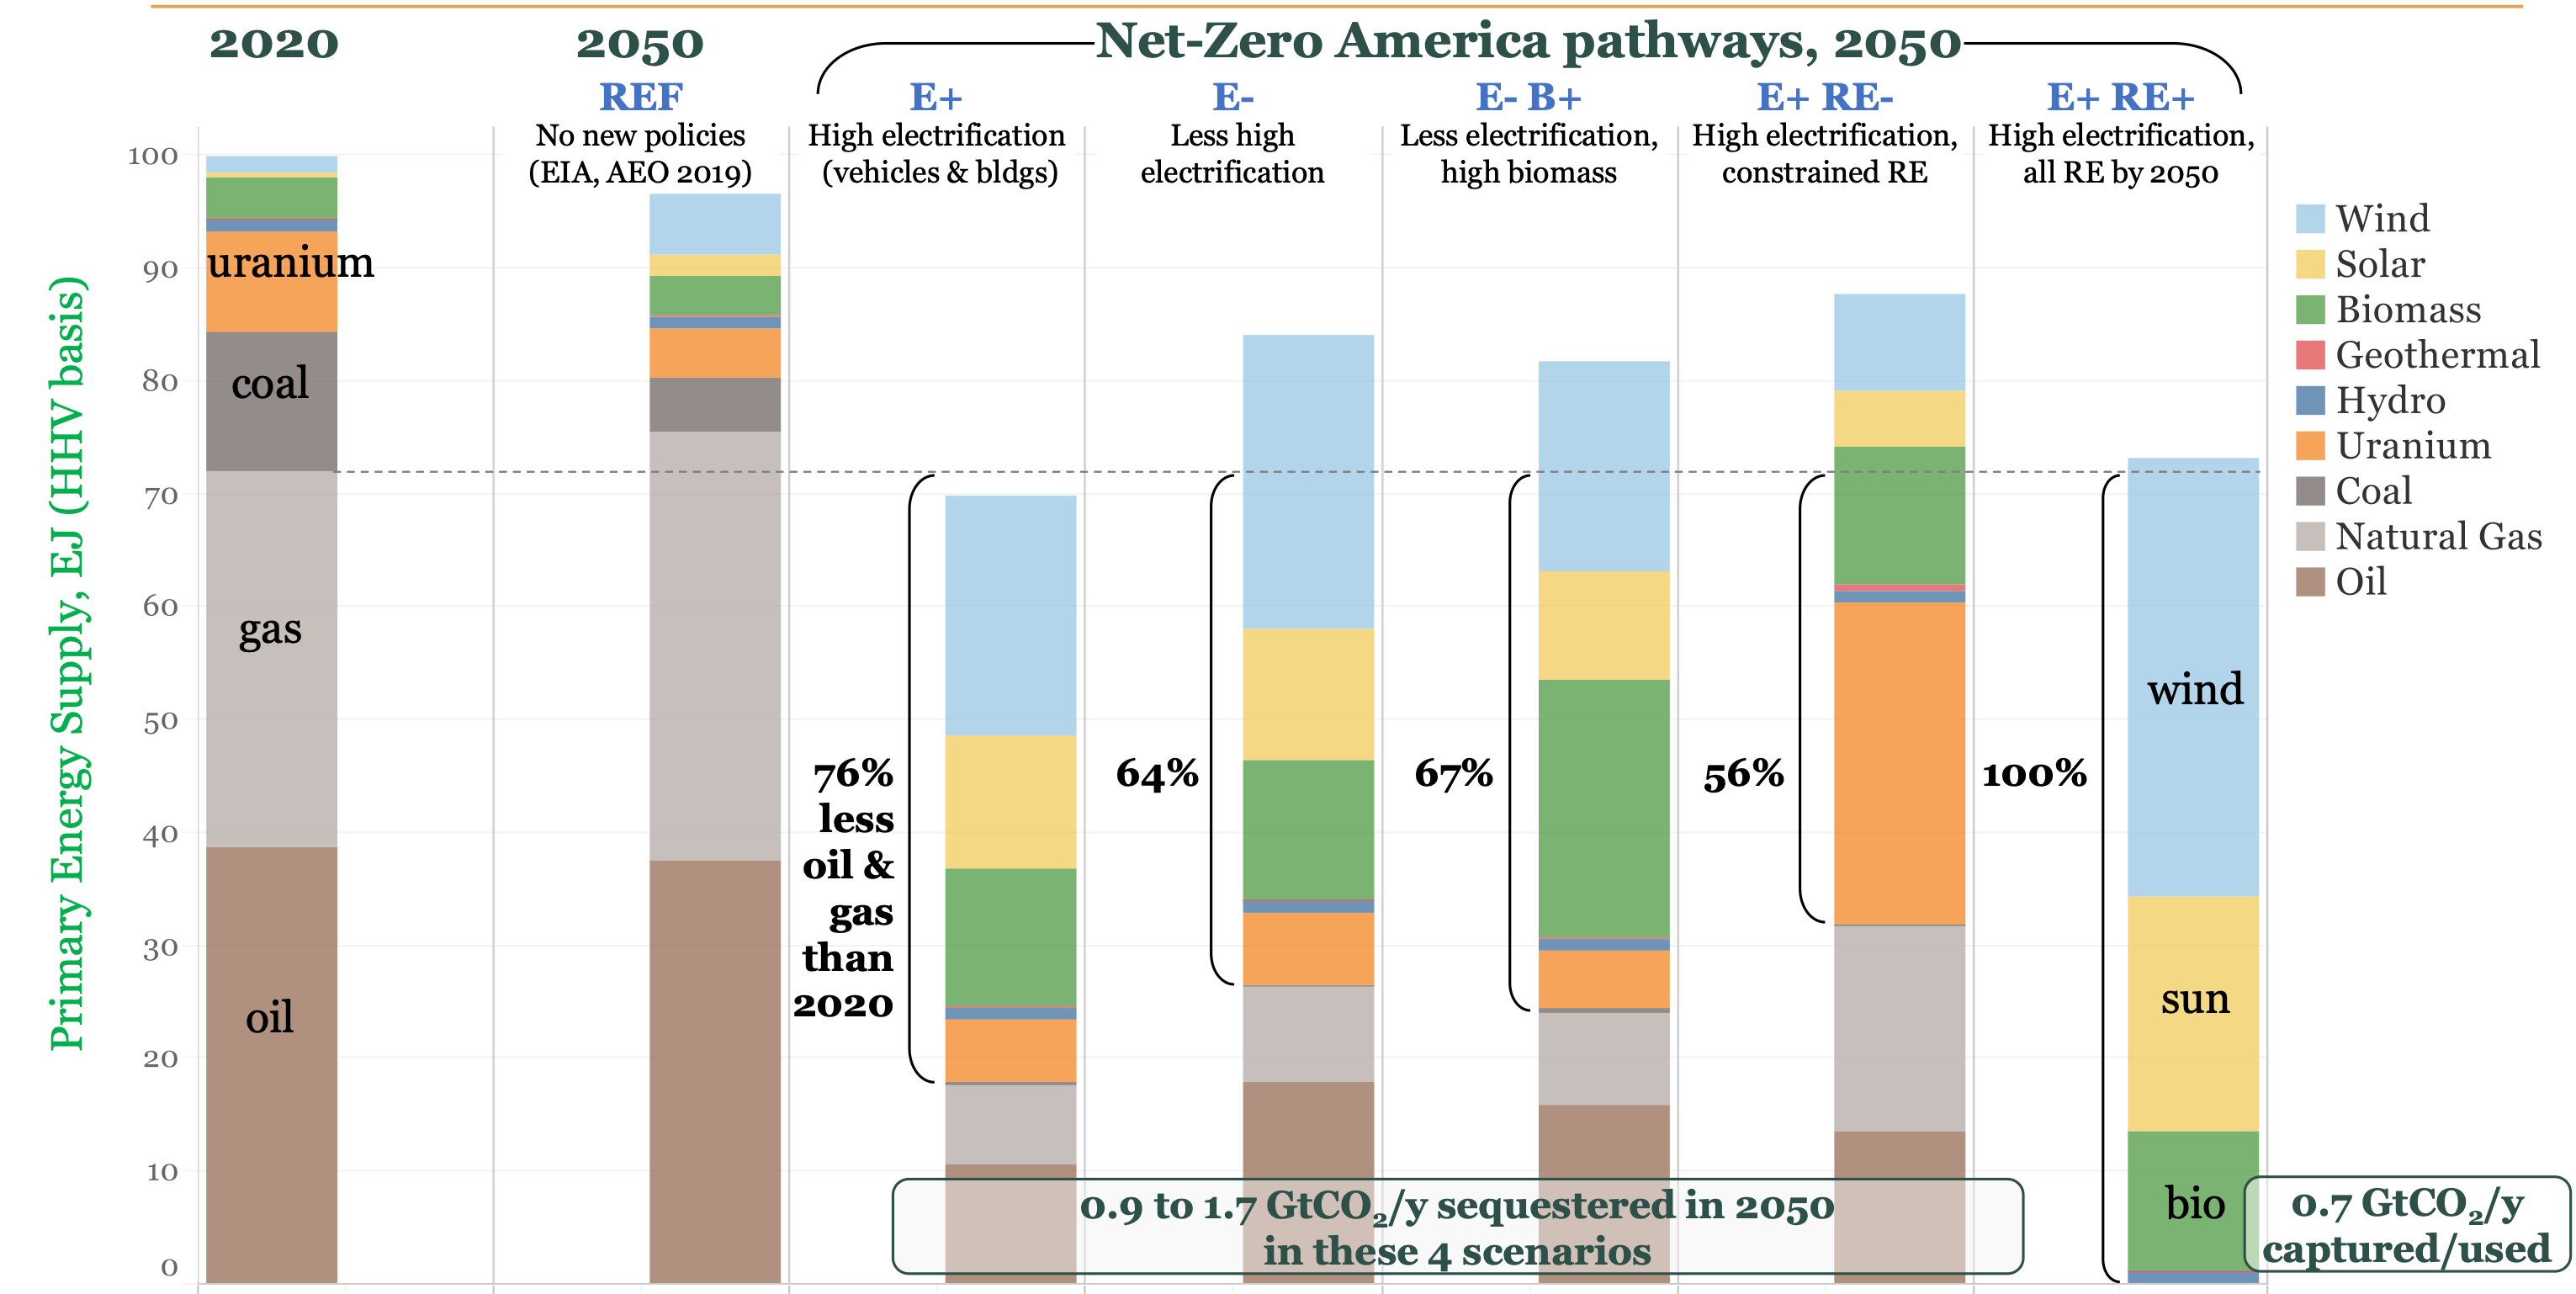
The net present value of total energy systems costs by 2050 for the five scenarios fall within a relatively tight range between $26 to $28 trillion dollars. That sounds like a lot until you read that the cost of the reference scenario (assuming no additional policy action) would still cost $22 trillion and would leave us far behind on our 2050 emissions targets. The presenters also demonstrated that all five scenarios have annualized costs (4-6% of GDP) well below historical energy system costs (5-13% of GDP). All five pathways also at least double existing electricity demand and incorporate a dramatic improvement in energy efficiency, meeting future demand with just 70-85% of present primary energy.
When it comes to the scenarios’ primary energy supply profiles, one can further see that all five scenarios completely eliminate coal power and derive at least as much energy from biomass as is currently derived from coal. Lastly, all five scenarios demand an accelerating deployment of solar and wind power between now and 2030. This equals approximately 60 GW of additional capacity installed each year for the next decade, compared to an historical peak annual installation of roughly 35 GW, achieved in 2020.
The scale of these energy investments can be hard to grasp when only dealing in GW and costs. That is why this model goes a step beyond many other recent energy system pathway studies by downscaling the national generation and infrastructure projections of the various pathways to an extremely high level of granularity. The result is a series of maps, such as the one shown in figure 3, showing the actual land footprint of the clean energy transition.
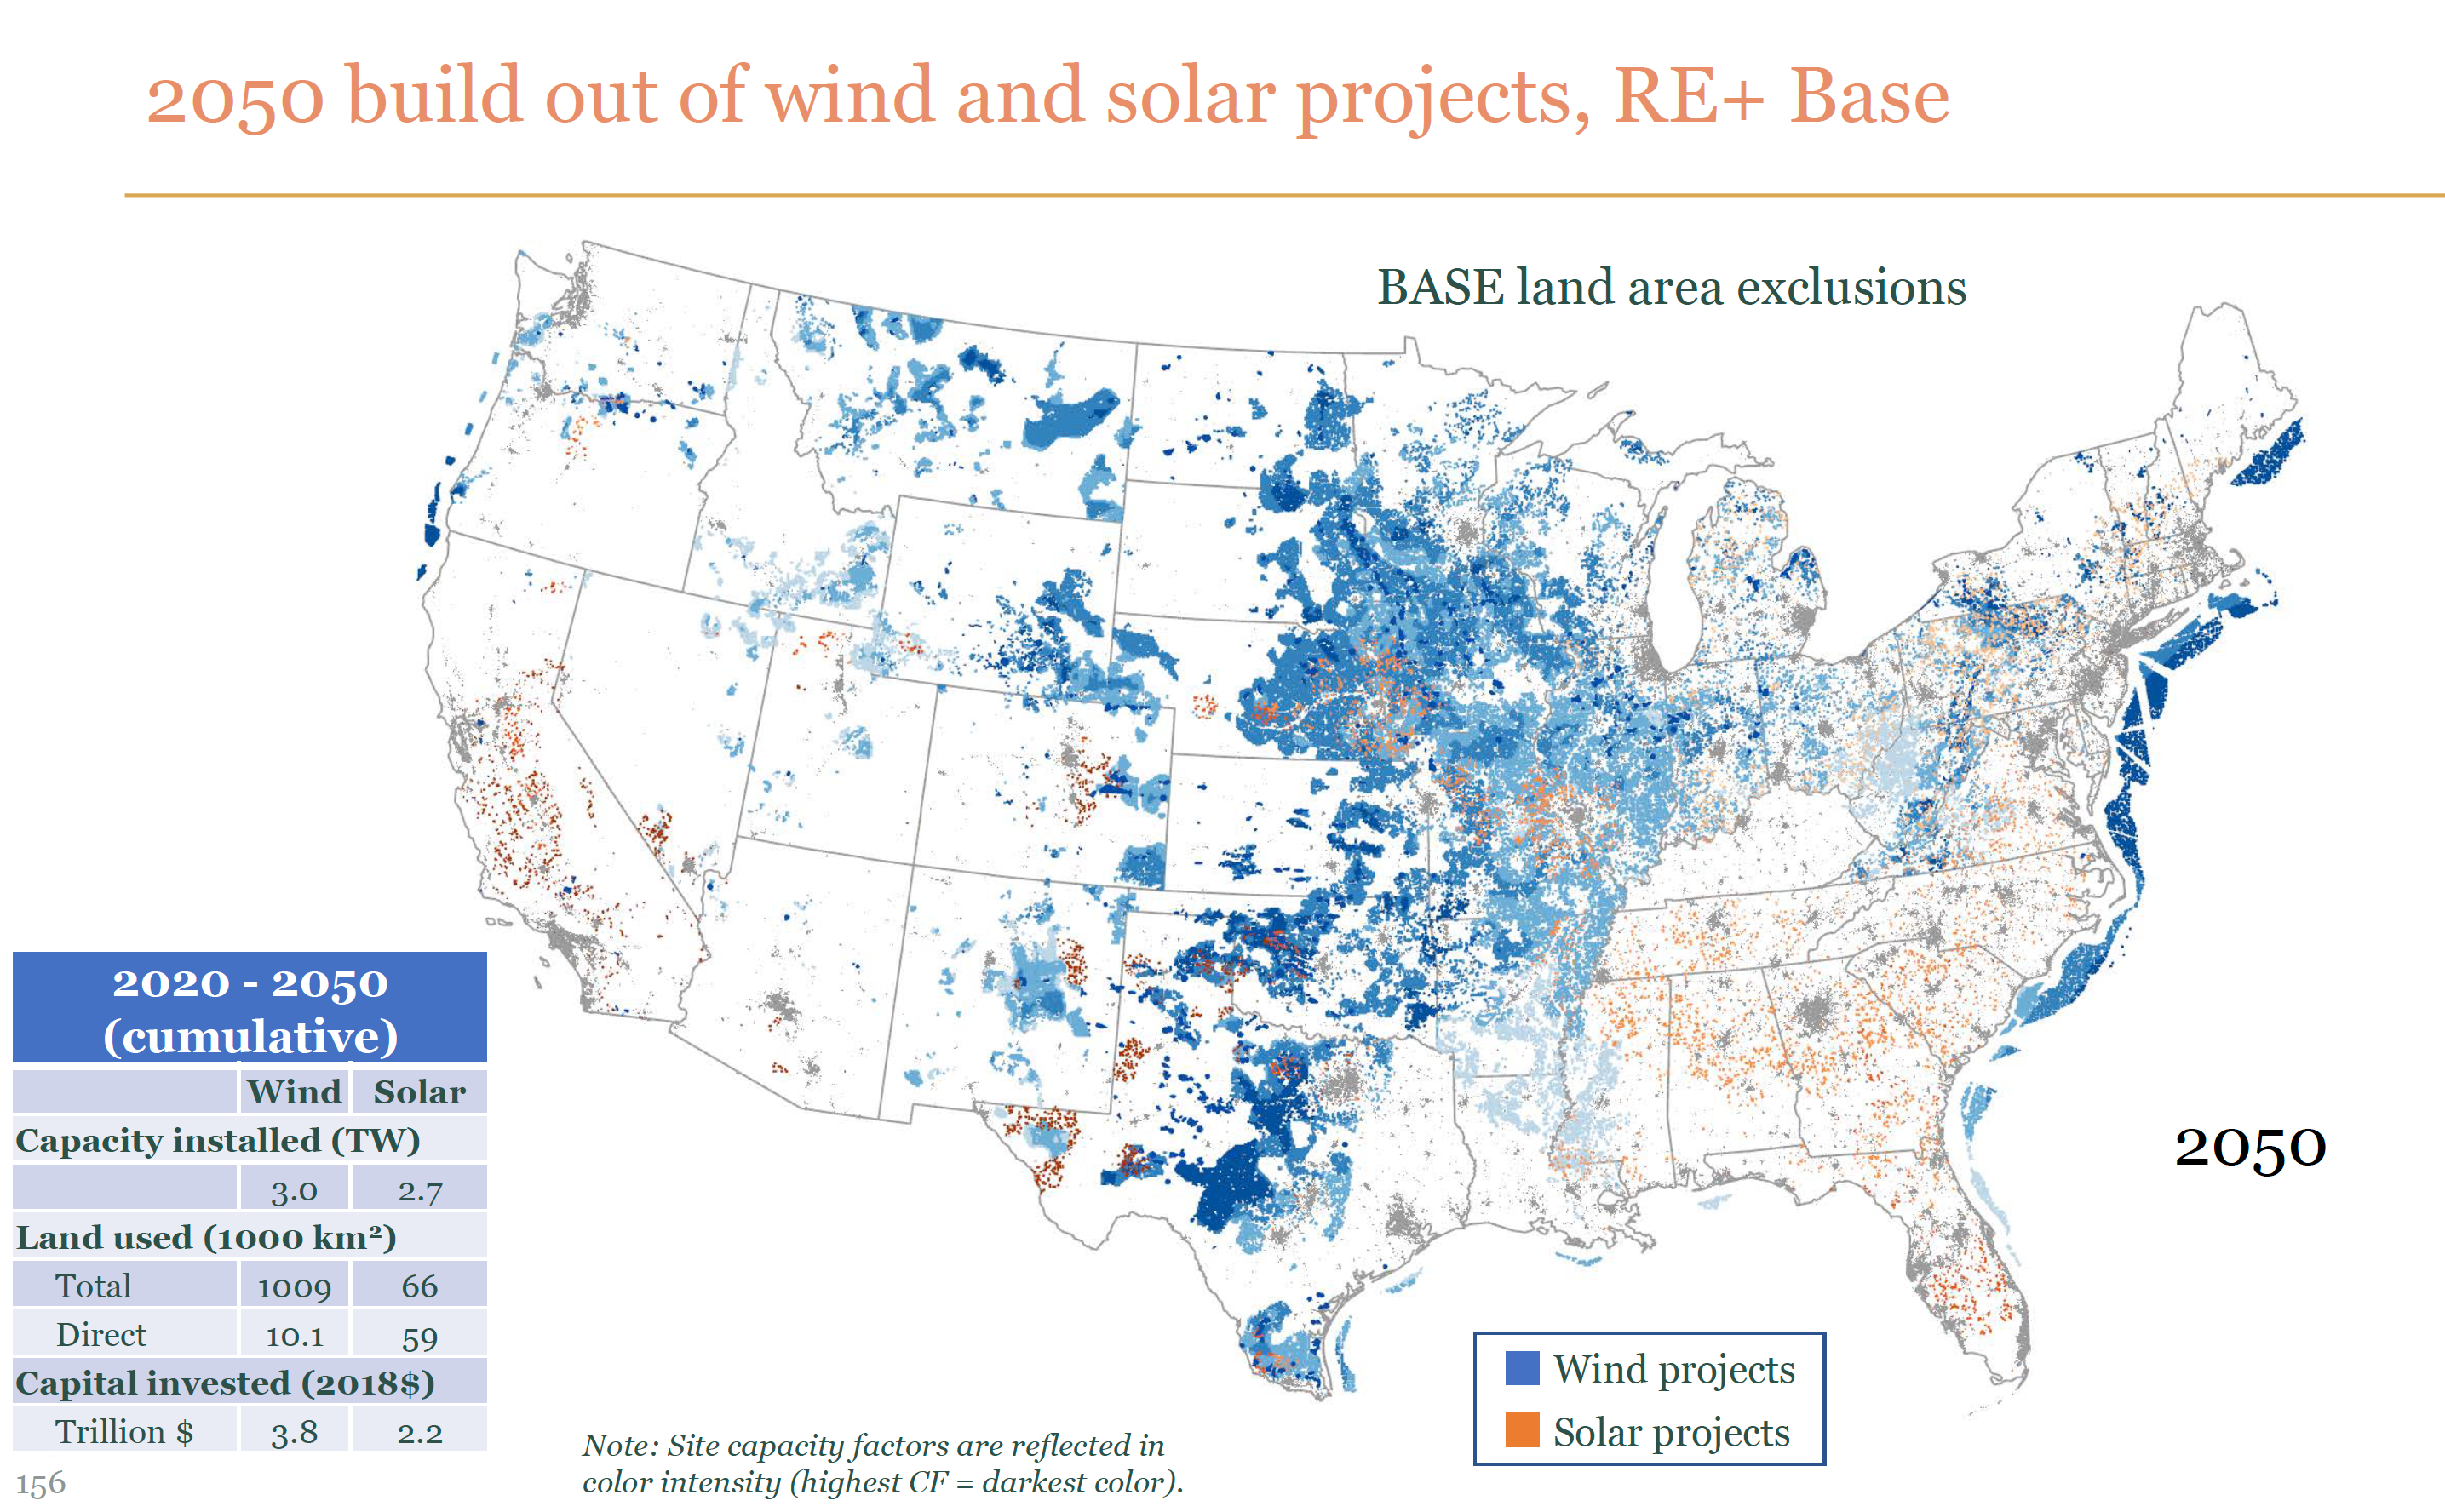
It is with visualizations like these that the true impact and ubiquity of the clean energy transition comes into focus, raising important questions about how this land use will affect communities around the country.
This, Jenkins stressed, is one of the important lessons coming out of this research: The siting of generation and supportive infrastructure will require a far more sophisticated approach than the ‘least-cost’ analysis undertaken by the Andlinger Center. “This is a first attempt” said Jenkins. “We get a sense of the initial trade-off space, but there is much more work to be done related to non-cost related objectives.”
The maps and model put forward by Princeton, and the statements by Jenkins, are a reminder of the enormous undertaking we have ahead of us, and why it is so critical that we get out ahead of markets and technology in planning how exactly we transition the US energy system to net-zero in time to preserve a stable climate.

Oscar Serpell
Deputy DirectorOscar Serpell oversees all student programming, alumni engagement, faculty and student grants, and visiting scholars. He is also a researcher, writer, and policy analyst working on research initiatives with students and Center partners.
