Cities Get Failing Grades for Air Quality
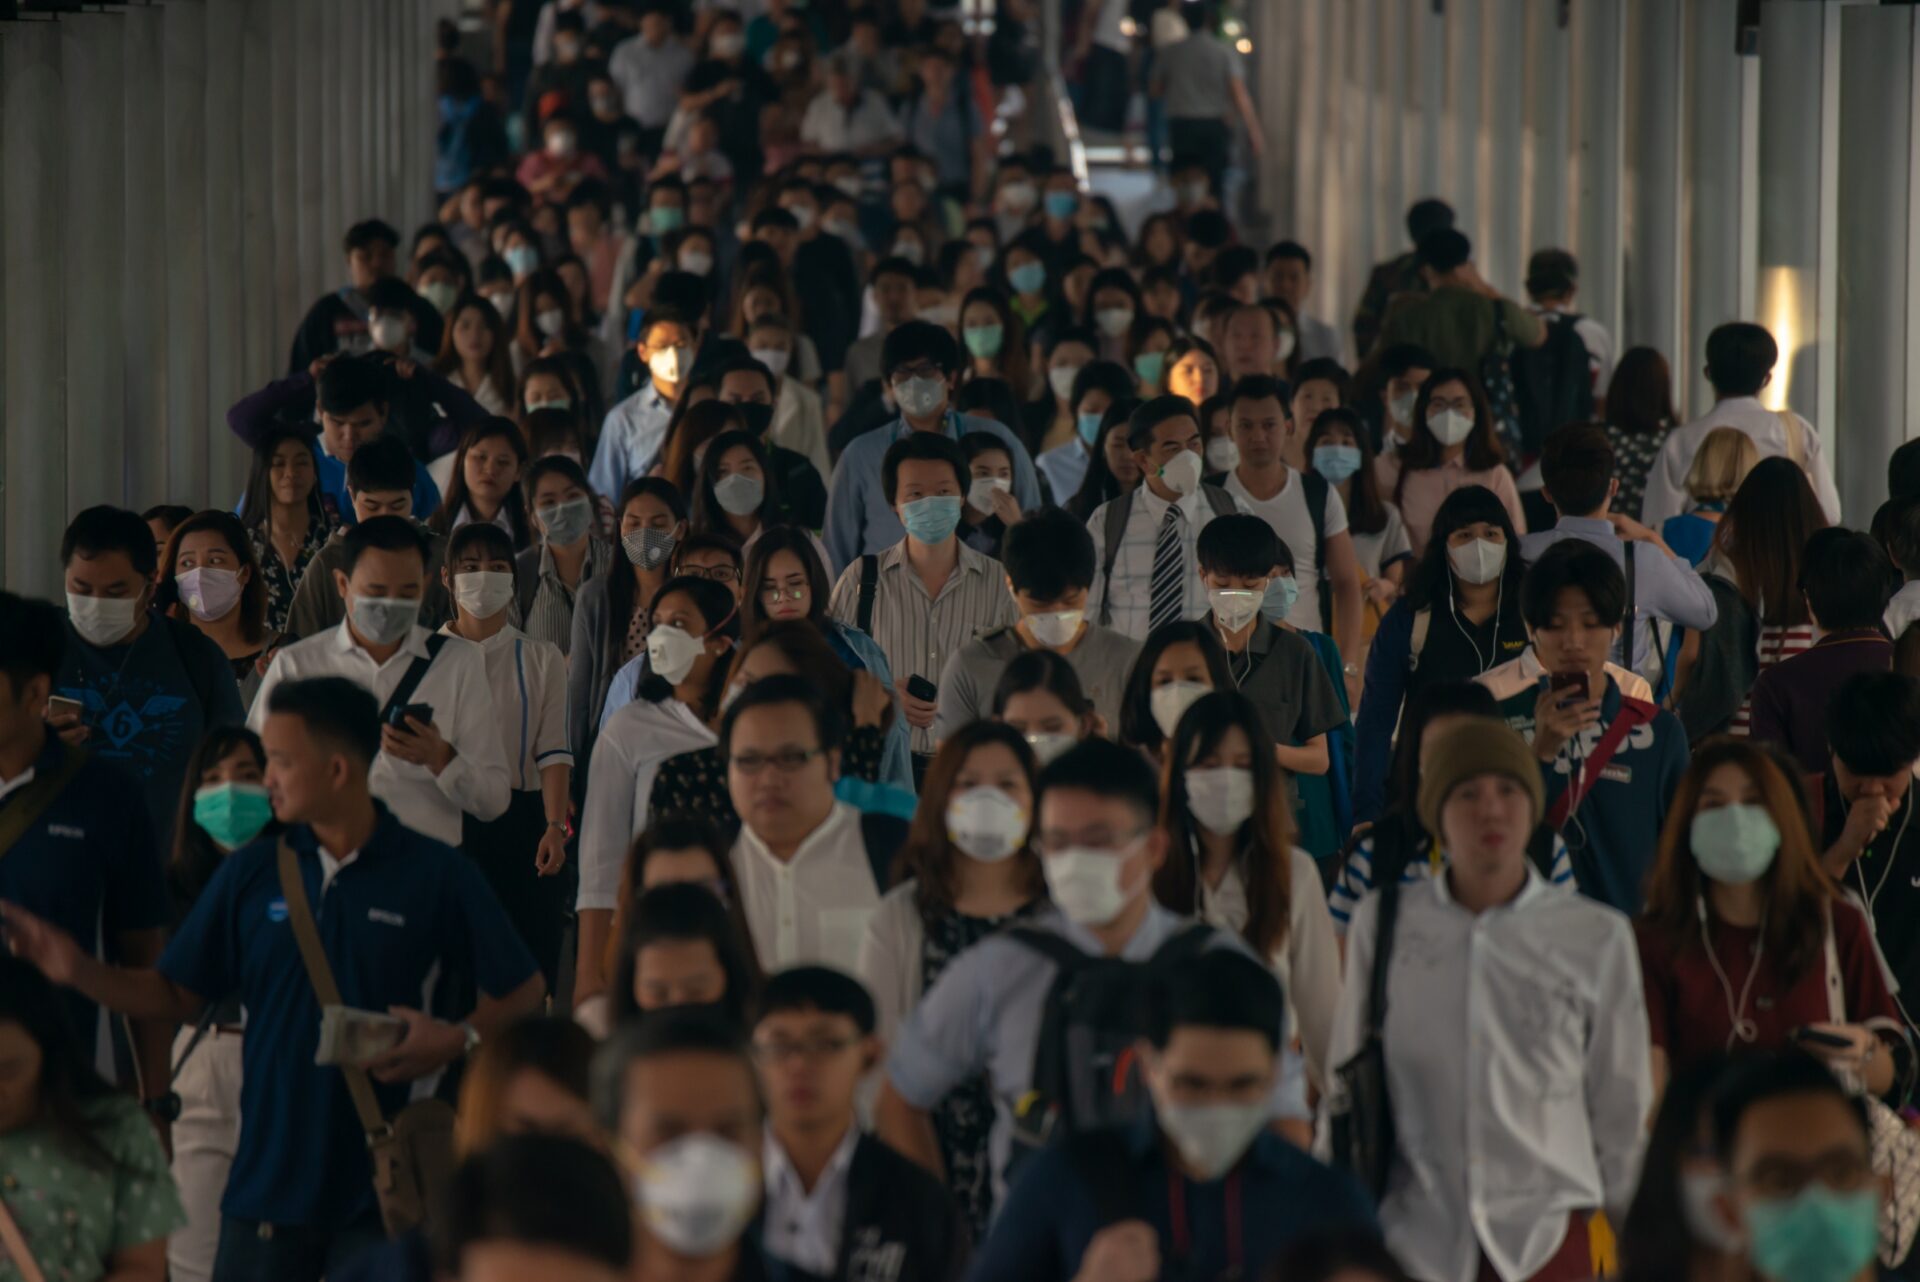
Nearly 4 out of 10 Americans live in counties that got an F for air quality last year.
All over the world, air pollution has been persistent for decades. But where does the U.S. rank in terms of air quality? More than 141 million Americans, or more than 4 in 10, live in counties that got at least one “F” for unhealthy air, according to the latest American Lung Association State of the Air report. This is an increase of 7 million from last year’s report.
The U.S. overall actually has some of the lowest levels of air pollution thanks to the Clean Air Act, which governs our quality of air, including the Department of Energy’s air pollution control activities. However, the worst air quality in the U.S. coincides with highly-populated city centers, according to the American Lung Association.
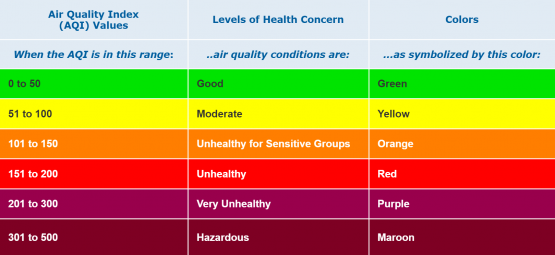
In order to decrease your risk for lung disease, air quality alerts can inform your timing for outdoor activity on days with better air quality. Levels of ground-level ozone, particulate matter, carbon monoxide (CO), nitrogen dioxide and sulfur dioxide are all measured to calculate the Air Quality Index (AQI). Some school districts now have guidelines to close school when air quality is at dangerous level.
In Philadelphia, the 2018 median AQI was 55 compared to the national average of 38. This is below average, but does it necessitate caution? In Sonoma county, 275 is the air quality threshold for recommending county school closures. This was decided in consultation with the county health director, along with guidance from the Centers for Disease Control and Prevention. Comparatively, a median of 55 seems like nothing.
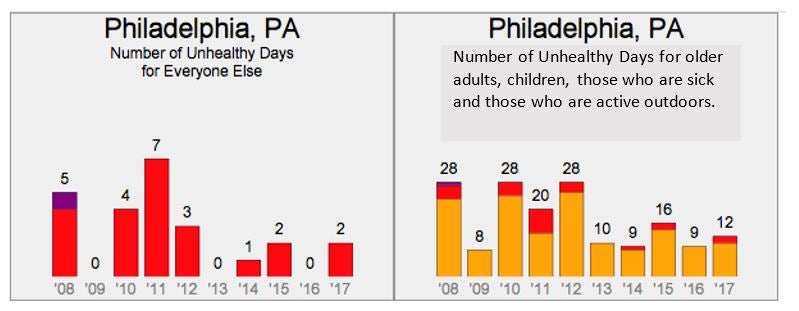
Graphical representation of annual unhealthy air quality days in Philadelphia. Via https://www3.epa.gov/aircompare/#groups
However, the American Lung Association ranking system goes more in depth than the AQI, with scores for number of high ozone days, year-round particle pollution, and short-term particle pollution. Philadelphia county barely passes the test for year-round particle pollution, received a B for short-term particle pollution, and fails the test for number of high ozone days.
Even within cities and counties, there are neighborhoods that have disproportionately more exposure than others to environmental pollutants. Chester, for example, is near the highway, the airport, and Philadelphia Energy Solutions (PES). A survey of 314 people who live in this neighborhood showed that almost 34 percent had asthma, whereas the asthma rate in the city is 19 percent and the national rate is 8 percent. Energy policy improves the emissions of PES would lessen this stratification.
Another factor that has contributed to Philadelphia’s failing ozone score is the heat. Climate change and increasing temperatures have been increasing ground-level ozone and the number of yearly high ozone days for the last few years. Philadelphia has made strides to address this through programs like Solarize Philly, which has made Philadelphia the 5th fastest growing solar market in the U.S. Going forward, Philadelphia could make more changes that improve air quality, including the transition of PGW to electric power and electrification of buses.

Tammy Ting
Doctoral StudentTammy Ying is an PhD student in cellular and molecular biology the University of Pennsylvania School of Medicine.
