Assessing Competitiveness of Philadelphia Energy Solutions
Recently, Philadelphia Energy Solutions asserted its refinery complex is not antiquated, but “state of the art.” Let's explore that claim with some real data.
Philadelphia’s own neighborhood refinery, Philadelphia Energy Solutions (PES), is serving as a catalyst for national debate between the ethanol and petroleum refining industries, blaming its bankruptcy on the Renewable Fuel Standard (RFS).
While I am not interested in entering the RFS debate, I do think it is important for the public and policymakers to understand the truth about the Philly refinery.
My previous blog series explored the basics of the PES bankruptcy, fact and fiction behind PES’ claim that the RFS drove it into bankruptcy, how PES investors prioritized stronger investments, and future challenges facing the refinery.
Recently, PES asserted its refinery complex is not antiquated and is instead “state of the art.” In this blog, I will put the state-of-the-art claim into perspective, using data.
Measures of Competitiveness
In terms of size—measured in atmospheric distillation capacity—PES is the 11th largest refinery in the country at 350,000 barrels per stream day. However, size is not a good indicator of competitiveness in the refinery business.
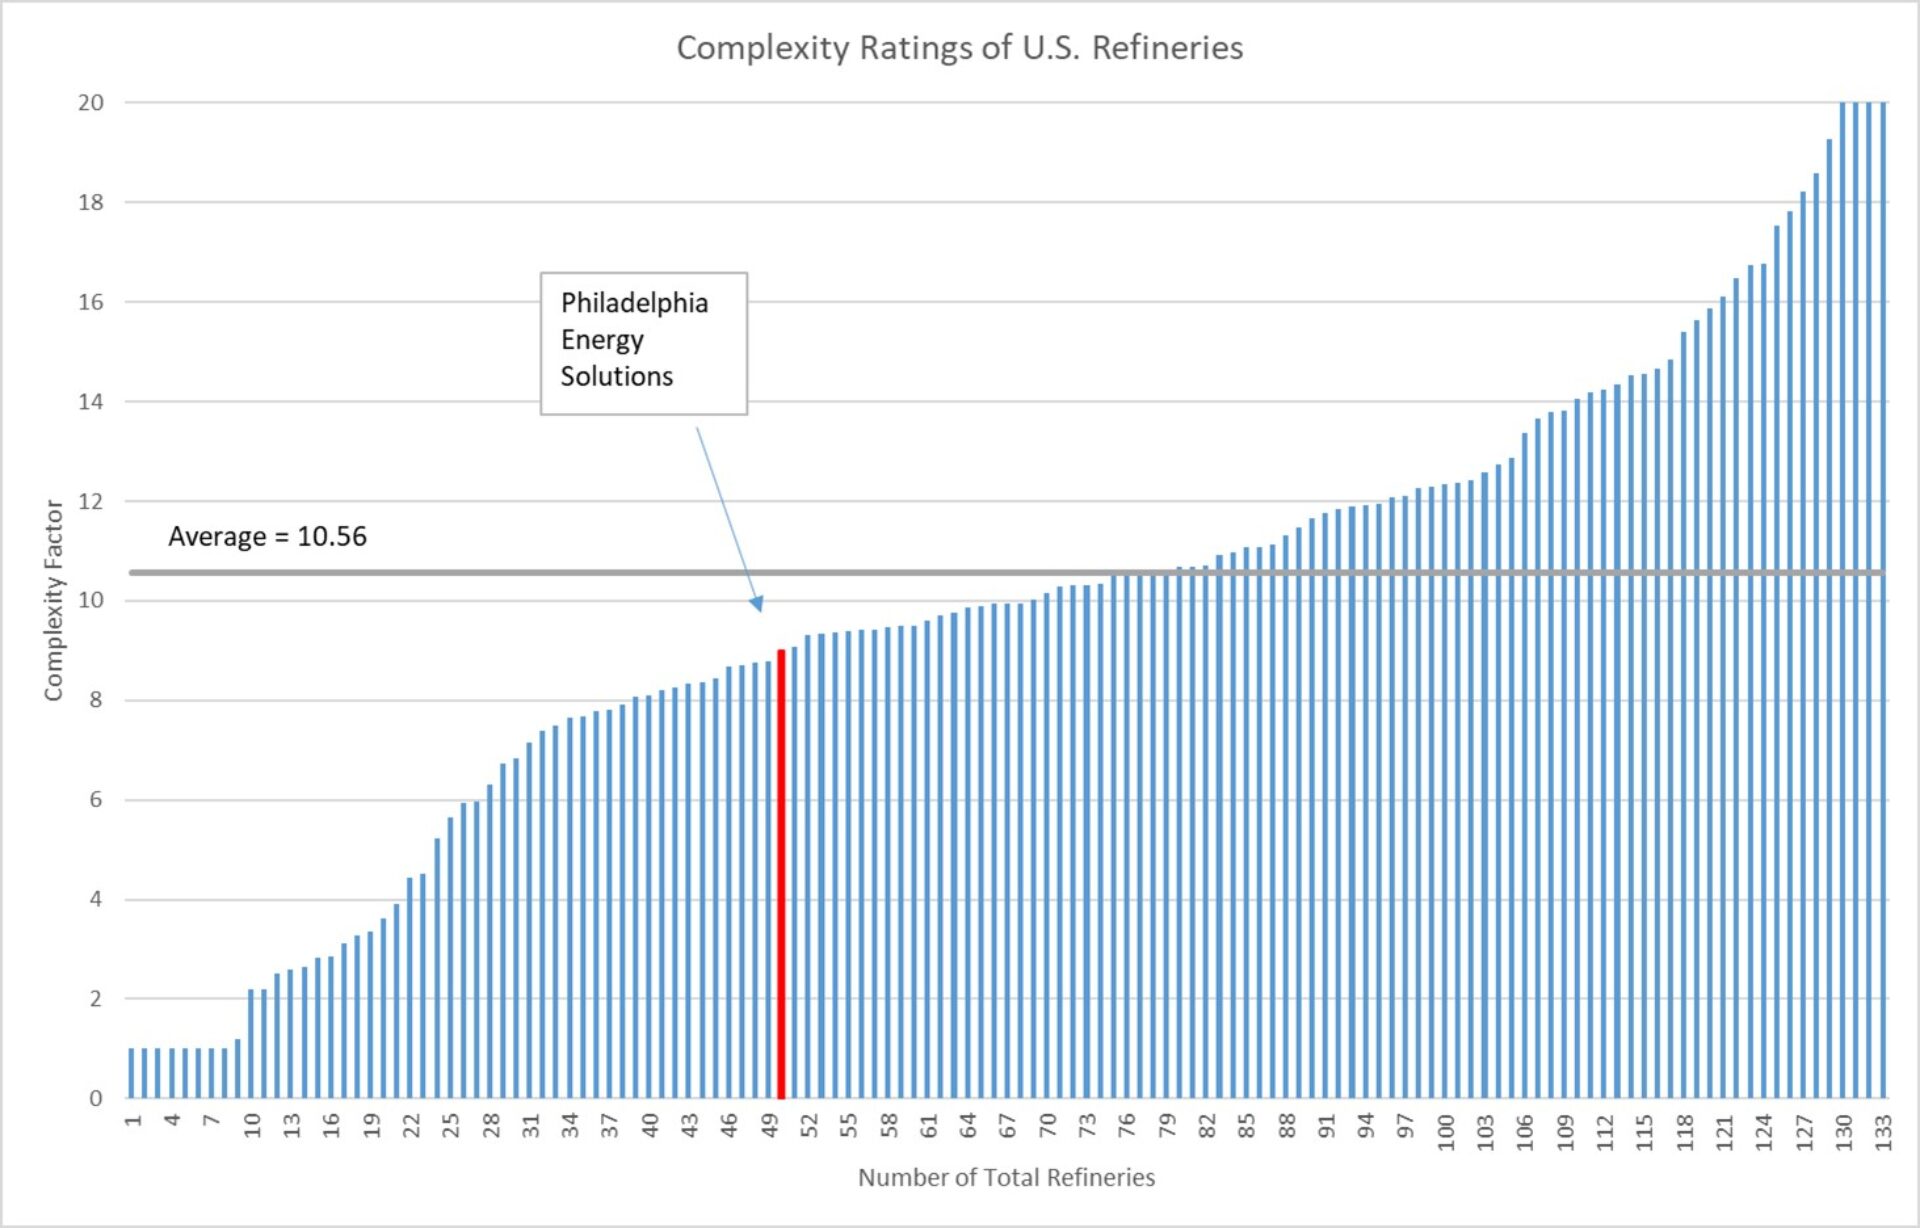
Complexity Rating. The complexity or sophistication of a refinery is based on its secondary conversion capacity, or plant equipment that enables production of high value products from lower value inputs. The Nelson Complexity Index was developed to measure and compare the complexity and costs of refineries. Using 2016 refinery data from U.S. EIA and unit complexity factors, Professor John Jechura of the Colorado School of Mines calculated complexity ratings for all 133 operating U.S. refineries. As shown in the lead in graphic, the complexity factor for PES was calculated at 9 (in red), which is well below the U.S. fleet wide average of 10.56. These data suggest PES is relatively simple compared to its competitors, indicating a reduced ability to convert low quality feedstock into high quality product. Said another way, PES is reliant upon higher cost, higher quality feedstock to operate.
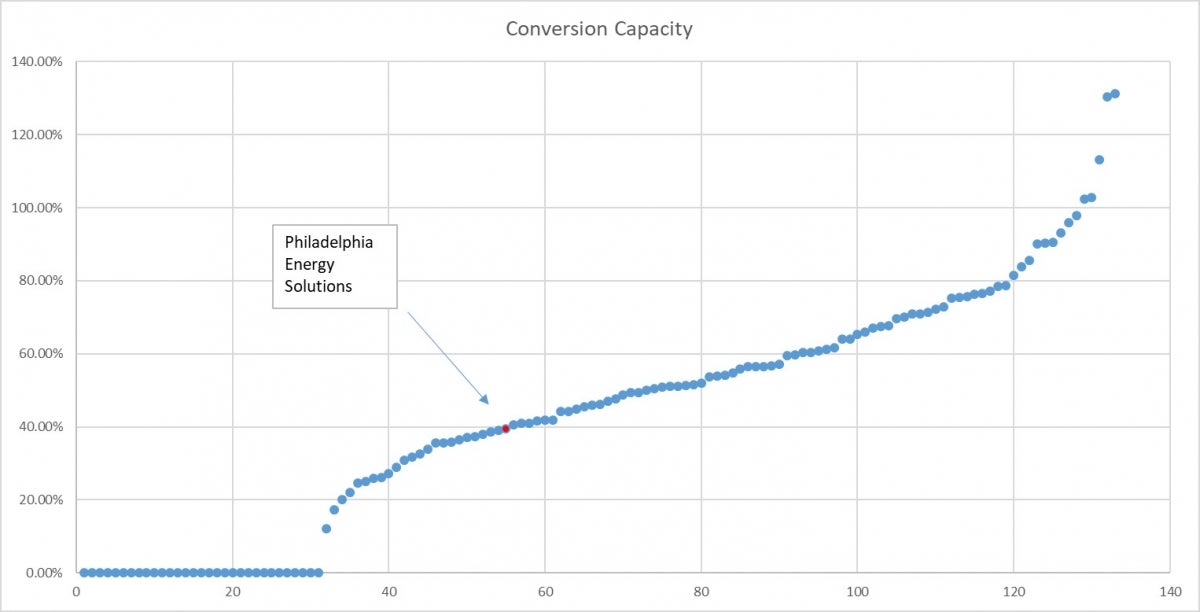
Conversion Capacity. Conversion capacity is the ratio of a refinery’s conversion units to its atmospheric distillation capacity, providing additional insights into the complexity and competitiveness of a facility. Using 2016 EIA data, I calculated conversion capacity by summing catalytic cracking, catalytic hydrocracking, and thermal conversion capacity and dividing by atmospheric distillation capacity. As seen to above, PES had a conversion rate of 39.29% (red dot), whereas the U.S. fleet average conversion capacity was 43.93%. The U.S. fleet average conversion capacity rate excluding topping and hydroskimming facilities (that have zero conversion capacity) is 57.28%. Note that conversion capacity can exceed 100% in some cases.
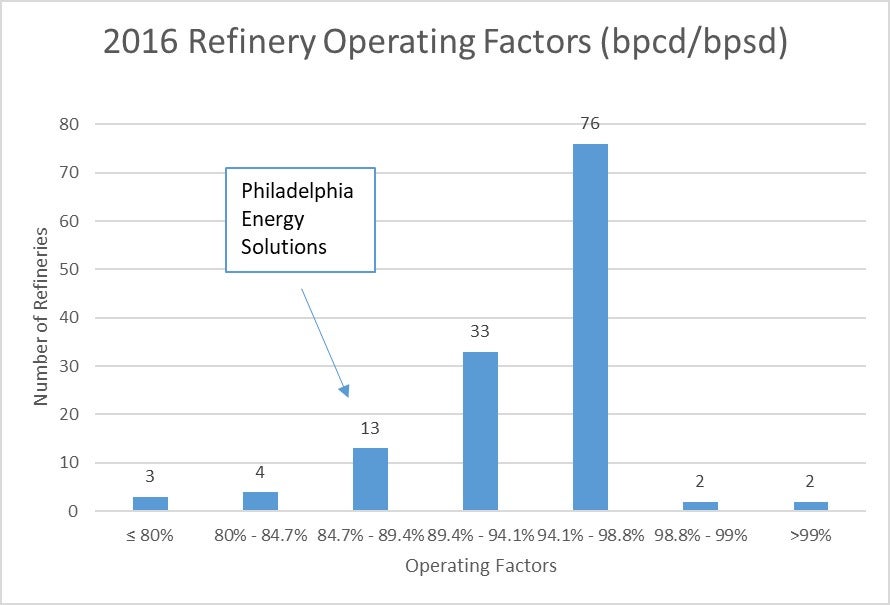
Operating Factor. The operating factor (also called an on-stream factor) of a refinery provides insights into the performance and economics of a facility. PES has a design capacity of 350,000 bbl per stream day (bpsd), but only a 310,000 bbl per calendar day capacity (bpcd). The calendar day number takes into account downtime for maintenance, repairs, equipment replacements, and other factors. Using 2016 EIA data, I calculated operating factors for all U.S. refineries. PES has an operating factor of about 88.6%, placing it towards the bottom of the U.S. fleet, as can be seen to the right. This low operating factor indicates the facility is not performing optimally, which can negatively and meaningfully effect the economics of the facility.
In summary, although PES is a large facility, it is rather simple compared to the rest of the U.S. fleet and has below average conversion capacity (limited to fluidized catalytic cracking). Together, these metrics help clarify the limits of PES technology, which are not able to convert low quality feedstock into high quality product. On top of this, the facility operates with a lot of costly down time.
So, the claim that PES is “state of the art” seems… well, wrong.
A Tightening Market
Unfortunately for PES, the refinery business has gotten more competitive. EIA data shows that between 2007 and 2016, sales of gasoline and distillate fuels—representing 85% of the product categories PES produces—on the East Coast (PADD 1) dropped 55% and 15%, respectively.
Meanwhile, while regional (and U.S.) demand for these fuels fell during this time period, overall U.S. refinery capacity actually increased by 6 percent.
Refineries in the Gulf Coast region steadily increased export of refined product during this time, while imports of refined product into the East Coast steadily declined.
These competitiveness metrics tell the tale of a below average sophistication refinery with some operational issues. Alone, these factors may not result in bankruptcy. But, layer on top of this being cut off from discounted high quality crude, massive capital O&M outlays and investments that didn’t pan out, crippling debt, and RFS compliance costs (that competitors also face, but may manage differently) and the Chapter 11 result comes clearly into focus.
Note: A more detailed publication on the Philadelphia Energy Solutions bankruptcy is in development.

Christina Simeone
Kleinman Center Senior FellowChristina Simeone is a senior fellow at the Kleinman Center for Energy Policy and a doctoral student in advanced energy systems at the Colorado School of Mines and the National Renewable Energy Laboratory, a joint program.
