Part 2: Philadelphia Energy Solutions Ch. 11 Fact and Fiction
The Philadelphia refinery says Renewable Energy Fuel Standard compliance costs were the source of its woes, but the real story is somewhere between tough luck and market realities.
Now that you understand some basics about the Philadelphia Energy Solutions (PES) business and bankruptcy, let’s examine if PES’ claims about the RFS being the primary factor driving the company into bankruptcy really make sense.
Increasing Renewable Fuel Standard (RFS) Compliance Costs. PES states the primary factor driving them into bankruptcy is RFS compliance costs. For context, RFS policy is generally objectionable to crude refiners, as mandates to increase the use of alternative fuels are likely to reduce sales of traditional refined petroleum products. So undermining RFS policy may seem attractive to this industry.
It is true that prices for renewable identification numbers (RINs) used for RFS compliance were generally very low (i.e. a few cents per RIN) prior to 2013—when the ethanol (E10) blendwall was reached—and have remained much higher than pre-2012 levels in the years thereafter.
However, one must note both merchant (i.e. standalone) and integrated (i.e. part of a larger supply chain company) refineries have RFS obligations and associated compliance costs, and they both recover their compliance costs through the market price of refined fuel.
Integrated refineries purchase and blend renewable fuel with their refined product to comply with the RFS. Here, the standalone RIN cost may or may not be tracked separately. Merchant refiners that don’t have blending capacity purchase standalone RINs. As a result, for merchant refiners, the RIN-based compliance cost is more direct and evident, via RIN market prices. In addition, the market for RINs is subject to pricing impacts from banking, speculation, and other activities that can increase costs and volatility.
Lost Access to Cheap Domestic Crude. Next, PES blames loss of access to cheap domestic crude. Between the time PES was formed in 2012 through much of 2014, West Texas Intermediary (WTI) priced crude was trading at a significant discount to Brent priced crude. The WTI discount eroded significantly in 2015 and 2016, but has been increasing in 2017 and 2018. As a result of a variety of factors (e.g. investments to reduce Midwest pipeline congestion, reduced domestic production volumes after OPEC failed to cut production, lifting of the oil export ban, etc.) PES gradually received less WTI supply. Then, when the Dakota Access pipeline project came online in 2017, PES was largely shut out from the supply of cheap domestic crude, forcing a return to more expensive Brent crudes.
Compressed Refining Margins. PES blames compressed gross refining margins (citing the Brent 2-1-1 crack spread) as the third of several factors driving it into bankruptcy. PES stated that for every $1 drop in the 2-1-1 crack spread, PES loses $110 million in annual revenues and cites a little over a dollar drop in the average crack spread from 2012 to 2017. (28)
However, PES comparing Brent-to-Brent crack spreads over this time period is not accurate, because PES was predominately reliant on WTI feedstocks (and therefore a WTI crack spread) through much of 2014 and into 2015. Average WTI 3-2-1 crack spreads were $10/bbl in 2010, jumping to $30/bbl in 2012, and by May 2016 average 3-2-1 gross refining margins year-to-date dropped back to a little over $15/bbl, more in line with historic levels. These ultra-high crack spreads were driven in part by cheap domestic oil resulting from a supply glut of new oil-shale production and insufficient takeaway infrastructure.
So, the 2012 investment in the historically unprofitable Philadelphia refinery came at the peak of a temporary margin boom period for some in the domestic refinery business.
Estimated Financial Impacts
Now, let’s put all this into context with some back of the envelop calculations.
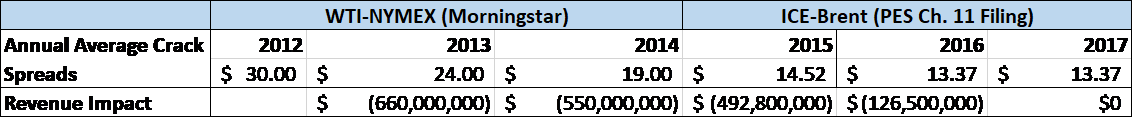
I assume PES was predominately reliant on WTI-priced supply from 2012 through 2015, and Brent for 2016 and 2017. I use the average annual WTI 3-2-1 crack spreads from Morningstar, and the average 2-1-1 Brent crack spreads that PES reports in its Chapter 11 filing. (28) I then multiply the proportional monetary increase or reduction in crack spread by $110 million (as PES states for every $1 reduction in crack spread they lose a $110 million in annual revenues).
As shown in this first table, this leads to a total reduction in revenues related to crude supply dynamics of almost $1.83 billion between 2012 and 2017. (Note the sum total 2012 to 2017 results are the same if the $14.52 average Brent crack is used for 2015.)
PES invested $750 million in refinery upgrades and another $130 million in expanding rail receiving capacity ($25 million of this capital investment was funded by PA taxpayers and is therefore subtracted from capital expenditures in the table below). PES also had to siphon over $616 million between 2012 and 2017 in the form of dividends, debt repayment, and advisory fees to equity investors. (22) In addition, there is the $832 million in RFS compliance costs.
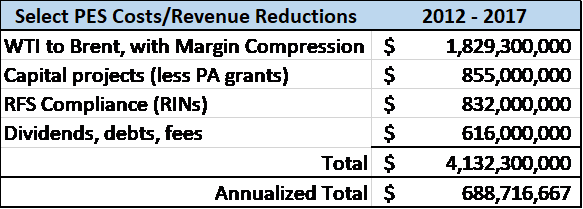
Hopefully, this second table presents a more accurate picture of the financial challenges facing PES.
The primary challenge facing PES is the attractive environment it experienced when Bakken crude was shut in and Brent was expensive, no longer exists. On top of that, WTI and Brent crack spreads have dropped precipitously, shrinking margins for all refineries. Next, PES management invested significantly in refining and went long on rail capacity, the latter of which is now largely underutilized. RFS compliance costs are high, but recall that all refineries—both merchants and integrated refiners—have to comply with the RFS.
Now that we have a more accurate sense of how these factors are stressing PES economics, the next blog post in the series will explore whether PES investors could have anticipated these challenges and what if anythings was done to manage these risks.
Note: A more detailed publication on the Philadelphia Energy Solutions bankruptcy is in development.

Christina Simeone
Kleinman Center Senior FellowChristina Simeone is a senior fellow at the Kleinman Center for Energy Policy and a doctoral student in advanced energy systems at the Colorado School of Mines and the National Renewable Energy Laboratory, a joint program.
