Why the U.S. Might Lift a Decades Long Ban on Crude Oil Exports

A 1975 crude oil export ban is costly to the domestic industry, potentially gives more power to the United States’ geopolitical foes, and could even artificially hold up the price of domestic gasoline.
The End of an Era?
The year is 1973. The Yom Kippur war rages in the Middle East and the United States makes a controversial decision to supply arms to its ally, Israel. To punish the U.S. for its involvement, the Arab members of OPEC (OAPEC) declare an embargo on sales of crude to the United States and the price for a barrel of oil quadruples from $3 to $12 per barrel. Though the embargo was lifted by March of the next year, the ramifications of this oil crisis have dictated energy policy in the United States for the intervening forty years.
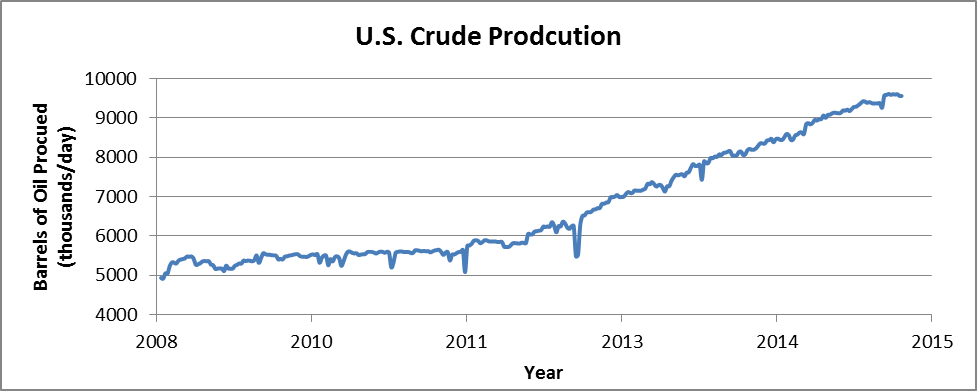
Chief among the relics from this dispute is the ban on U.S. crude oil exports established by the Ford administration in 1975, a part of the Energy Policy and Conservation Act1. While originally put in place to secure what politicians have termed ‘energy independence,’ and stabilize prices, crude oil export restrictions have become a stalwart of U.S. energy policy. With the renaissance in U.S. crude production through hydraulic fracturing of shale rock (see Figure 3), however, the logic of the export ban has recently been called into question.
Proponents of lifting the ban may soon have their chance. Senator Lisa Murkowski (R-AK), head of the Senate Energy and Natural Resources Committee, recently sponsored the Offshore Production and Energizing National Security Act of 2015 (OPENS Act) which would allow the unrestricted export of crude oil to nations not subject to U.S. economic sanctions2. The OPENS act was voted on and passed committee by a vote of 12-10 on July 30th, whether it continues through the legislative process to become law will have huge ramifications for American energy policy3.
A Haunting History
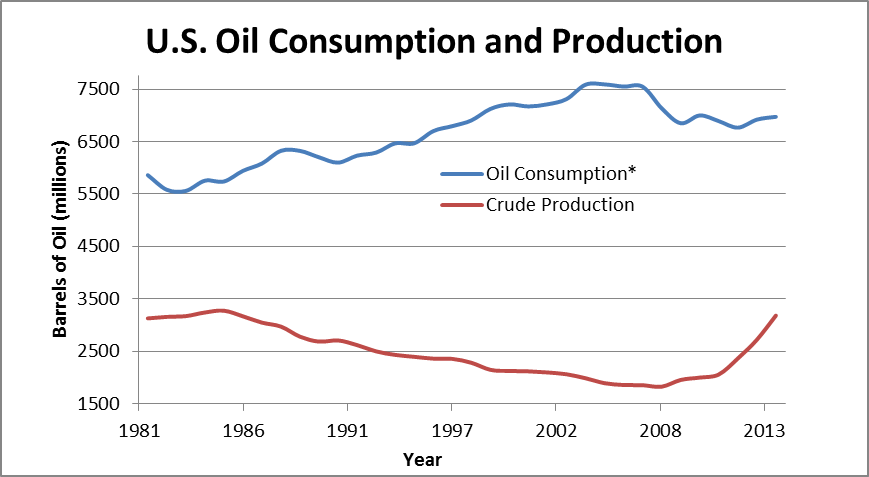
The original intent of the export ban was to reduce or eliminate imports from Persian Gulf producing nations and avoid another oil crisis such as that caused by the embargo of 1973. In the text of the law, the President is tasked with restricting the export of “petroleum… natural gas, and petrochemical feedstock” with exemptions to be made for the national interest (currently, exemptions are typically made for export to Canada in exchange for a similar amount of crude from that country, as well as for Alaskan North Slope crude)4. By ensuring domestic production was always consumed domestically, it was expected that the need for oil imports from the volatile Persian Gulf region would be limited. However, Americans’ appetite for energy consumption has historically far outpaced its ability to produce (see Figure 1) and imports have continued.
At the time of the embargo the United States was still an oil superpower. In 1973, production stood at over 9 million barrels per day (bbl/d), accounting for over 15% of global production and 1 million bbl/d more than Saudi Arabia. Despite being the top world producer, the United States’ impressive consumption meant it still relied on other major producers for imports. Among these, OPEC was dominant. In 1973, OPEC nations produced approximately 30 million bbl/d—over half of world oil production5.
Thus, when OAPEC declared an embargo, the United States was immediately cut-off from a sizeable portion of the international oil supply. Though the top global producer, the US was still importing 2 million bbl/d from OPEC and could not supply itself from domestic production.
Despite the best efforts of politicians, imports continued to rise for several years, reaching a peak of over 6.6 million bbl/d (5.6 million bbl/d from OPEC) in 1976—a year after the export ban was put in place6. As a tool to eliminate OPEC oil imports, the oil export ban clearly failed to serve its key purpose.
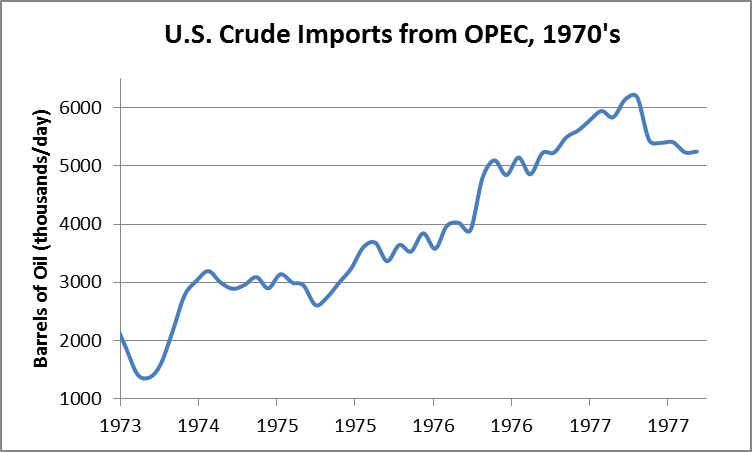
Source: http://www.eia.gov/dnav/pet/hist/LeafHandler.ashx?n=pet&s=mcrimxx2&f=m
The Rebirth of American Crude
The dynamics of the oil industry have changed dramatically since 1975 however—as have the relevant political concerns. U.S. oil imports reached a peak in 2005 at nearly 60% of consumption, but have since fallen to approximately 30% of consumption, only a quarter of which is from the Persian Gulf7. And while American’s appetite for oil is legendary, demand has also dropped from 2005 highs of nearly 7.6 billion barrels to 6.9 billion barrels for 2013 and 20148.
The reason for this drop in imports is illustrated in Figure 3. Domestic crude production has increased markedly since 2009, increasing from 5.3 million bbl/d in 2009 to 8.7 million bbl/d in 2014. This boost in crude production was accompanied by a dramatic increase in US natural gas production, a topic the Kleinman Center addressed from a local point of view in previous publications.
Such dramatic production increases have created a political climate which is far more open to the idea of crude oil exports, as evidenced by numerous senators and industry representatives speaking out in favor of removal of export restrictions. However, resistance still remains on several fronts.
Oil and the Environment
Thanks to the bump in domestic production, fear of a domestic oil shortage is no longer a valid critique of lifting the ban. However, politicians and the public have voiced concerns over the potential environmental impact of removing the export restrictions and the resulting increase in domestic drilling. These fears include climate change as well as uncertainty around the safety of offshore drilling and hydraulic fracturing.
Such environmental concerns will likely be a major partisan sticking point when considering the rest of the OPENS Act legislation; which also seeks to expand off-shore oil and gas exploration in currently protected areas off the Alaska coastline. The OPENS Act would also expand fff-shore drilling would also be expanded on the Outer Continental Shelf in the Gulf of Mexico. To counter-balance the potential environmental damage, some senators have indicated they would be willing to support the legislation if it could include provisions to continue or expand funding of renewable, non-carbon energy sources.9
Crude by Another Name, Not Quite as Sweet
On a more technical level, there are problems with the idea that all oil produced in the United States can be readily made in to finished products. The largest and third largest sources of US oil imports are Canada and Venezuela respectively, and much of the domestic refinery capacity was built around the assumption that imports would continue from these countries for many years to come. What remains crucial, however, is the type of oil these two countries produce. Both Canadian oil (some of it of the notorious ‘tar sands’ variety) and Venezuelan crude are known as ‘heavy oil.’ This more viscous product contains longer hydrocarbon chains with lower hydrogen content than ‘lighter’ crude. These heaavy oils require a different refinery process, and yield a different product range10. Much of the refining capacity within the United States, as well as the rest of the market infrastructure, is built to handle heavy oil.
Unfortunately for U.S. producers and refiners, the oil extracted from shale—responsible for much of the dramatic increase in domestic production—is of the ‘light’ variety. Whether oil is considered ‘heavy’ or ‘light’ is usually determined by its API Specific Gravity, a measure of oil density relative to water. Heavier oils have low API specific gravity and lighter oils have higher numbers. As shown in Figure 4 below, U.S. imports of light crude (high API) have fallen to historic lows, making up just 8% of crude oil imports in 20149. Notably, the decline began in 2007, when domestic production from hydraulic fracturing began to accelerate. The reason for the decline in light imports is clear: there is already more light crude available in the United States than can be handled by refining capacity.
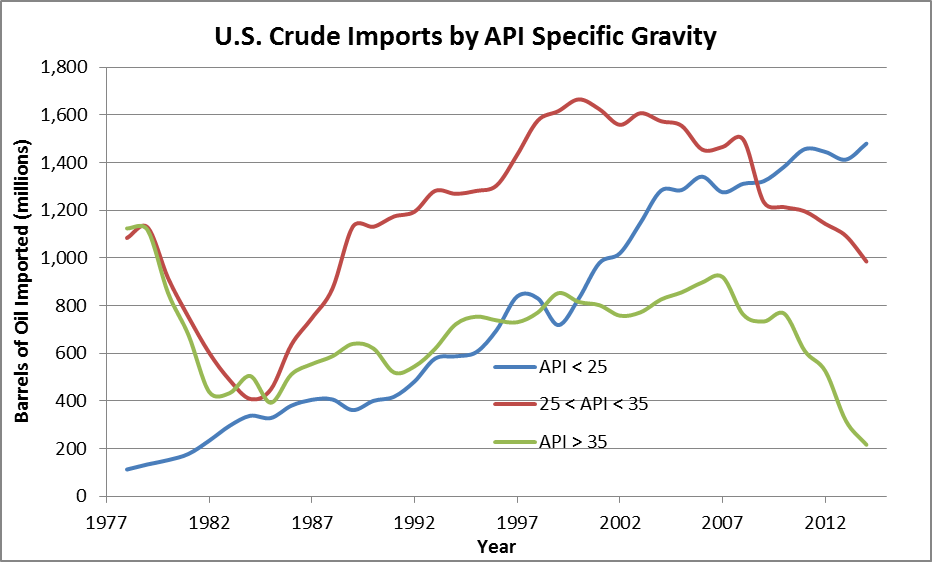
Source: http://www.eia.gov/dnav/pet/pet_move_ipct_k_a.htm
Refiners have desperately sought to expand capacity or retrofit refineries built to handle heavy oil, but such infrastructure cannot be built up overnight. The EIA prepared a technical report analyzing the options available to refiners and found that nearly all low-cost options had already been utilized, and further capacity expansion would require significant discounts on the crude price to make projects economical11. Such projects also have multiple-year timelines, while the need for capacity is now. Furthermore, the current, persistent, low oil prices make investment in new refining capacity an unlikely choice for refiners. Thus, producers are pushing to sell their oil overseas where there is more refining capacity available and where they can receive the full, global market price.
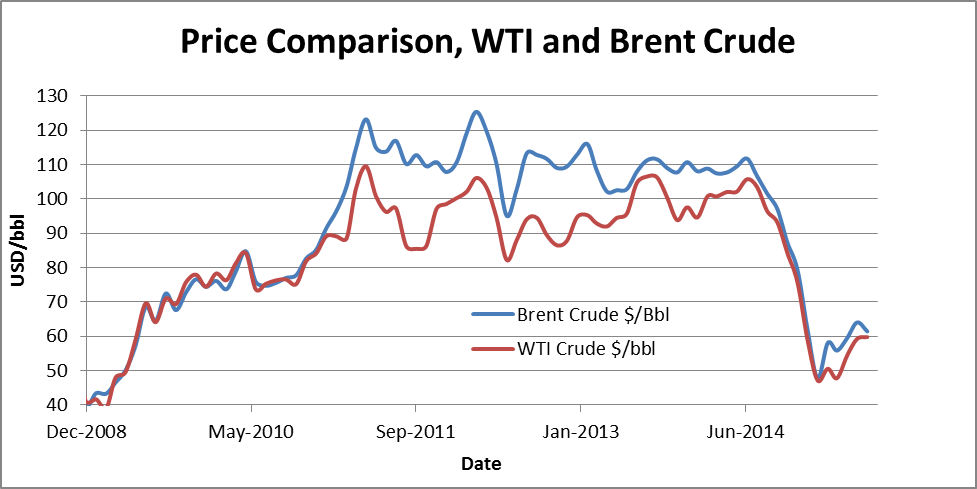
There is little doubt that there is room for light crude to be shipped overseas from the U.S. today. Future contracts for domestically produced crude are sold as West Texas Intermediate (WTI) crude for delivery to Cushing, Oklahoma. Oil traded as WTI is typically considered to be of a higher average quality than that sold on other markets. However, WTI contracts have been trading at a significant discount to Brent crude, the global benchmark market from the North Sea12. This discount is illustrated in Figure 5. The EIA predicts this discount could rise to and maintain levels as high as $10/bbl if export restrictions remain13. This is unfortunate, as the reverse had often been true. As a higher quality product, WTI typically earned a slight premium or traded at an equivalent price compared to Brent. The cause of the current discount was partly attributed to the glut in the U.S. market for light crude, according to the EIA14. The lifting of the crude oil export ban would, in theory, free suppliers of WTI to ship globally and bring the WTI and Brent benchmarks closer, meaning producers in the US would no longer be forced to sell their crude at a discount to the global market price.
The Geopolitical Oilfield
The initial decision to enact the oil export ban was geopolitical, aimed at curbing the influence and power of Persian Gulf producers. Today, the decision to remove the ban could also be seen geopolitically. Due to recent activity in Ukraine and the annexatioon of Crimea, the United States has moved to punish Russia with economic sanctions. European allies have had difficulty supporting the U.S. due to businesses lobbying against the sanctions. One can hardly blame them: Russia supplies Western Europe with much of its energy resources—including oil and natural gas—and is a major trading partner for most European countries. From this perspective, U.S. exports could in part replace Russian oil, putting pressure on the Russian economy without directly expanding sanctions or exacerbating tensions.
Furthermore, the recent diplomatic agreement with Iran has raised questions as to whether that state will have undue influence in the oil market if sanctions are lifted. Iran’s potential contribution to the world oil market is estimated to increase with the removal of sanctions15. Again, U.S. oil in the global market would serve to reduce the leverage and market power of other producers, even Iran. In regard, lifting the oil export ban would serve U.S. interests.
It’s the Economy!
The strength of the American economy is often the dominant factor in decision-making regarding energy policy. As previously mentioned, fears of scarcity and price hikes at the pump stayed lawmakers’ hands in the past from allowing crude to flow abroad. Recent research, however, may show that lifting the ban could be a boon to the domestic economy.
A 2014 study by the non-partisan Aspen Institute predicted numerous economic gains from lifting ban. Among them were a near 1% rise in GDP, 630,000 added jobs by 2019, and an average rise in household income of up to $3,000 by 2025. With gas prices low, it certainly seems the costs of a minor price increase may be more than offset by strong economic growth in the U.S.16.
Furthermore, fears of a gas price hike appear unfounded: a study by the EIA predicted unrestricted free export of crude oil would result in no increase—and potentially a decrease—in domestic gas prices. The study explained that with U.S. crude on the international market, global price benchmarks such as Brent Crude would fall, bringing domestic gas prices down with them17. The Aspen Institute study concluded similar findings.
When it comes down to it, the main concerns with removing the export restrictions are environmental. While not directly addressing the environmental concerns raised from expanded domestic production, increased funding for renewable energy seems a likely compromise. If the OPENS Act were revised to include such funding, the only remaining hurdle in Congress would be crude refiners concerned about the impact on their profit margins. The ban is costly to the domestic industry, potentially gives more power to the United States’ geopolitical foes, and could even artificially hold up the price of domestic gasoline. While the prospect of future oil embargos was real and frightening in the aftermath of the 1973 crisis, the integration and globalization of the world economy make exporting excess U.S. production an easy choice for lawmakers.

Dillon Weber
Research AssistantDillon Weber was a research fellow at the Kleinman Center and a graduate of the University of Pennsylvania majoring in chemical and biomolecular engineering and economics.
Additional Source:
Percentages of Total Imported Crude Oil by API Gravity. Washington, D.C.: US Energy Information Administration, 2015. http://www.eia.gov/dnav/pet/pet_move_ipct_k_m.htm
- Energy Policy and Conservation Act of 1975,Public Law 94-163, (1975): 103b.1.
[↩] - Offshore Production and Energizing National Security Act of 2015,(2015): 501. [↩]
- Committee on Energy and Natural Resources.”Murkowski Advances Legislation Cricial to Alaska’s Future.” 2015.http://www.energy.senate.gov/public/index.cfm/2015/7/murkowski-advances-legislation-critical-to-alaska-s-future. [↩]
- Effects of Removing Restrictions on U.S. Crude Oil Exports. Washington, D.C.: U.S. Energy Information Administration, 2015.http://www.eia.gov/analysis/requests/crude-exports/?src=home-b1 [↩]
- Monthly Energy Review/August 2015. Washington, D.C.: U.S. Energy and Information Administration, 2015.http://www.eia.gov/totalenergy/data/monthly/ [↩]
- U.S. Imports from OPEC of Crude Oil. Washington, D.C.: U.S. Energy Information Administration, 2015.http://www.eia.gov/dnav/pet/hist/LeafHandler.ashx?n=PET&s=MTTIMXX1&f=M [↩]
- Allowing Crude Exports could Reduce Consumer Fuel Prices, and the Size of the Strategic Petroleum Reserve should be Reexamined. Washington, D.C.: U.S. Government Accountability Office, 2014.http://www.gao.gov/products/GAO-14-807 [↩]
- U.S. Product Supplied of Crude Oil and Petroleum Products: U.S. Energy Information Administration, 2015.http://www.eia.gov/dnav/pet/pet_cons_psup_dc_nus_mbbl_a.htm [↩]
- Cama, Timothy. “Senate Panel Votes to Lift Oil Export Ban.” The Hill, July 30, 2015. http://thehill.com/policy/energy-environment/249804-senators-vote-to-lift-oil-export-ban [↩] [↩]
- U.S. Imports from OPEC of Crude Oil. Washington, D.C.: U.S. Energy Information Administration, 2015. http://www.eia.gov/dnav/pet/hist/LeafHandler.ashx?n=PET&s=MTTIMXX1&f=M [↩]
- Technical Options for Processing Additional Light Tight Oil Volumes within the United States. Washington, D.C.: US Energy Information Administration, 2015. http://www.eia.gov/analysis/studies/petroleum/lto/ [↩]
- “Price Difference between Brent and WTI Crude Oil Narrowing.” Today in Energy, US Energy Information Administration (June 28, 2013). http://www.eia.gov/todayinenergy/detail.cfm?id=11891. [↩]
- Effects of Removing Restrictions on U.S. Crude Oil Exports. Washington, D.C.: US Energy Information Administration, 2015. http://www.eia.gov/analysis/requests/crude-exports/?src=home-b1. [↩]
- “Price Difference between Brent and WTI Crude Oil Narrowing.” Today in Energy, US Energy Information Administration (June 28, 2013). http://www.eia.gov/todayinenergy/detail.cfm?id=11891. [↩]
- Villar, Leija. “Nuclear Accord Creates Potential for Additional Crude Oil Production from Iran.” Today in Energy, US Energy Information Administration (August 13, 2015). http://www.eia.gov/todayinenergy/detail.cfm?id=22492 [↩]
- Duesterberg, Thomas, Donald Norman, and Jeffrey Werling. Lifting the Crude Oil Export Ban: The Impact on U.S. Manufacturing. Washington, D.C.: The Aspen Institute, 2014. http://www.aspeninstitute.org/news/2014/10/14/lifting-crude-oil-export-ban-impact-us-manufacturing [↩]
- Effects of Removing Restrictions on U.S. Crude Oil Exports. Washington, D.C.: US Energy Information Administration, 2015. http://www.eia.gov/analysis/requests/crude-exports/?src=home-b1 [↩]
