Guaranteeing water access has been a constant challenge for California’s growing cities. Greater facilitation of water trading between agricultural and urban users can help policy makers to more efficiently manage this vital resource.
On April 1, 2015, in response to the dire conditions of the Sierra Nevada snowpack at the end of winter, Governor Jerry Brown of California issued an executive order that directed the State Water Board to impose emergency water restrictions.
The aim was to achieve a 25% statewide reduction in potable urban water usage—with water efficiency measures aimed at commercial, industrial, and agricultural users. To achieve this statewide goal, some cities had to reduce their water consumption by more than 40% (State Water Resources Control Board 2017). This massive cut was the culmination of a century-long effort to satisfy a growing population and economy in California with limited water resources (Hundley 2001).
The California Climate: Large Variations
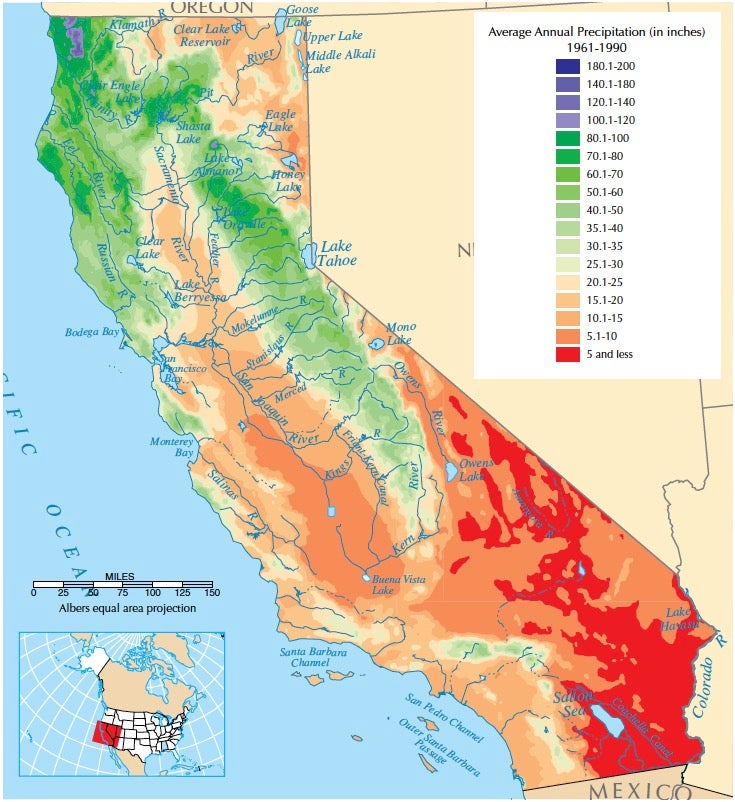
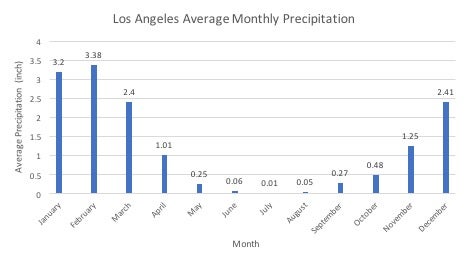
California is a large state with a correspondingly varied climate. As seen in Figure 1, some parts of the state are very wet, with close to 100 inches of average precipitation falling annually on its north coast. Southern California, however, is quite dry, with Los Angeles receiving less than 15 inches of rain per year and the Mojave Desert area to the east receiving less than 5 inches annually. This precipitation is also unevenly distributed across time, with the vast majority occurring over the winter wet season, shown in Figure 2.
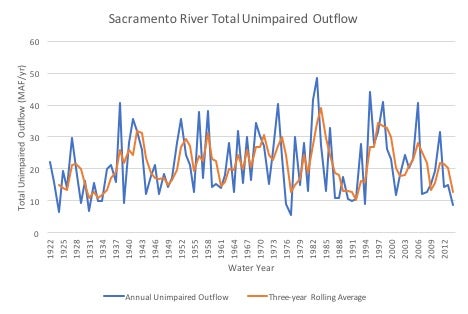
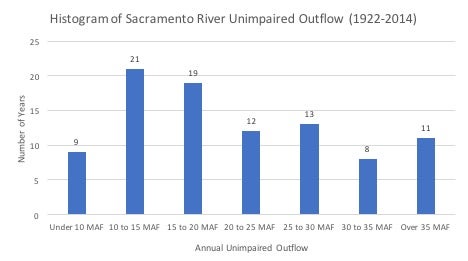
In addition to regular spatial and seasonal variations, California also experiences large year-to-year variations in the amount of precipitation it receives. Figures 3 and 4 show large variations in Sacramento River unimpaired runoff, which is the runoff the river would have had without water storage and diversion projects. It is highly correlated with total precipitation, and shows that runoff could change by more than a factor of 4 from year to year. Furthermore, multi-year periods of extreme wetness or dryness occur periodically—the droughts of the early 1930s and the drought from 1987 to 1992 feature prominently on the graph. Despite scientists’ best efforts at predicting droughts, these swings are typically not predictable more than one year in advance (http://drought.unl.edu/DroughtBasics/ PredictingDrought.aspx).
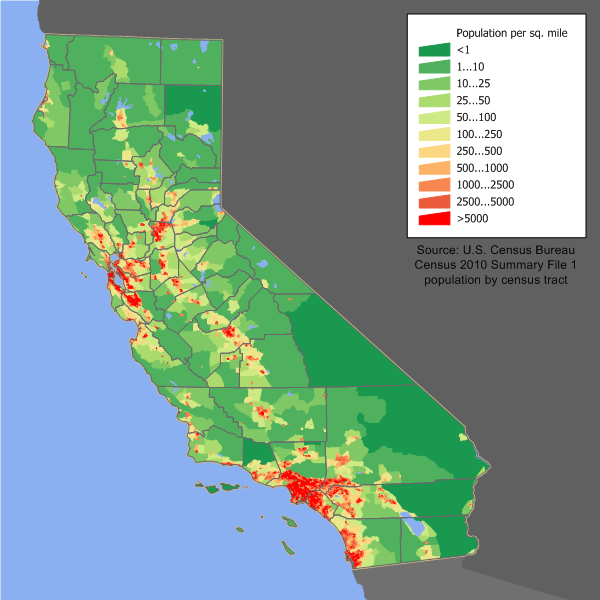
These large climatic variations create tension between the limited and varying water supplies and the water needs of a growing economy and population. Furthermore, the large population centers (Los Angeles and San Francisco Bay area) are located away from the wettest parts of the state (see Figure 5). Historically, Californians have responded by storing water from the wetter areas and moving water to the densely populated drier areas. This is the subject of the next section.
Large-scale Water Storage and Diversion
While the early settlers could use locally available water to satisfy their needs, the cities and towns of California grew so quickly in the 19th and 20th centuries that they outgrew locally available resources. To satisfy the growing water needs of thirsty cities and towns, policymakers across the state sought to divert water from remote areas and bring them to their local areas, because, as in the words of William Mulholland, superintendent of the Los Angeles Department of Waterworks and Supply from 1902 to 1928, “Whoever brings the water brings the people” (Carle 2015).
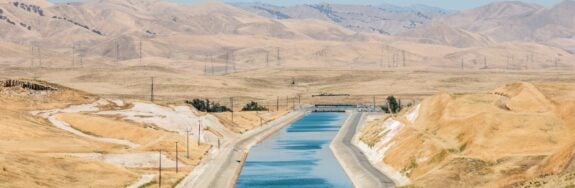
Los Angeles started the trend of diverting water from outside local drainage basins to satisfy local needs. The Los Angeles Aqueduct was built between 1908 and 1913 to divert water from the Owens River 200 miles away, in the Owens Valley basin (LADWP 2013). Coupled with a few extensions built later, the Los Angeles Aqueduct delivered more than 400,000 acrefeet of water annually to Los Angeles in the 70s and early 80s, guaranteeing 70% of the city’s water supply. In other words, the Los Angeles Aqueduct provided enough water to satisfy all the needs of the city’s residential water users (LADWP 1991).
San Francisco and other towns in the Bay Area followed suit by building their own water diversion projects (Hundley 2001). Other major projects built during the 20th century include the Colorado River Aqueduct, which brings water from the Colorado to Southern California’s thirsty cities, and the State Water Project, built in the 60s and 70s, which stores and transfers water from the Feather River Basin in Northern California to Southern California. Today, they supply two-thirds of Southern California’s total water needs (Hundley 2001).
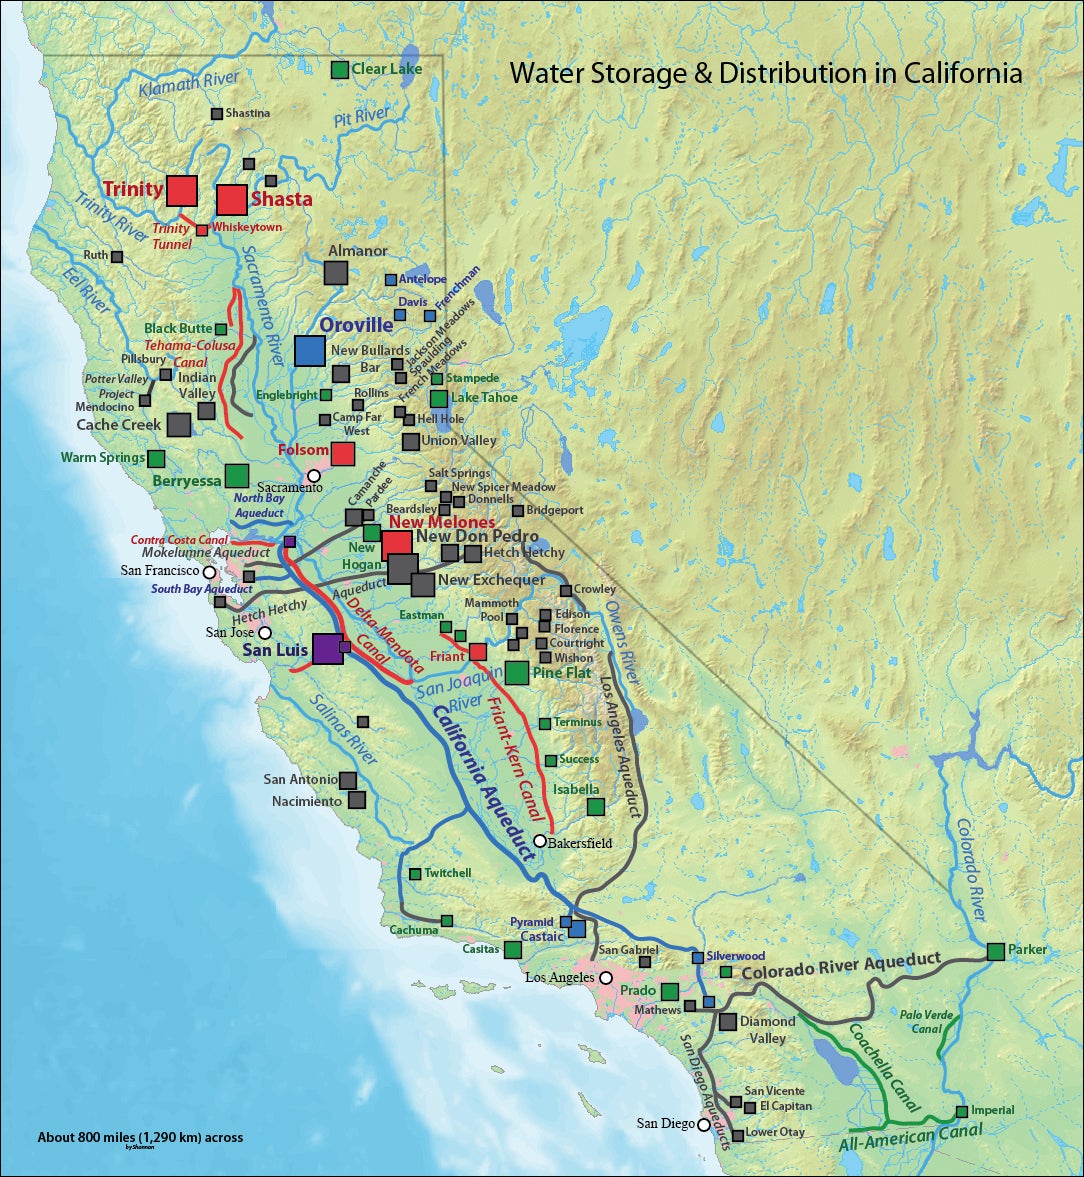
Figure 6 shows a map of California’s current water infrastructure. In total, there are more than 1,400 dams dotted across the state, including more than 100 reservoirs with capacity larger than 50,000 acre-feet, covering more than 90% of all rivers (DWR 2017b). However, no new on-stream dam has been built since 1980 because of growing environmental concerns. In 1983, the California State Supreme Court first applied the public trust doctrine to limit the amount of water that can be taken out of a natural ecosystem, which states that “no water can be taken from a stream, lake, or other natural source without a careful assessment of the harm that might be done. The state can allow the use of water by cities and others, but in doing so it does not surrender all interest in the water; rather, it retains an interest in trust for the public” (Hundley 2001). Consequently, Los Angeles had to forego almost 70% of its original water rights in Mono Lake, a closed drainage lake in central California—agreeing to export only 30,800 acre-feet versus more than 100,000 acre-feet. Similar rulings capped the amount Los Angeles can export from the Owens Valley itself (Hundley 2001).
Los Angeles partially replaced the water it lost by demanding more water from the Colorado River and the State Water Project. This exacerbated competition with other cities for these same non-local supplies. Consequently, over the past three decades, Los Angeles and other jurisdictions increasingly turned to demand management to provide enough water for California’s vast and growing urban landscape. And now the era of water conservation is upon us.
Water Conservation
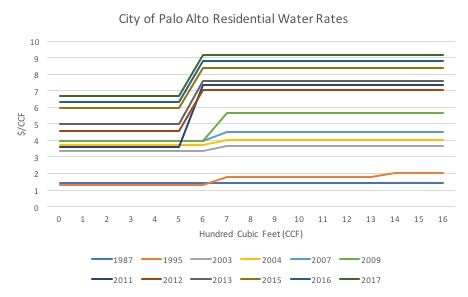
Water pricing is one lever that California cities have used to manage demand. As Econ 101 would tell us, a higher price yields a lower demand, everything else being equal. Around 70% of urban water use in California is residential water use, commercial and government entities account for 25%, and industry represents 6% of total water use (Pacific Institute 2014). Before 1980, many jurisdictions sold water to households at a volumetric discount, so that the more one bought, the cheaper its per-unit price. Over the past three decades, most cities have transitioned into a reverse, or increasing block rate structure, where the marginal cost of an additional unit of water gets more expensive the more one buys. (Figure 7 shows the residential rate structure in the city of Palo Alto over time.) In doing so, California’s cities are trying to strike a balance between wasteful use and essential use. While a high price discourages heavy use, it must not be so high as to prevent low-income families from essential water use such as drinking, washing, showering, etc. (City of Palo Alto 1995).
However, the usage of increasing block/tiered pricing has recently been challenged in court. More than 80% of California’s municipal water use is provided by public utilities (Carle 2015), and Proposition 218, which was passed in 1996, established a limit on public utility revenues. The proposition states that water rates must “not exceed the funds required to provide the property-related service.” In 2015, a California appeals court found tiered pricing in the city of San Juan Capistranoto be unconstitutional, as “above-cost-of-service pricing for tiers of water service is not allowed by Proposition 218 and in this case, [the city] did not carry its burden of proving its higher tiers reflected its costs of service” (Stevens 2015).
Faced with this constitutional requirement, many municipal water utilities have also used non-price mechanisms to manage demand. These measures can generally be classified into two types: short-term emergency curtailment measures, and long-term technological programs that produce permanent reductions.
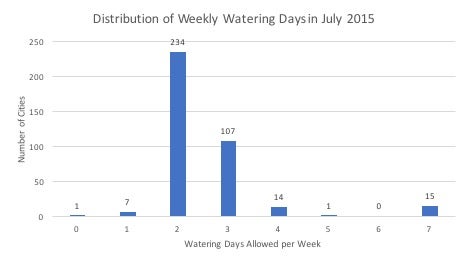
Since 1991, toward the tail end of the 1987-1992 drought, large- and medium-sized California cities have been required to produce a Water Shortage Contingency Plan that details the emergency measures they plan to undertake (LADWP 1995). Because outdoor landscaping irrigation accounts for about half of overall residential usage, (ConSol 2010) one popular measure has been to limit the number of days outdoor irrigation is permitted per week. (Figure 8 shows the number of jurisdictions by the number of days in a week where outdoor watering is permitted during the drought.) Another reason to restrict outdoor watering is because of its enforceability. It is an activity visible from the street, and cities have stepped up water policing and imposed large penalties for violations. These short term restrictions have been effective, as California’s cities reduced summer 2015 water usage by more than 25% compared to the same months in 2013 (SWRCB 2017).
At the same time, long-term incentive programs encourage households to replace their turf with more drought resistant landscaping, reducing outdoor water demand permanently. To reduce indoor use, both municipalities and the state government have set and gradually raised minimum water efficiency standards for toilets, shower heads, and other household fixtures in newly constructed homes (DWR 2017c). At the same time, they offered incentive programs for replacing inefficient fixtures in existing homes (LADWP 2015, MWDSC 2015). Similar requirements and incentive programs were implemented for washers and other household appliances as well. According to the Los Angeles Department of Water and Power, by 2010, these long-term water restrictions have reduced water usage 30% below baseline long-term projections, saving more than 200,000 AF per year (LADWP 1990, 2010).
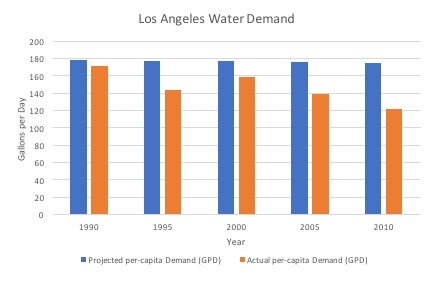
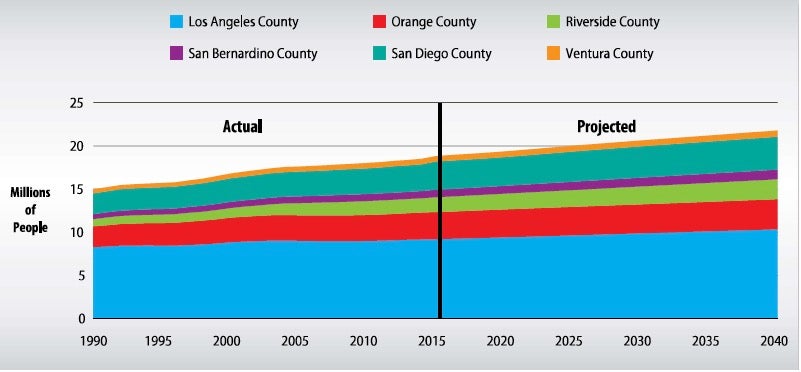
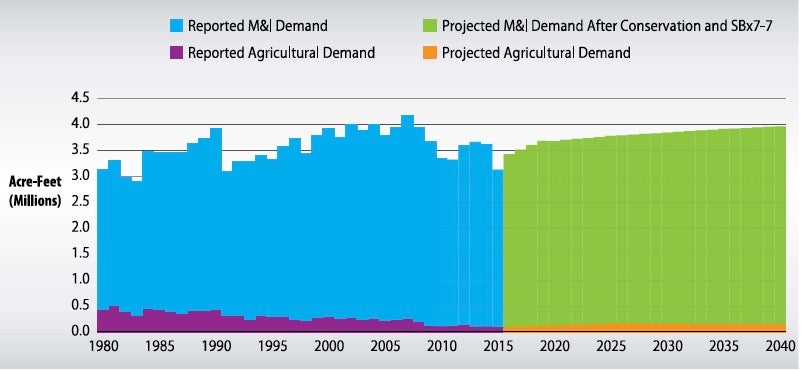
All the price and non-price measures have cut the historical link between growing population and economy with growing water usage. Indeed, as Figure 10 and 11 show, even as the population of southern California has grown over the past three decades, its total water use has fallen over that period. Furthermore, the state has set an ambitious goal of cutting per capita water use 20% below the 2009 average by 2020 (DWR 2017b). However, conservation measures will ultimately reach a limit, because essential water use cannot be cut to zero. Therefore, policymakers need to go back to the basics and explore a potentially more efficient allocation of water across the state for a more sustainable future.
Water Rights and Water Markets
One potential avenue for encouraging more efficient water use is through water markets, where sellers transfer their water rights—for a price—to buyers who value it more. Under California’s “first-come, first-to-right” water rights system, water right seniority is based on the time of first beneficial use (Hutchins 1956). Furthermore, senior right holders can use up their entire allocation before junior holders can get their share. Historically, agriculture was the largest industry in the state in the 19th century, which means that agricultural users tend have senior water rights over towns and cities. Consequently, while urban users had to restrict their water usage during severe droughts, senior agricultural water right holders could water their crops as usual (Guo 2015). This results in relatively inefficient use, because the value of water in agricultural production (estimated to be $2/hundred cubic feet (CCF) in Howitt et al. 2015) is lower than the price paid for water in urban areas, which is at least $4/CCF in San Diego, for example (San Diego 2017).
Short of reforming the entire water rights system, California has encouraged water trading in both the long and short run as a mechanism to allocate water more efficiently, for water to go from lower-valued agricultural use to higher-valued municipal and industrial use. Given that agriculture represents around 80% of total water use versus 20% for urban usage (Pacific Institute 2014), and that urban water valuations are 80% higher than agricultural water valuations on average (Hagerty 2017), there are many opportunities for trading. Indeed, over the past three decades, many long-term agreements that have been concluded, such as the agreement in 2003 for Palo Verde Irrigation District to sell 111,000 acre-feet of its water to the Metropolitan Water District, over a period of 35 years. However, after a period of rapid growth in the 1990s and early 2000s, the amount of water transferred has stagnated, due to both regulatory barriers and physical limits to water transfer (Hanak and Stryjewski 2012).
Alternative Water Sources
Given limits to water trading and water conservation, California’s cities have been exploring alternative unconventional sources of water supply. Water recycling and reuse is one potential source. Recycled water is wastewater treated to a much higher quality standard than normal wastewater, which is then put back into specially marked water pipes for reuse for specific purposes. Recycled water in California has been cleared for non-potable uses such as groundwater recharge, agricultural and landscape irrigation, industrial use and creating a barrier against seawater intrusion. Despite its varied uses, recycled water usage has barely increased between 2009 and 2015, going from 669,000 AF to 714,000 AF (Balgobin and Pezzeti 2017). The major headwinds continue to be a negative public perception of recycled water, which could potentially be improved by better public education and awareness campaigns.
A second unconventional water source is desalination, which is the energy-intensive process of producing fresh water from salty seawater. Given cheap and abundant energy resources, desalination can theoretically produce a reliable and unlimited water supply. Indeed, the cities of Carlsbad and the San Diego County Water Authority have built a desalination plant at the Carillo power plant that has produced water since December 2015. Unfortunately, desalination typically costs much more than other types of water supply, at more than $2000 per acre foot, is much higher than the volumetric charge for imported water (around $1000 for Metropolitan Water District) or local reservoir water (around $300). It is even higher than recycled water (Elias 2017). While a second desalination plant proposal is currently before the state Legislature, the high costs are a potentially difficult obstacle to overcome for a wider application of this technology (Gonzalez 2017).
A third unconventional water source is stormwater capture, which means that instead of letting rainwater runoff into storm drains, it can be captured and put to non-potable use. A related water source is graywater reuse, which is reusing the relatively clean water from baths, sinks, washing machines, and other kitchen appliances for suitable purposes such as outdoor irrigation. However, both potential sources face regulatory and operational challenges that need to be solved before they can be put to widespread use (LADWP 2015).
Future Water Challenges
California will face additional water challenges in the future. According to population projections made by California Department of Finance in 2013, California will reach a population of 44.1 million by 2030, an increase of over 5 million from the estimated 38.7 million in 2015 (PPIC 2016). This increased population along with a prospering economy will likely drive increases in water demand, especially if water conservation efforts reach their limit.
In addition to a growing population, climate models show that precipitation will likely decrease in California in a warming world. Indeed, in the United Nations Intergovernmental Panel on Climate Change’s Fifth Assessment Report (IPCC 2014), the consensus global climate model “projects decreases in winter precipitation over the southwestern USA and much of Mexico associated with the poleward shift in the dominant storm tracks and the expansion of the subtropical arid regions.” In addition, more of the winter precipitation will likely fall as rain rather than snow, diminishing the winter snowpack and the spring runoff that is crucial to meet water demand in the highdemand summer months.
Addressing Future Water Challenges
On April 7, 2017, Governor Jerry Brown declared an end to the drought emergency after recordbreaking precipitation during the previous winter filled California’s reservoirs to the brim, and produced a record snowpack. Many municipalities had lifted their own water restrictions months earlier. However, as the historical record shows, multi-year droughts will inevitably return in the future, perhaps exacerbated by the effects of climate change. This means that California must learn to manage its water supplies more wisely, by reforming its water right system, and finding new ways to conserve and recycle water, to meet the water challenges of the future. One immediate step could be to facilitate water trading between agricultural and urban users by cutting regulatory barriers and reducing transaction costs.

Hong Yu Xiao
Doctoral StudentHong Yu Xiao is a graduate student at the University of Pennsylvania, where he is pursuing a Ph.D. in applied economics from the Wharton School.
Balgobin, David and Toni Pezzetti. California Recycled Water Use in 2015. http://www.water.ca.gov/recycling/docs/2015RecycledWaterSurveySummary_EnglishUnits.pdf. July 2017. Accessed October 14, 2017. (2017)
California Drought Portal. California Water Use Drops 27.3%, Exceeds 25% Mandate for June. http://drought.ca.gov/topstory/top-story-43.html. July 30, 2015. Accessed October 15, 2017. (2015)
Carle, David. Introduction to Water in California. University of California Press. 2015. (2015)
City of Palo Alto. Urban Water Management Plan Update and Amendment. 1990. (1990)
City of Palo Alto Utilities. 1995 Urban Water Management Plan. 1996. (1996)
City of Palo Alto. Water Rates. http://www.cityofpaloalto.org/civicax/filebank/documents/8097. July 2017. Accessed October 15, 2017. (2017)
ConSol. Water Use in the California Residential Home. http://www.cbia.org/uploads/5/1/2/6/51268865/2010_-_chf_water_use_study.pdf. January 2010. Accessed October 14, 2017. (2010)
Delta Stewardship Council. The Delta Plan. http://deltacouncil.ca.gov/sites/default/files/documents/files/DeltaPlan_2013_CHAPTERS_COMBINED.pdf. 2013. Accessed October 14, 2017. (2013)
Department of Water Resources. Estimates of Natural and Unimpaired Flows for the Central Valley of California: Water Years 1922-2014. 2016. (2016)
Department of Water Resources. The Water Conservation Act of 2009. http://www.water.ca.gov/wateruseefficiency/sb7/. 2017. Accessed October 15, 2017. (2017a)
Department of Water Resources. Dams Within the Jurisdiction of the State of California. http://www.water.ca.gov/damsafety/docs/Dams%20by%20Dam%20Name_Sept%202017.pdf. September 2017. Accessed October 15, 2017. (2017b)
Department of Water Resources. Water Efficient Landscape Ordinance. http://www.water.ca.gov/wateruseefficiency/landscapeordinance/. 2017. Accessed October 15, 2017. (2017c)
Elias, Thomas. Desal Loses Urgency Following Wet Winter. http://www.sandiegouniontribune.com/pomerado-news/opinion/editorial/so-cal-focus/sd-elias-desal-loses-urgency-20170323-story.html. The San Diego Union-Tribune. March 23, 2017. Accessed October 14, 2017. (2017)
Gonzalez, Marco. San Diego Desalination Project Should be Lesson to Orange County. http://www.sandiegouniontribune.com/opinion/commentary/sd-utbg-desalination-water-alternatives-20171012-story.html. The San Diego Union-Tribune. October 12, 2017. Accessed October 14, 2017. (2017)
Guo, Jeff. Agriculture is 80% of Water Use in California. Why Aren’t Farmers Being Forced to Cut Back? https://www.washingtonpost.com/blogs/govbeat/wp/2015/04/03/agriculture-is-80-percent-of-water-use-in-california-why-arent-farmers-being-forced-to-cut-back/?utm_term=.5cd152f956d5. Washington Post. April 3, 2015. Accessed October 14, 2017. (2015)
Hagerty, Nick. Liquid Constrained in California: Estimating the Potential Gains from Water Markets. Job Market Paper. November 12, 2017 (2017)
Hanak, Ellen and Elizabeth Stryjewski. California’s Water Market, by the Numbers: Update 2012. San Francisco, CA: Public Policy Institute of California. 2012. (2012)
Howitt, Richard et al. Economic Analysis of the 2015 Drought for California Agriculture. https://watershed.ucdavis.edu/files/biblio/Final_Drought%20Report_08182015_Full_Report_WithAppendices.pdf. August 17, 2015. Accessed October 14, 2017. (2015)
Hundley, Norris. The Great Thirst: Californians and Water – A History. University of California Press. 2001. (2001)
Hutchins, Wells Aleck. The California Law of Water Rights. State Engineer of California. 1956. (1956)
Intergovernmental Panel on Climate Change. Climate Change 2014: Impacts, Adaptation and Vulnerability. https://www.ipcc.ch/report/ar5/wg2/. 2014. Accessed October 14, 2017. (2014)
Jimlrwin and the US Census Bureau. California Population Density Map. https://commons.wikimedia.org/wiki/File:California_population_map.png. December 11, 2011. Accessed October 15, 2017. (2011)
Los Angeles Department of Water and Power. Urban Water Management Plan. 1991. (1991)
Los Angeles Department of Water and Power. Urban Water Management Plan for the City of Los Angeles. 1995. (1995)
Los Angeles Department of Water and Power. 2000 Urban Water Management Plan. 2000. (2000)
Los Angeles Department of Water and Power. 2005 Urban Water Management Plan. 2005. (2005)
Los Angeles Department of Water and Power. 2010 Urban Water Management Plan. 2011. (2011)
Los Angeles Department of Water and Power. The Story of the Los Angeles Aqueduct. https://www.ladwp.com/ladwp/faces/wcnav_externalId/a-w-fact-hist?_adf.ctrl-state=mdtaqyhco_4&_afrLoop=1595867386628104. 2013. Accessed October 13, 2017. (2013)
Los Angeles Department of Water and Power. 2015 Urban Water Management Plan. 2016. (2016)
Metropolitan Water District of Southern California. 2015 Urban Water Management Plan. 2016. (2016)
Pacific Institute. Urban Water Conservation and Efficiency Potential in California. http://pacinst.org/wp-content/uploads/2014/06/ca-water-urban.pdf. June 2014. Accessed November 29, 2017. (2014)
Public Policy Institute of California. California’s Future: Population. http://www.ppic.org/content/pubs/report/R_116HJ3R.pdf. January 2016. Accessed October 14, 2017. (2016)
San Diego. Water Rates. https://www.sandiego.gov/water/rates/rates. August 1, 2017. Accessed October 14, 2015. (2017)
Shannon1, Department of Water Resources et al. Water Storage & Distribution in California. https://commons.wikimedia.org/wiki/File:California_water_system.jpg. October 23, 2013. Accessed October 14, 2017. (2013)
Smith, Rodney T. Listen to the Tree Rings on Sacramento River Hydrology. http://hydrowonk.com/blog/2014/09/17/listen-to-the-tree-rings-on-sacramento-river-hydrology/. September 17, 2014. Accessed October 15, 2017. (2014)
State Water Resources Control Board. Conservation Reporting Data. https://www.waterboards.ca.gov/water_issues/programs/conservation_portal/conservation_reporting.shtml. September 8, 2017. Accessed September 10, 2017. (2017)
Stevens, Matt. In Blow to Water Conservation, Court Rejects San Juan Capistrano’s Tiered Rates. http://www.latimes.com/local/lanow/la-me-ln-water-rates-case-20150405-story.html. Los Angeles Times, April 20, 2015. Accessed September 30, 2017. (2015)
USGS. Precipitation Map of California. https://nationalmap.gov/small_scale/printable/climatemap.html#California. 2017. Accessed October 15, 2017. (2017)
