The Use and Potential of Agrivoltaics in the United States
Agrivoltaics combine the production of crops or livestock with the generation of electricity from solar panels. To date, the number of agrivoltaics projects has been modest, about 600 nationwide. Sheep grazing is the most popular livestock type. Vegetables and berries are the leading crops.
At A Glance
Key Challenge
Extending the investment tax credits for new commercial solar projects beyond the end of 2027 would also help to spur agrivoltaic development.
Policy Insight
The federal government and all states need to recognize that agrivoltaics can help to overcome local opposition to solar development for fear of losing active farmland.
Introduction
Agrivoltaics are the co-location of ground-mounted rows of solar photovoltaic panels to produce electricity together with raising certain types of crops or livestock or providing pollinator habitat. Agrivoltaics enable the simultaneous generation of renewable energy and agricultural production.
There are generally two sizes of solar and agrivoltaic projects. Community solar usually has a capacity of less than five megawatts1 of electricity, and the solar panels cover less than 25 acres. Utility-scale solar has a capacity of five or more megawatts and covers more than 25 acres in panels. Intensive crop production and pollinator habitat are often found in community solar projects whereas livestock grazing is more common with utility-scale solar.
Many communities across the United States have seen tensions between proponents of solar projects and those who fear the loss of agricultural output and a declining local agricultural economy. Agrivoltaics offer an opportunity to keep agricultural land in production while increasing the amount of renewable electricity. Yet, some opponents of agrivoltaics projects object to the aesthetic effect of panels on a rural landscape.
Agricultural land is well-suited for solar projects because it is often relatively flat, cleared of trees, exposed to the sun, and held in large parcel sizes. The U.S. Department of Energy has projected that utility-scale solar projects may provide as much as 45% of U.S. electricity by 2050, up from just 4% today. This growth in solar electricity will require as many as 10 million acres of land (U.S. DOE 2021). So far, agricultural land has been the site of about 83 percent of utility-scale solar development (Sorensen et al. 2022).
The federal government incentivized solar development through the Inflation Reduction Act of 2022, which provided a 30 percent investment tax credit for solar projects. Solar projects accounted for more than 81 percent of new electrical generation capacity in 2024 (Pickerel 2025). The investment tax credits have also been key for agrivoltaics projects. The investment tax credit for commercial solar development is set to expire at the end of 2027.In addition, the number, location, and size of agrivoltaics projects may vary based on state and local government regulations and policies. Research suggests that solar developers who propose a project with agrivoltaics are more likely to gain local government approval and the necessary permits to build the project (Pascaris et al. 2023).
Goals of the Study
This study sought answers to several questions about agrivioltaic projects:
- What are the pros and cons of agrivoltaics? Opportunities and barriers?
- How many agrivoltaic projects exist in the U.S. and what types of crops and livestock do they produce?
- In which states are agrivoltaics being developed?
- How are state and local governments regulating agrivoltaics?
What Are the Pros and Cons of Agrivoltaics? Opportunities and Barriers?
Pros of Agrivoltaics
Economic Pros. Agrivoltaics present an opportunity to generate renewable electricity and produce particular crops and livestock. Agrivoltaics can create clean, renewable energy, jobs—particularly in the installation of solar arrays—and greater property tax revenues through the change in land use from strictly agricultural to agricultural-industrial.
Agrivoltaics can help diversify a farmer’s income with an annual rental fee from the solar developer and, through an agreement with the solar developer, revenue from the sale of crops or livestock raised under and around the solar panels.
Typical crops include: vegetables, berries, and pollinator habitat with bee keeping. Sheep grazing has been the most popular livestock activity. There are examples of cattle and other ruminants raised in agrivoltaic projects, but sheep are generally the easiest to manage, cause little damage to panels, and keep down the vegetation around the solar panels.
Environmental Pros. Agrivoltaics projects emit less greenhouse gases than separate solar projects and sheep grazing (Handler and Pearce 2022). Vegetation maintenance is important for solar production and grazing livestock, especially sheep, can reduce or eliminate the need for mowing beneath and between the solar panels. Less mowing decreases greenhouse gas emissions and operating costs. The grasses planted for livestock become a source of nutrition and can improve soil quality and control erosion. Manure from livestock fertilizes the soil.
Although livestock are a source of enteric methane, a potent greenhouse gas, sheep raised in an agrivoltaic project produce roughly 25% less greenhouse gas emissions than conventionally grazed sheep. This reduction is due in part because the agrivoltaic sheep do not eat corn and soybean feed and herbicide use is lower or avoided altogether (Handler and Pearce 2022).
In addition, the solar panels provide shade for the grazing sheep, which can help regulate their internal temperature and potentially reduce their water needs. Also, the crops and grass under the solar panels keep the panels cooler, helping maintain the efficiency of the panels in turning sunlight into electricity. Pollinator habitat under solar panels fosters biodiversity as well as enabling pollinators to fertilize nearby crops.
Community Solar and Agrivoltaics. Agrivoltaics are well-suited to community solar projects of less than five megawatts and under 25 acres. At this scale, the agricultural enterprises often feature intensive vegetable or berry production or pollinator habitat with bee keeping. Community solar projects can help provide electricity to neighbors or a broader community, be it rural or urban. Typically, a utility will purchase the power from a community solar project and provide a credit to the customers who are part of the community solar project.
The U.S. Department of Energy has conducted research on agrivoltaics through the National Renewable Energy Laboratory at several sites across the country. In addition, many universities have research projects involving agrivoltaics, such as Rutgers University’s use of high rack solar panels that enable the use of tractors underneath the panels.
Other research on agrivoltaics is aimed at identifying which crops perform well under or in-between solar panels and which solar panel types—fixed or tilt panels—work best with different types of crops or livestock.
Cons of Agrivoltaics
Economic and Operational Challenges. Many farmers are skeptical of agrivoltaics, in part because of complicated permitting and zoning procedures and uncertainty about profitability. Also, to deploy agrivoltaics, a farmer often has to learn how to raise new crops or livestock. Generally, the crops and livestock that can be produced with agrivoltaics are limited to labor-intensive vegetables and berries, pollinator habitat and bee keeping, and smaller livestock—primarily sheep.
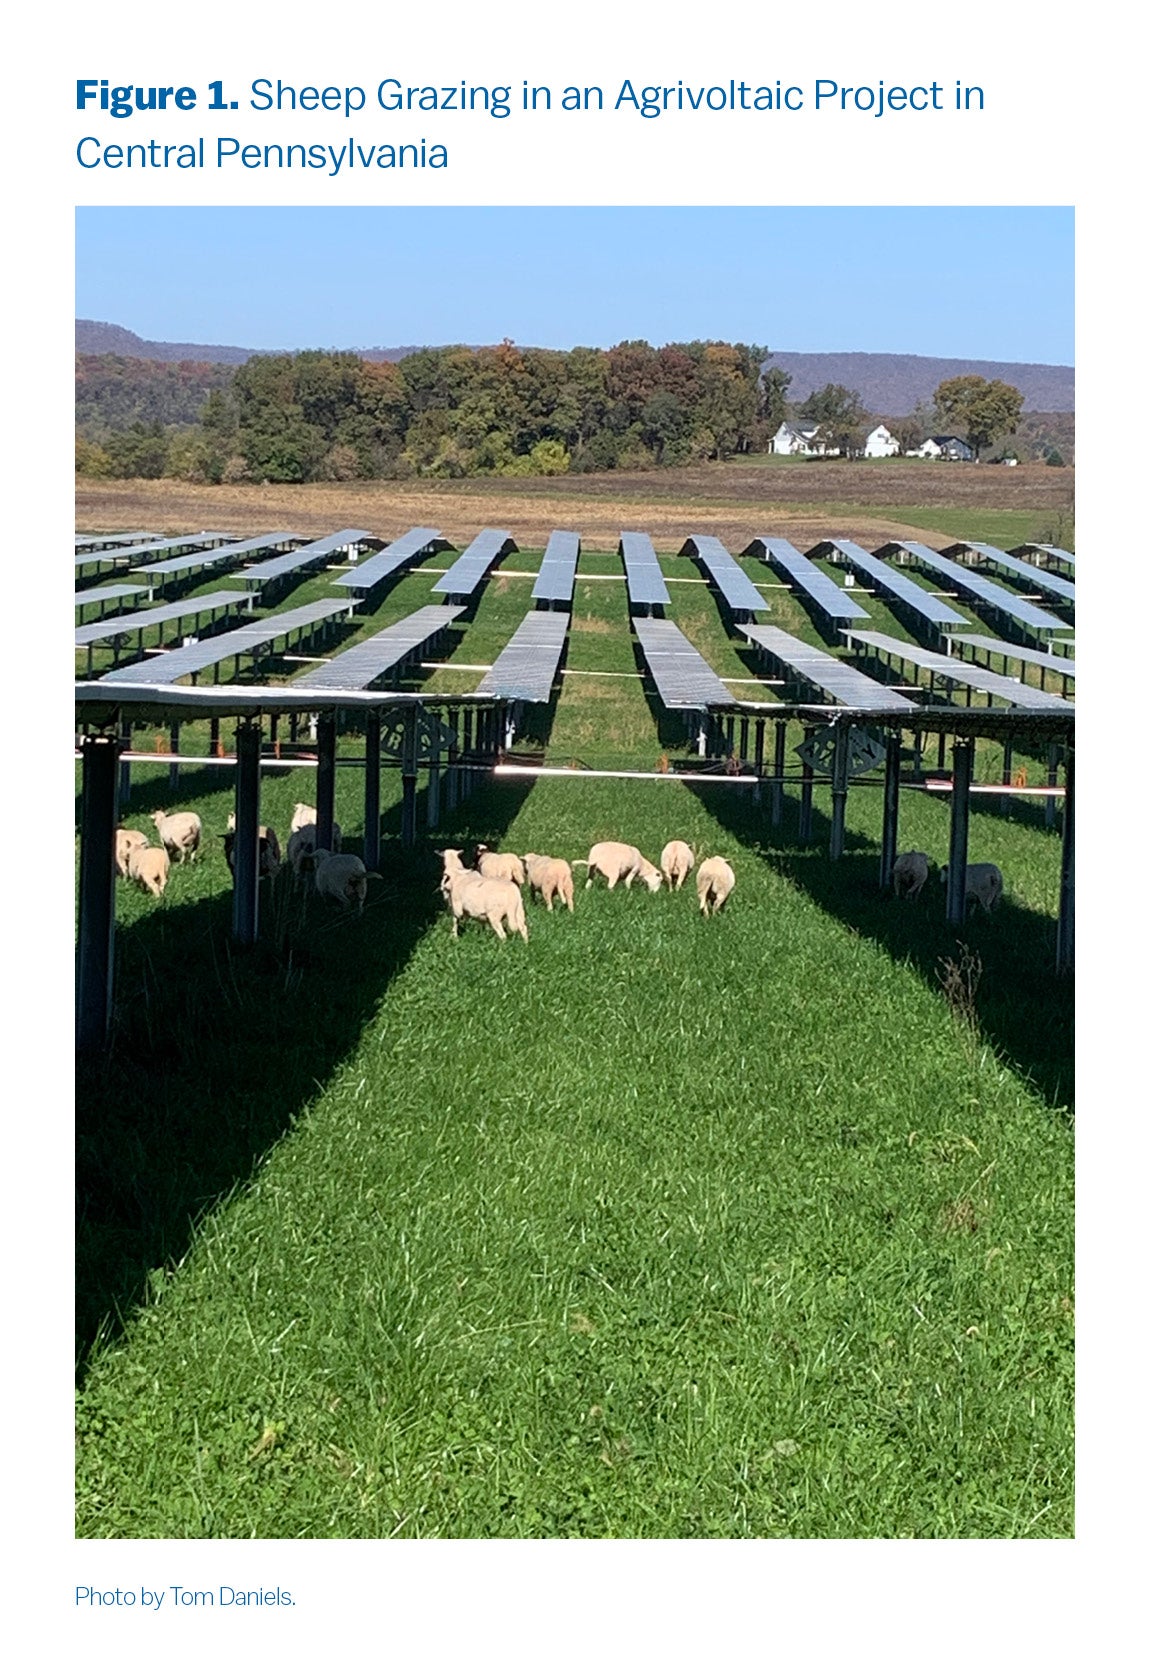
Standard low-rack agrivoltaics are usually three feet above the ground, leaving limited space for crop production or livestock grazing. Higher-rack agrivoltaics of five feet or above are more expensive to install because more steel is used, and the higher the panels, the harder and more dangerous they are to fix and maintain (see Photo 2). Overall, agrivoltaics tend to have higher capital costs than traditional solar development because more steel is needed for the racking along with more specialized design and installation (Boyd 2023).
A major potential problem is the uncertain start-up timing for a utility-scale agrivoltaic project because of the wait time for approvals for the solar project from the local government and the tie-in through the regional transmission operator to the electrical grid. The longer wait time to connect to the electrical grid means threatens profitability and could jeopardize the construction of an agrivoltaic project.
Aesthetic Concerns. The visual impact of an agrivoltaic project depends mainly on the number of solar panels as well as the topography of the land. Proposals for utility-scale solar projects that cover dozens to hundreds or thousands of acres often face public backlash because of their industrial rather than rural character. As a result, the panels could have a negative effect on nearby property values. To alleviate the visual effects, local governments typically require fencing with vegatative screening to soften the impact or conceal the solar project.
How Many Agrivoltaic Projects Exist in the US and What Types of Crops and Livestock Do They Produce?
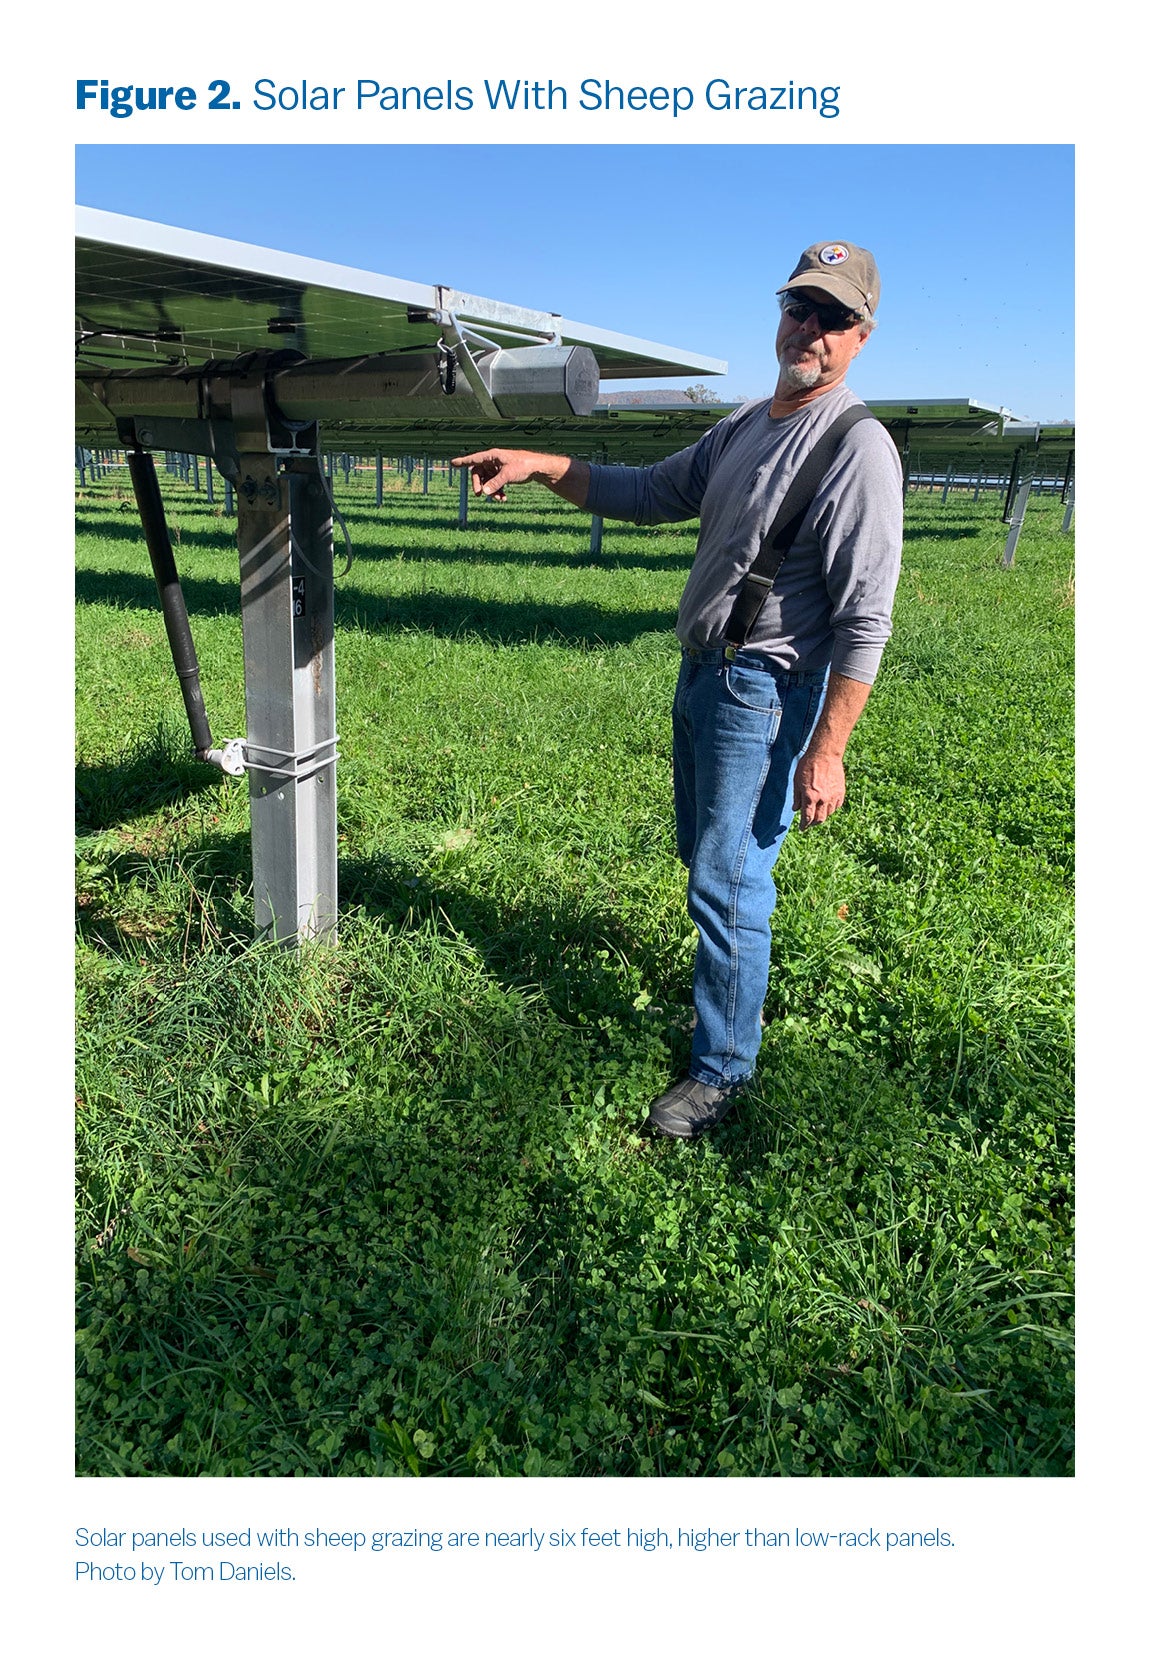
The National Renewable Energy Laboratory (NREL) a division of the U.S. Department of Energy, has launched a database of agrivoltaics projects to track the locations, types, and sizes of projects. As of early 2025, the NREL had identified 596 agrivoltaic sites covering 65,699 acres, and producing 10,473 MW, enough electricity to power about 7.5 million homes (U.S. DOE 2025)(see Table 1). The website includes a list of all of the known agrivoltaic sites in the U.S., the agricultural activities on each site, the generating capacity in megawatts, the photovoltaic technology, and the type of solar array (fixed or tracking the sun). However, the agrivoltaic projects are self-reported by the operators and tend to result in an undercount of the actual number of agrivoltaic projects. For example, alternative estimates of agrivoltaic grazing land across the U.S. range as high as 100,000 acres (Penn State 2023).
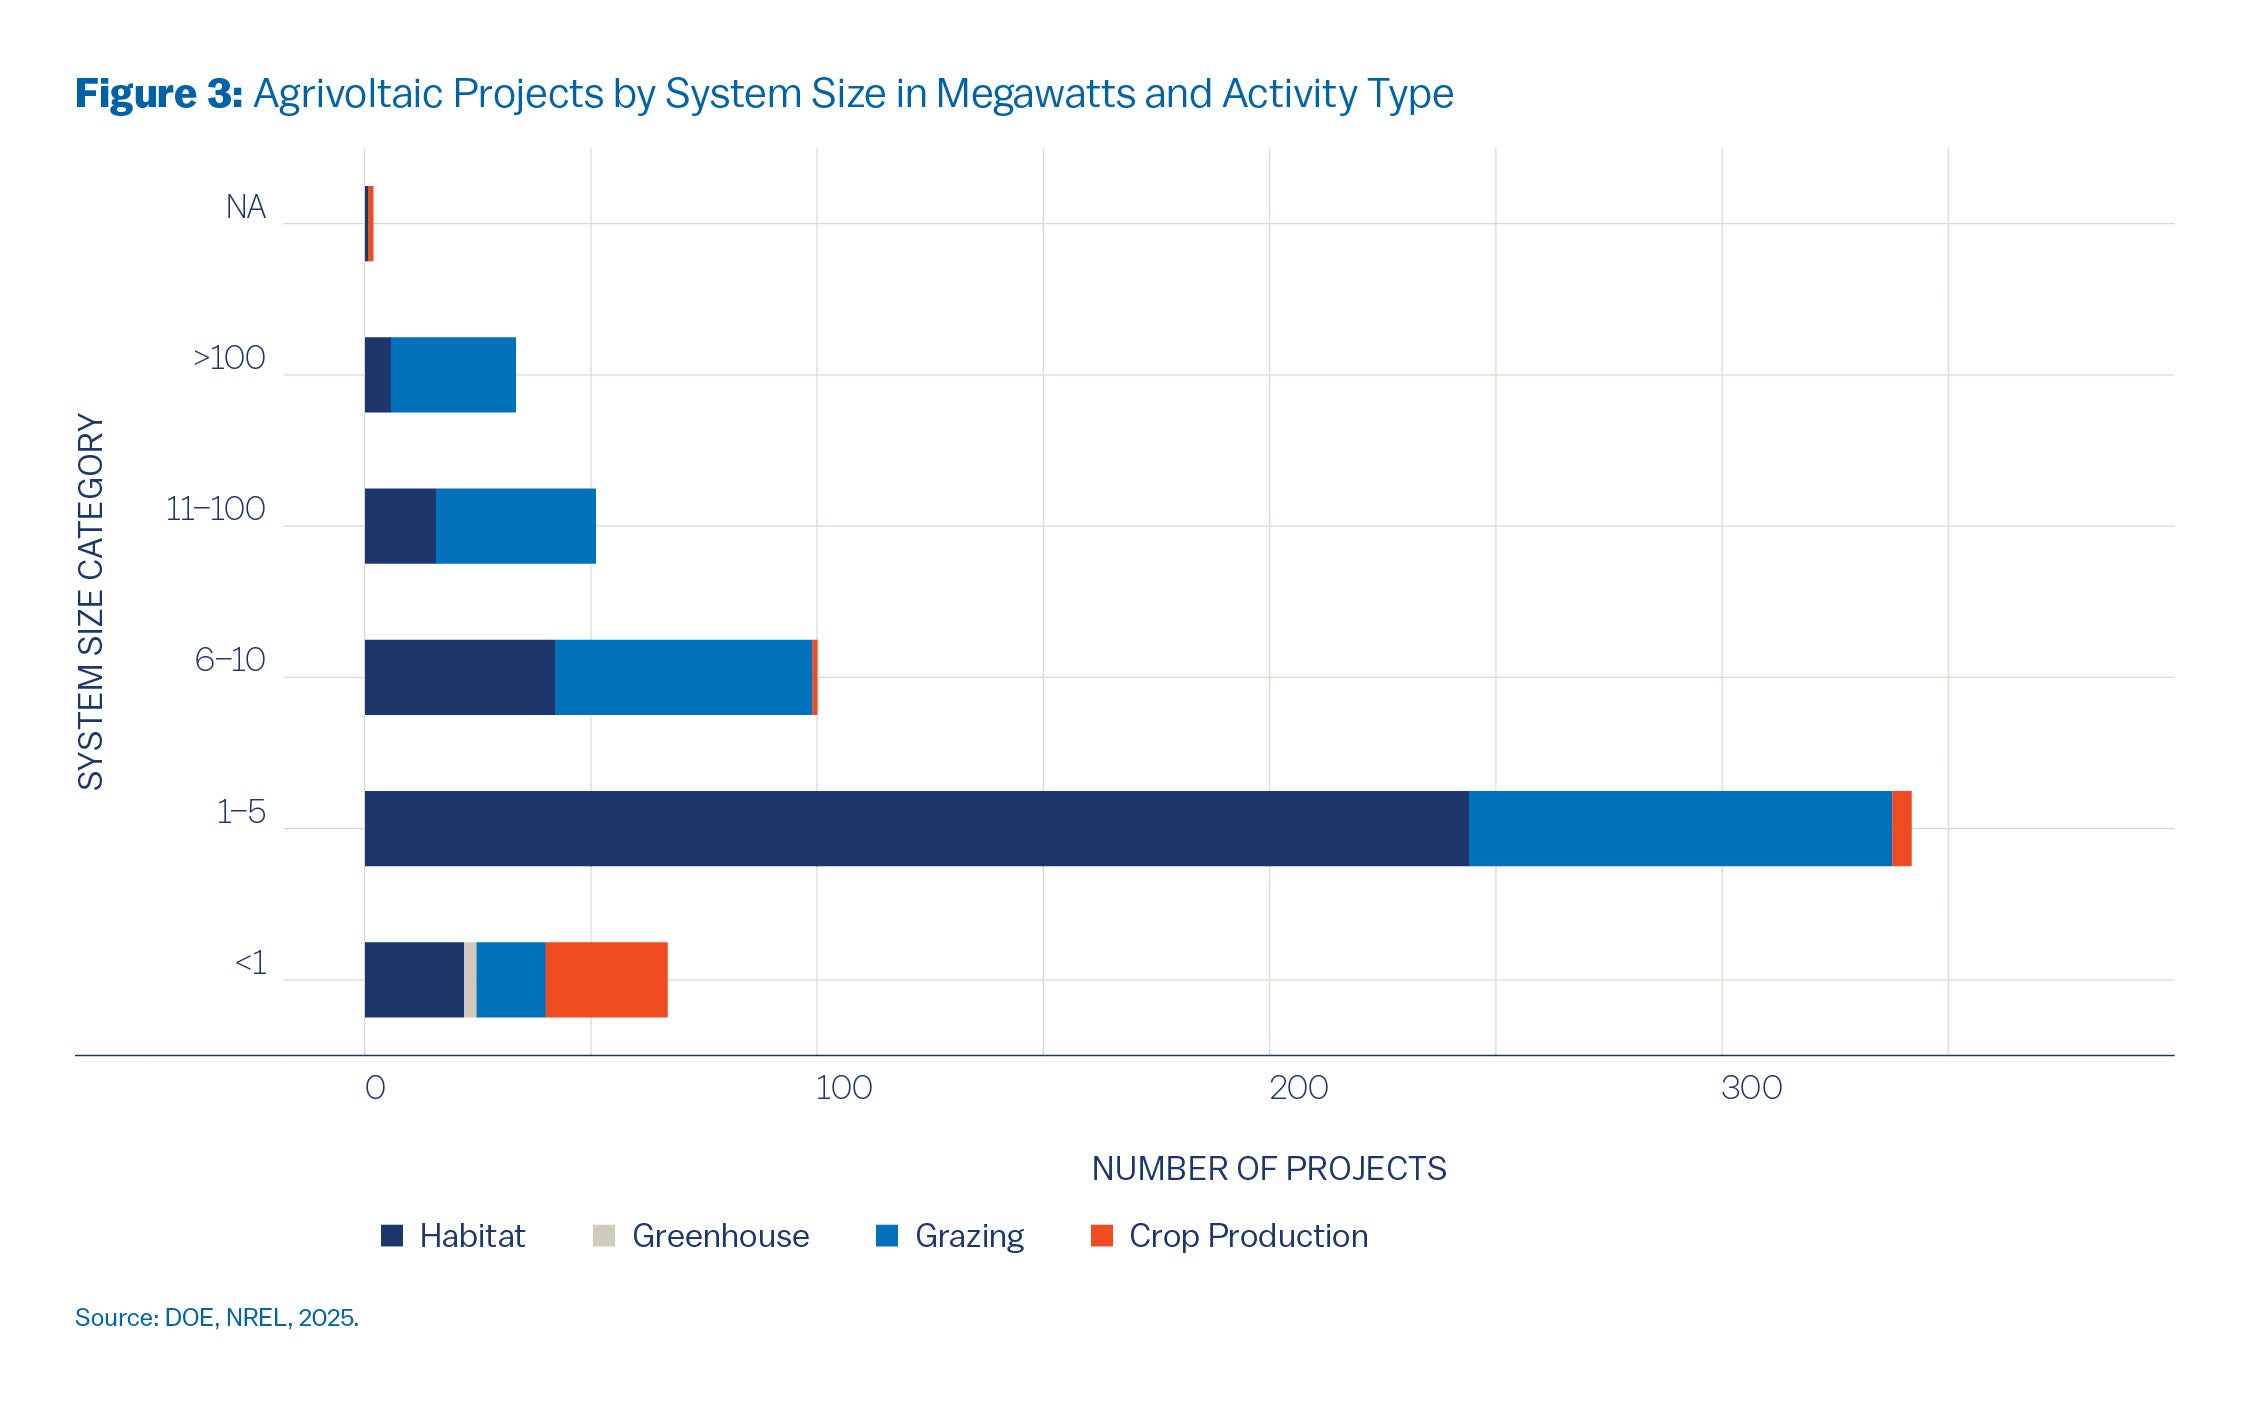
The large number of agrivoltaic projects and acres in the 1 to 5 megawatt category suggests that agrivoltaics are mainly attractive in community-scale solar projects. There are also economies of scale in the production of solar electricity. Projects between 5 and 10 MW produce much less electricity but at a higher cost per MW than large projects of over 100 MW.
The Solar Energy Industry Association has estimated that the U.S. has 7,290 large, utility-scale solar installations with a generating capacity of more than 5 MW (SEIA 2024). Compared to the less than 200 utility-scale solar projects over 5 MW in Table 1 that are using agrivoltiacs, it is clear that only a small percentage of large solar projects have agricultural activities.
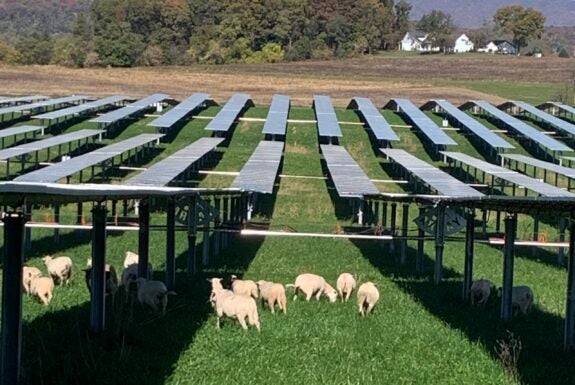
Figure 1, like Table 1, shows that most agrivoltaic projects of 1 to 5 megawatts feature pollinator habitat with some livestock grazing, and a small amount of vegetable and berry production. Shade tolerant and heat sensitive plants, such as spinach, lettuce, blueberries, and raspberries generally do well under solar panels. Solar projects of greater than 5 megawatts favor livestock grazing. Solar projects of less than one megawatt are divided among crop production, pollinator habitat, livestock grazing, and a tiny amount of greenhouse activity.
In Which States Are Agrivoltaics Being Developed?
Figure 2 presents a map of agrivoltaic enterprises across the United States. Most grazing activities occur in Massachusetts, New York, and California, with some presence in southern states such as Tennessee and Georgia. Minnesota and Illinois are dominated by pollinator habitat. Crop production is mostly found in the Northeast, West Coast, and Colorado. Greenhouse activities are concentrated in Colorado, California, and Georgia.
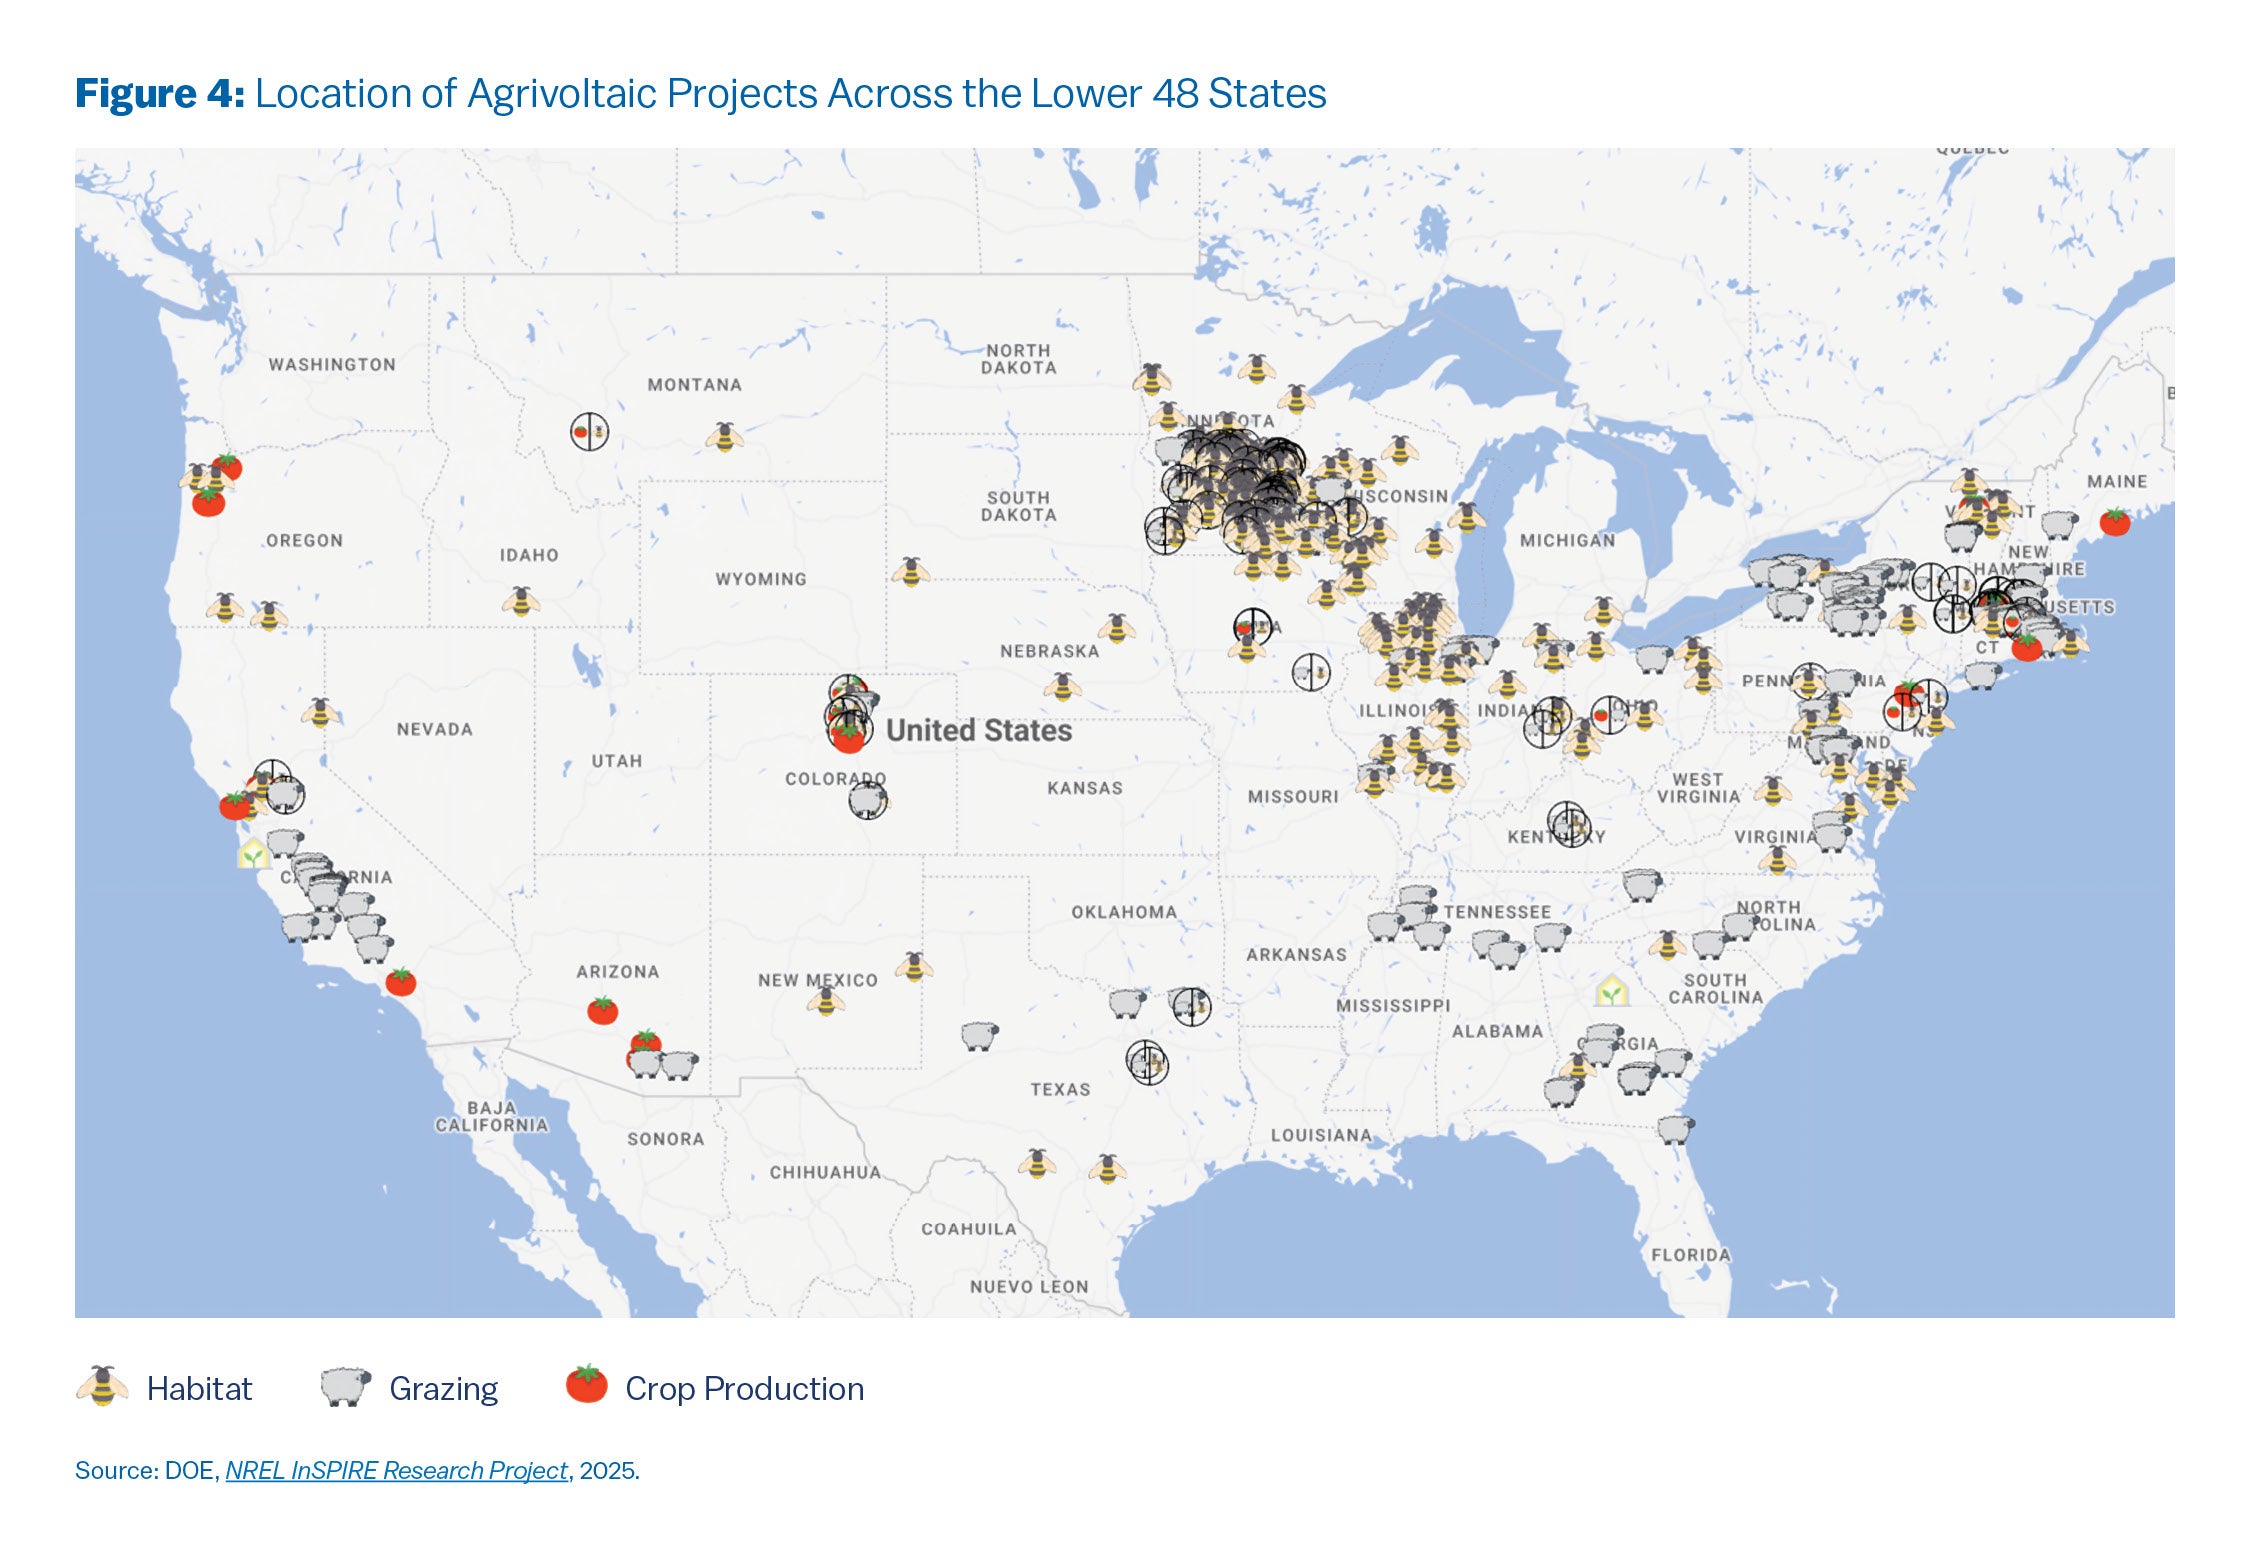
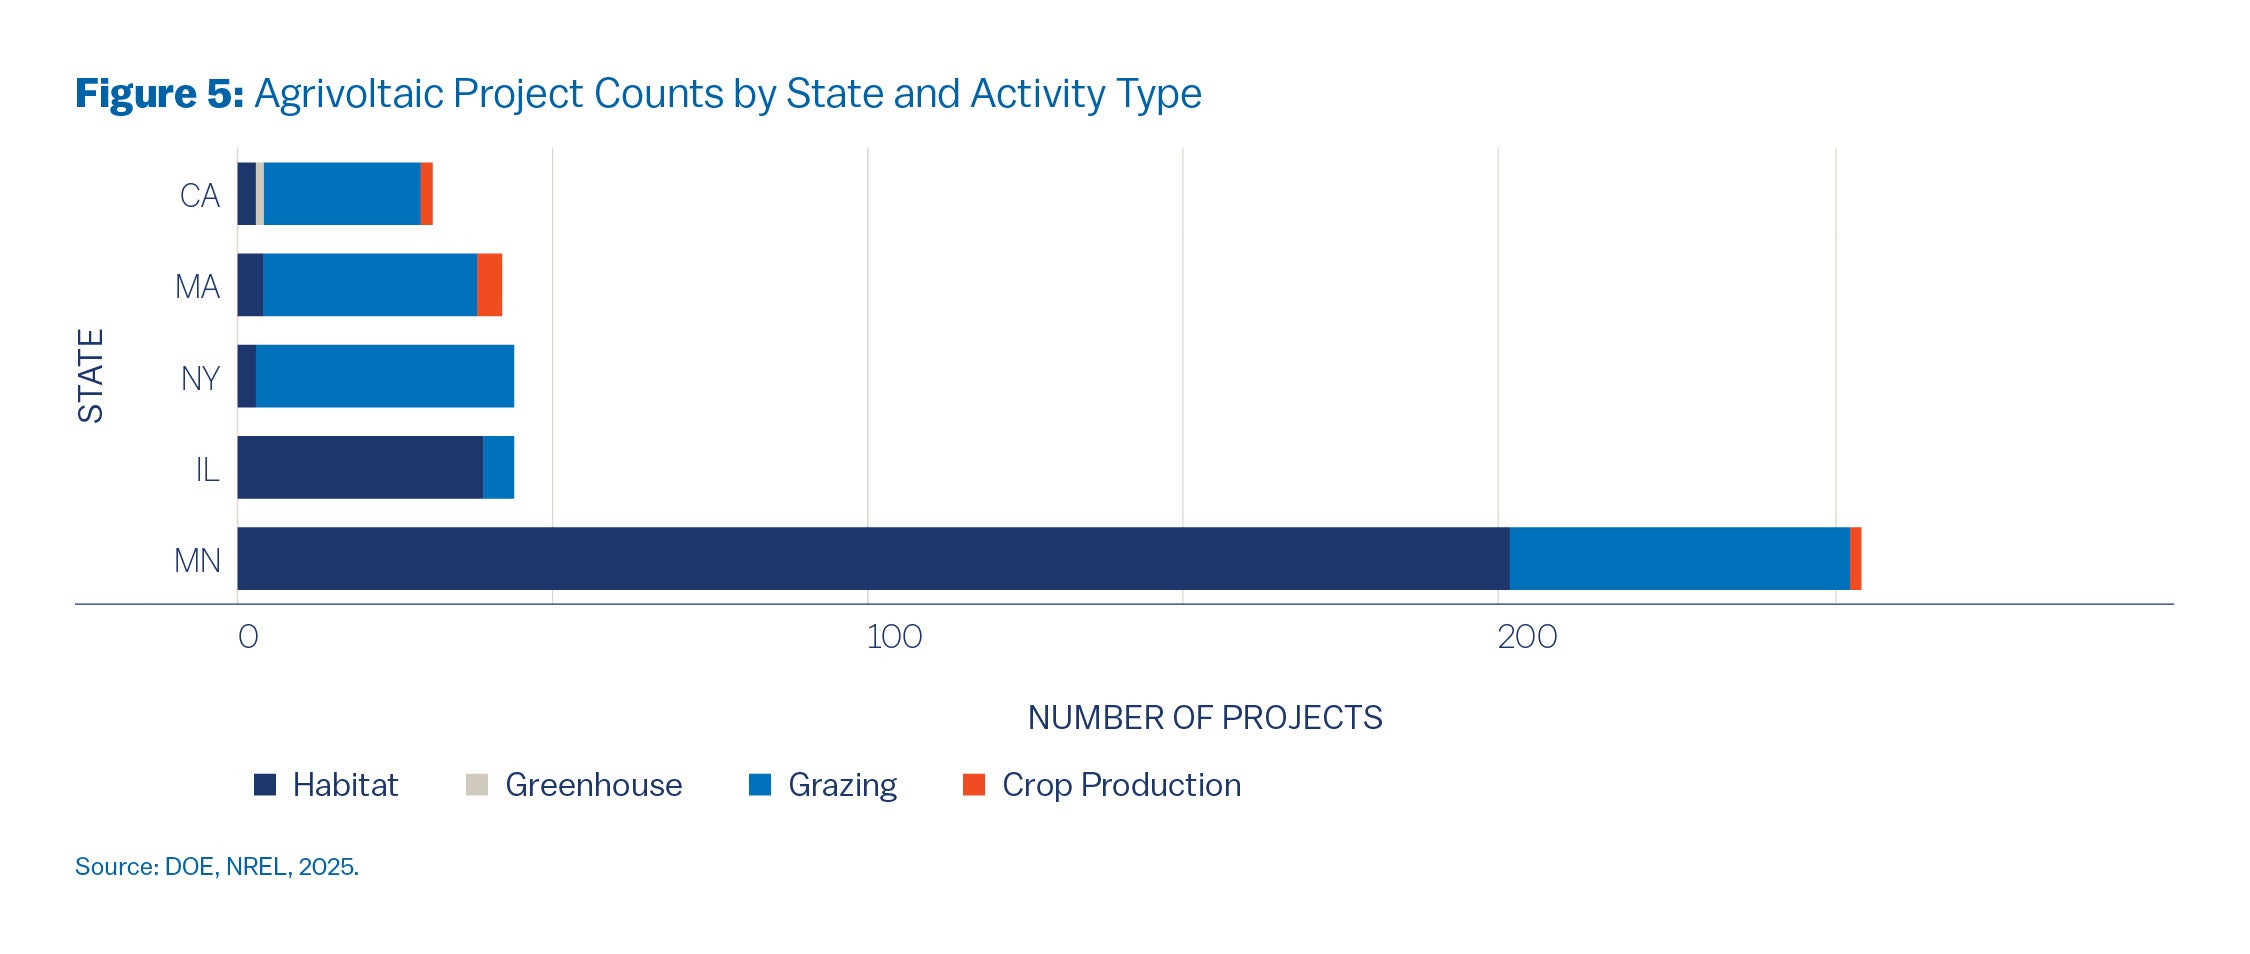
Figure 3 highlights the leading states in the number of agrivoltaic projects based on the NREL database. Minnesota is the leader with more than 200 projects, most of which incorporate pollinator habitat (see Figure 2 and Figure 3). Pollinator habitat is also the most common use for agrivoltaic projects in Illinois. Agrivoltaic projects in New York, Massachusetts, and California feature more livestock grazing than pollinator habitat.
States Promoting Agrivoltaics
A few states are encouraging the construction of agrivoltaics through incentives or research. Massachusetts has enacted a feed-in tariff adder of $0.06/kWh for agrivoltaic projects through its Solar Massachusetts Renewable Target (SMART) program. Massachusetts also established a commission to make recommendations to remove barriers to developing agrivoltaic projects.
New Jersey has authorized an agrivoltaics pilot program of up to 200 MW on farmland not preserved through a conservation easement and funded a research and development system for agrivoltaics at the Rutgers University Agricultural Experiment Station.
Colorado has provided $500,000 for agrivoltaics research and demonstration projects (Boyd, 2023). Maryland exempts certain community solar systems with agrivoltaic projects from personal property taxes.
How State and Local Governments Are Regulating Agrivoltaics
State governments generally give the responsibility for the siting and operation of agrivoltaic projects to local governments. Some states, notably New York and Illinois, have authority to override local government opposition to solar projects, with or without agrivoltaics.
The most common local government land use regulation is zoning, which divides a local jurisdiction into zoning districts, such as residential, commercial, industrial, and agricultural or rural. Each zoning district allows certain land uses and sets limits on building height, building setbacks from property lines, lot coverage in impervious surface, and density of development.
The local zoning ordinance can identify zoning districts where agrivoltaics are allowed or not allowed. Agricultural activities are typically limited to an agricultural zone or a rural residential zone. So, agrivoltaics are rarely found in a standard residential zone or a commercial zone. Some local governments have used a solar overlay district to more precisely show where solar development with or without an agricultural activity can be located.
Zoning ordinances often treat solar projects, including agrivoltaics, as a conditional use, requiring approval by the local elected officials. The proposed agricultural activity within an agrivoltaics project can become a positive factor in a local government’s decision to allow the project. By maintaining at least some of the land in agricultural production, agrivoltaics projects offer a more acceptable development than a community-scale or utility-scale project that simply displaces agricultural use.
Still, a major concern for the future of agrivoltaics is that more than 400 of the nation’s 3,144 counties have either banned solar development or made it very difficult (Weise et al. 2024). In nearly all states, without local government approval, an agrivoltaic project will not be built.
Conclusions and Recommendations
Agrivoltaics combine agricultural production with the generation of electricity from solar panels. So far, the adoption of agrivoltaics across the United States has been modest, involving just under 600 projects and 66,000 acres, but has created over 10 gigawatts2 of renewable electricity. The prospects for the growth of agrivoltaics are generally positive, though some obstacles remain.
The 30% investment tax credit of the Inflation Reduction Act has been a major incentive for solar and agrivioltaic development. The impending expiration of the investment tax credit for commercial solar projects at the end of 2027, may very well slow the growth of agrivoltaics. Yet, proposing agricultural production together with solar electricity generation can be a way for solar developers to receive zoning approval from local governments.
Sheep grazing has been the most popular enterprise with solar projects of more than 5 megawatts. Yet, labor-intensive production for vegetables, berries, and pollinator habitat, fit better with solar projects of less than 5 megawatts.
The development of agrivoltaic projects will likely continue to face three main obstacles:
- The time it takes for an agrivoltaics project to connect to the transmission grid. Wait times are taking up to two years, which jeopardize the financial success of the solar generation side of an agrivoltaics project.
- Local opposition to solar projects has led to bans on solar development by some local governments or burdensome regulations. Six states do not allow community-scale solar projects.
- Agrivoltaics often involve a change in farming practices. For example, labor-intensive vegetable production is very different than row crop production using machinery and tractors. Also, experience with sheep grazing is not widespread. There were more than six million sheep in the U.S. in 2005, compared to just over five million today (NASS 2025). Experiments with high rack solar panels that enable tractors to operate underneath the panels are on-going. But extensive crops, such as corn and soybeans cannot be raised with standard solar panels three fet off the ground.
Recommendations to Promote Agrivoltaics
Federal Government
- Extend the 30% investment tax credits for commercial solar development beyond 2027.
- The Federal Energy Regulatory Commission needs to intervene to fix the wait time transmission grid connection problem or new federal legislation may be needed.
- The U.S. Department of Energy through its Solar Energy Technologies Office (SETO) has provided millions of dollars for research on agrivoltaics. Additional federal support research grants for agrivoltaics should be included in the pending 2025 Farm Bill.
State and Local Governments
- Statewide and local government maps of potential solar (and agrivoltaic) sites can be helpful for solar and agrivoltaic project developers. The Town of Shelburne, Vermont has done this, for example. The State of Vermont also has a statewide solar potential database.
- Local governments should explore entering into a community benefit agreement—a binding agreement as part of the approval process—with a solar developer to ensure that a specific agricultural enterprise will be operated on the site. Penalties would apply if the agricultural enterprise is not developed or ceases operation.

Tom Daniels
Crossways Professor, City and Regional PlanningTom Daniels is the Crossways Professor of city and regional planning at the Weitzman School. Daniels directs the concentration in Land Use and Environmental Planning.

Iris (Zixin) Chen
Master of City Planning, Weitzman SchoolIris (Zixin) Chen is a is a recent graduate of the University of Pennsylvania where she earned a master of city planning degree and a certificate in energy policy.
Boyd, M. 2023. “The Potential of Agrivoltaics for the U.S. Solar Industry, Farmers, and Communities.” U.S. Department of Energy. https://www.energy.gov/eere/solar/articles/potential-agrivoltaics-us-solar-industry-farmers-and-communities. Accessed October 22, 2024.
Handler, R. and J. Pearce. 2022. “Greener Sheep: Life Cycle Analysis of Integrated Sheep Agrivoltaic Systems.” Cleaner Energy Systems, 3: 100036. https://doi.org/10.1016/j.cles.2022.100036.
National Agricultural Statistical Service. 2025. “Sheep, Inventory by Year, U.S.” https://www.nass.usda.gov/Charts_and_Maps/Sheep_and_Lambs/sheep1.php. Accessed June 12, 2025.
National Renewable Energy Laboratory (NREL). U.S. Depertment of Energy. 2024. “Inspire: Agrivoltaics Map.” https://openei.org/wiki/InSPIRE/Agrivoltaics_Map. Accessed November 12, 2024.
Pascaris, A., A. Gerlak, and G. Barron-Gafford. 2023. “From Niche-Innovation to Mainstream Markets: Drivers and Challenges of Industry Adoption of Agrivoltaics in the U.S.” Energy Policy, 181: 113694. https://doi.org/10.1016/j.enpol.2023.113694.
Penn State University Extension Service. 2023. “Agrivoltaics and Large-Scale Solar: Webinar on November 16, 2023.” https://psu.mediaspace.kaltura.com/media/1_so9xdjnw. Accessed December 12, 2024.
Pickerel, K. 2025. “Solar Accounts for 81.5% of New Electricity Sources Added to U.S. Grid in 2024.” Solar Power World, February 7, 2025. https://www.solarpowerworldonline.com/2025/02/solar-accounts-for-81-5-of-new-electricity-sources-added-to-us-grid-in-2024/. Accessed February 12, 2025.
Solar Energy Industry Association (SEIA). 2025. “Community Solar.” https://seia.org/initiatives/community-solar/. Accessed January 7, 2025.
Solar Energy Industry Association. 2024. “Major Solar Projects List.” https://seia.org/research-resources/major-solar-projects-list/. Accessed December 10, 2024.
Sorensen, A., T. Nogeire, and M. Hunter. 2022. “Potential Placement of Utility-Scale Solar Installations on Agricultural Lands in the U.S. to 2040.” American Farmland Trust. https://farmlandinfo.org/wp-content/uploads/sites/2/2023/03/AFT_FUT2040-solar-white-paper.pdf. Accessed January 19, 2025.
U.S. Department of Energy. National Renewable Energy Laboratory. 2025. “Agrivoltaics Map.” https://openei.org/wiki/InSPIRE/Agrivoltaics_Map. Accessed February 12, 2025.
U.S. Department of Energy. 2021. “Solar Futures Study.” https://www.energy.gov/eere/solar/solar-futures-study. Accessed October 7, 2024.
Weise, E. et al. 2024. “U.S. Counties Are Blocking the Future of Renewable Energy: These Maps, Graphics Show How.” USA Today, February 4 and 27, 2024. https://www.usatoday.com/story/graphics/2024/02/04/us-renewable-energy-grid-maps-graphics/72042529007/. Accessed January 6, 2025.
