Net-Zero Nevada: From Pledge to Action

On the path to net zero, states face challenges unique to their local geography and resources. In this case study, we explore four custom pathways for Nevada.
At a Glance
Key Challenge
Achieving net-zero goals requires deploying a portfolio of carbon management solutions at a large scale, with solutions that are technically, economically, and socially adapted to the local context.
Policy Insight
As Nevada designs a carbon reduction plan, it should include an assessment of the potential environmental justice issues that may arise from the deployment of clean energy and carbon capture technology.
As of January 2022, twenty-four U.S. states and the District of Columbia have declared economy-wide greenhouse gas emission targets through statutory and/or executive action. These targets typically project a certain level of emission reductions by a specified future date. They can also include language like “carbon neutrality” or “net zero,” which require a certain amount of carbon removal to address residual emissions.
While there may exist countless pathways to achieve net zero, not all are created equal. Decisions surrounding the technical approaches to both carbon reductions and removals will have varying levels of social and economic impact. These impacts must be considered early and frequently as net-zero pledges turn into action.
Where to Begin?
The concept of net zero or carbon neutrality is straightforward in theory: the declaring entity must ensure that by a given deadline, there are no net emissions of CO2e to the atmosphere. Any sound net-zero plan starts with a robust assessment of emissions: where they occur, why they occur, and what their trajectories are going forward.
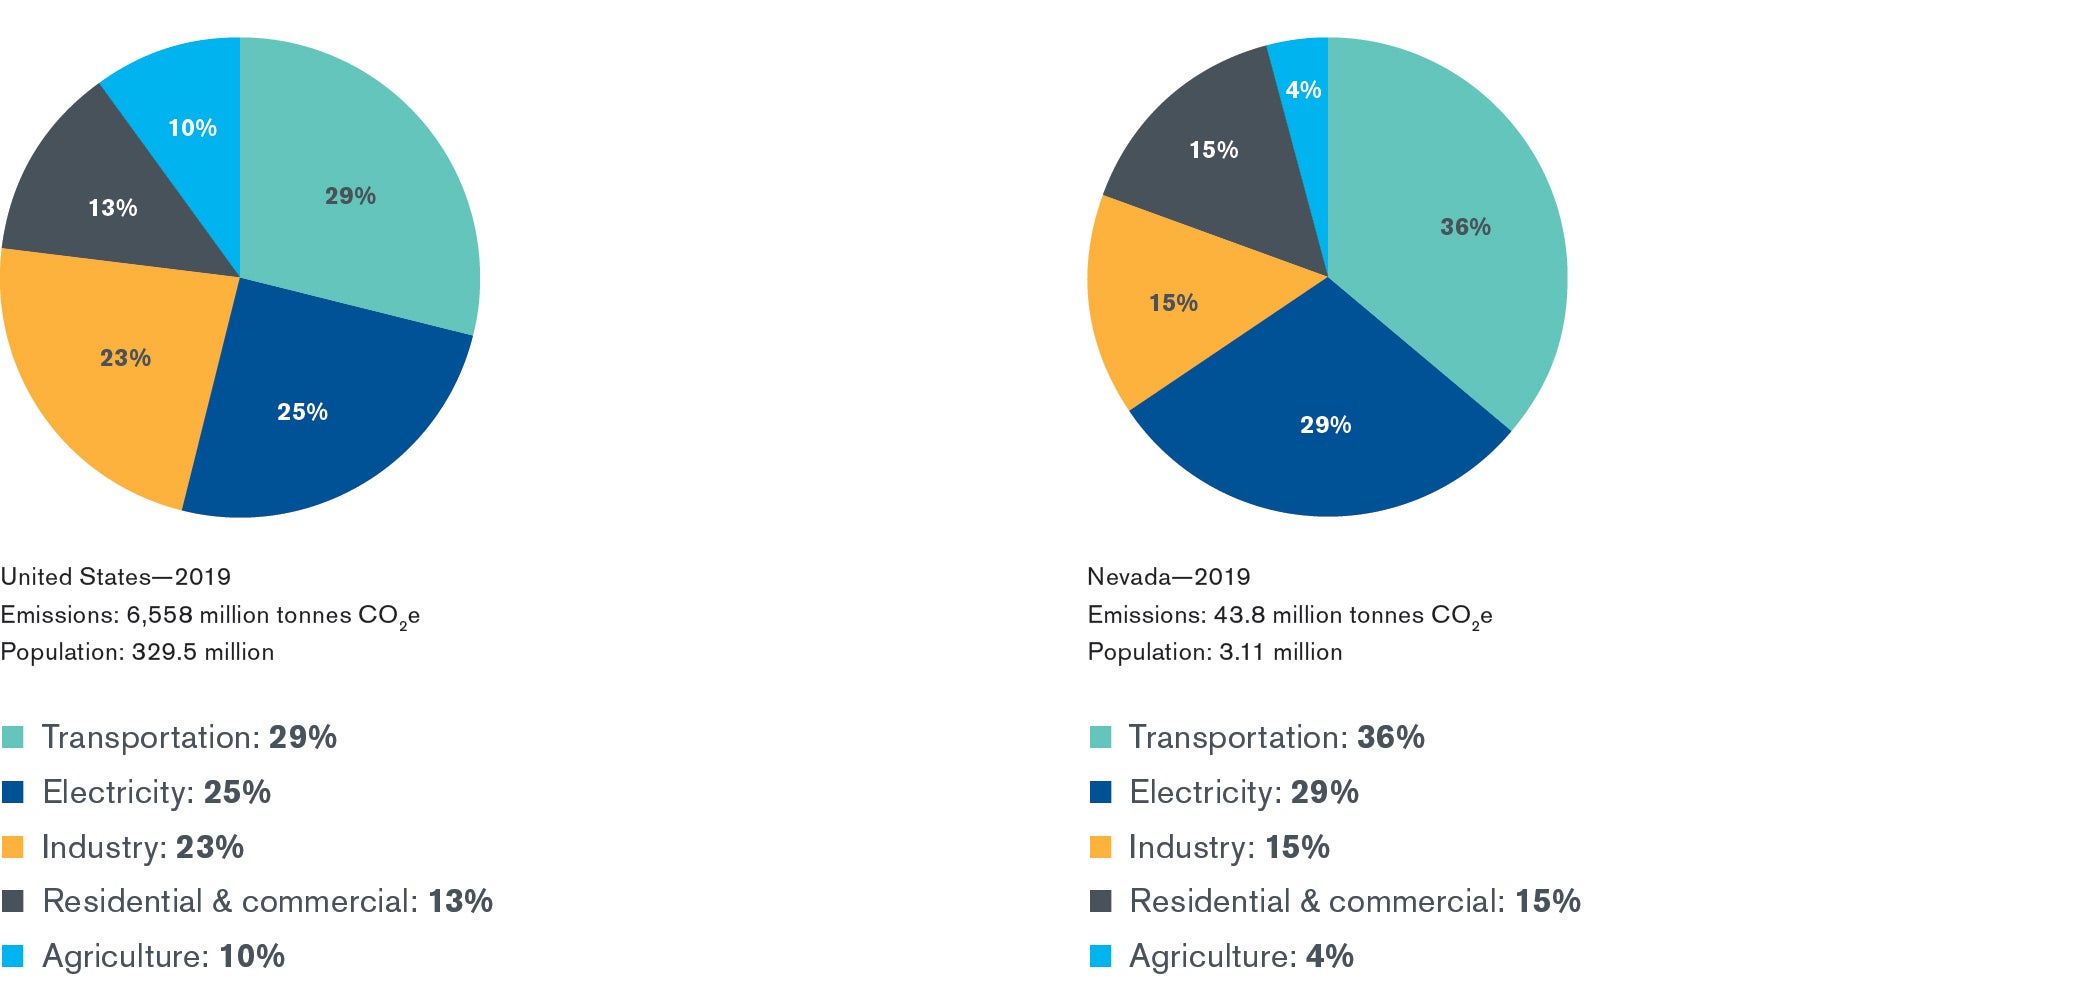
A look at U.S. emissions by sector gives an immediate sense of where efforts must lie (Figure 1, left). Yet there are two problems with viewing the problem with such broad strokes. The first is that regional contributions by sector might look very different in one area of the country versus another.
To zoom in, let’s consider the case of Nevada (Figure 1, right). Like the United States as a whole, most emissions come from transportation and electricity, but in Nevada these numbers are skewed larger than the national average. Conversely, fewer emissions come from agriculture, which is understandable given the arid climate, and from industry, due to issues of resource availability and proximity to markets.
An issue that is potentially much larger is emission scope. According to the GHG Protocol Corporate Standard (GHGP 2015), emissions can be classified into three categories (Figure 2):
- Scope 1: emissions from the direct consumption of fossil fuels in any facilities and/or vehicle fleet owned by the reporting entity or state
- Scope 2: emissions associated with purchased electricity, heat, steam, and cooling; in essence, any form of energy consumption in any entity not controlled or owned by the state
- Scope 3: emissions associated with value-chain activities, both upstream and downstream of direct operations
In the present report, we consider scope 1 emissions, as these are the emissions that the companies and the individuals have direct control of. For the transportation sector, emissions from fuel production (scope 3) were also considered in our estimates, as most of these emissions are made out-of-state and a change in fuel consumption in Nevada could avert these emissions.
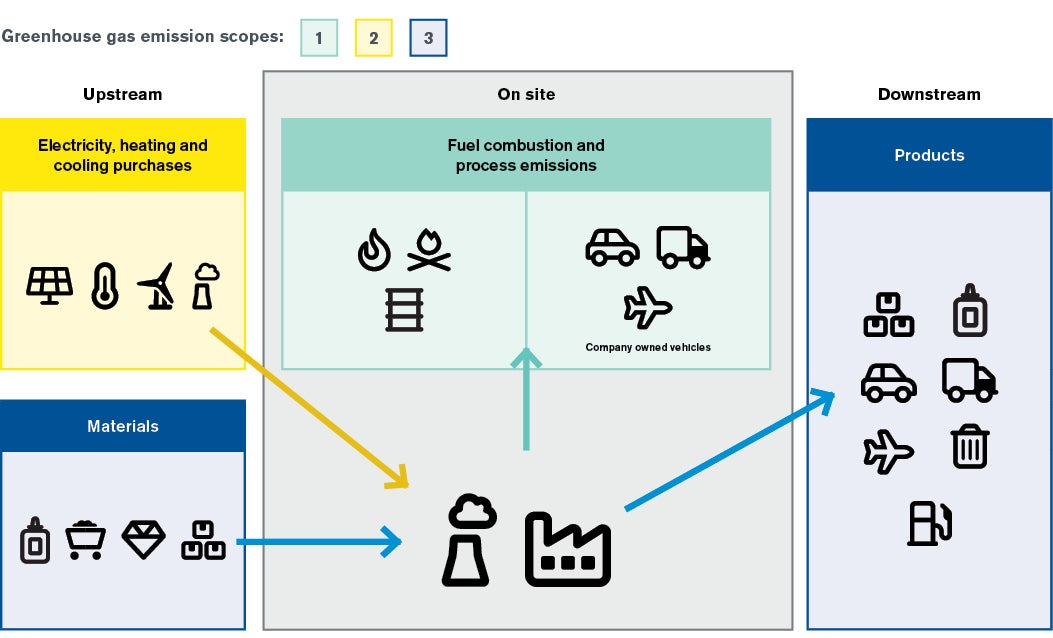
One complication is that one state’s scope 1 emissions could be another state’s scope 2 or scope 3 emissions. Consider, for example, a power plant in California that supplies electricity to Nevada. These emissions would count as scope 1 in California and scope 2 in Nevada. Likewise, automobiles produced in Nevada could have scope 3 emissions in other states.
Having a full understanding of scope is important because in addition to showing where to focus efforts, it also reveals how to exercise control. For example, if a company generates its own electricity, that company has a number of options to reduce the carbon emissions associated with generation. If, conversely, that electricity is sourced from elsewhere, there may be no direct route to achieving emission reductions at the source. In such cases, the company is left with three options: reduce consumption, change supplier, or turn to carbon offsetting to compensate. Many solutions will involve a combination of these strategies.
Another complication that arises from net-zero pathways is the potential for emission leakage. In this sense, leakage does not refer to physical leakage of emissions from storage reservoirs, but rather economic leakage of emissions resulting from local emission reduction efforts. For example, a lime producer required by the state to decarbonize operations or retrofit with carbon capture and storage (CCS) might instead shift operations out of state. While this shift in emissions may show favorably on a state’s ledger toward net-zero, the emissions are not reduced, only shifted outside of the accounting boundaries.
The reverse situation can also occur, in which the actions of neighboring states could shift emissions into the state through induced leakage of economic activity and/or population influx. As an example, Nevada’s two western neighbors California and Oregon both have net-zero goals. Hence, it will be important for Nevada to closely track the policies and efforts in neighboring states to minimize any adverse impacts from interstate leakage.
Reduce, Avoid, Remove
Achieving net zero involves three complementary approaches: emission reductions, emission avoidance, and emission removal (Figure 3).
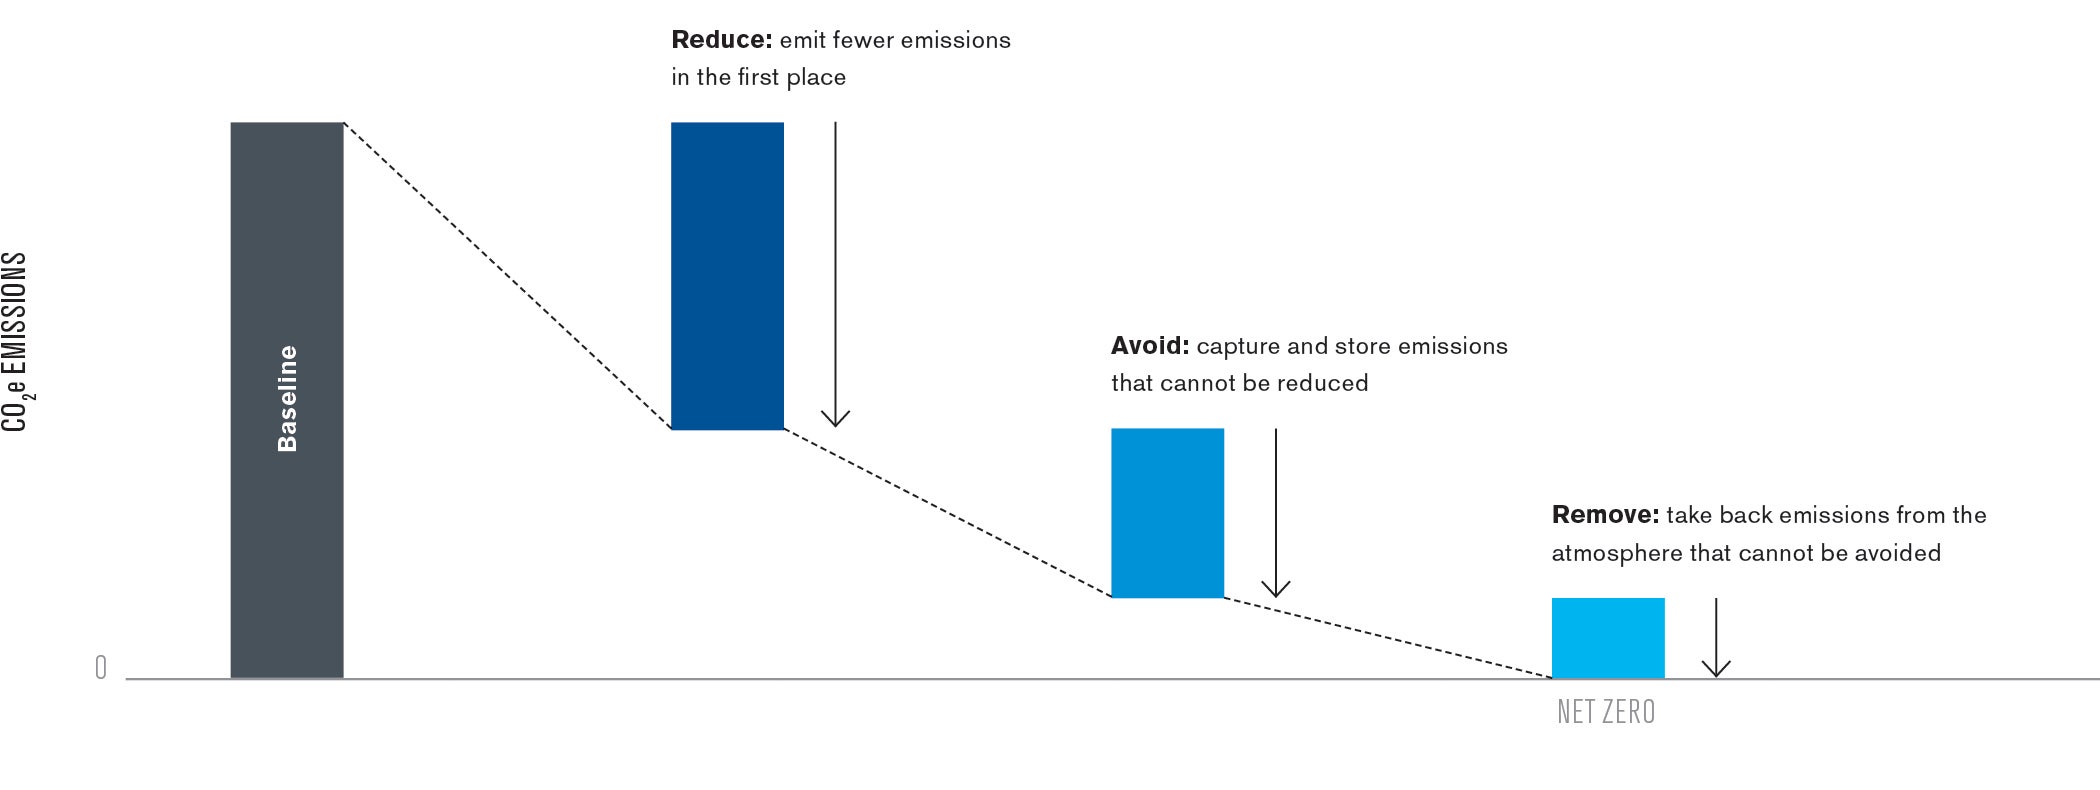
Reduce: The most widely developed approach involves emitting fewer emissions in the first place. To do so, it is necessary to develop low-carbon sources of energy (e.g., solar, wind, geothermal, biomass), electrify cars and homes, increase the energy efficiency of processes and buildings, and decommission power generation systems that use fossil fuels, especially coal.
Avoid: Reduction strategies often only address a portion of emissions, and many industries will continue to produce CO2 as an unavoidable byproduct. Here, technologies like carbon capture use and storage (CCUS) can help avoid the release of much of that CO2 into the atmosphere. To maximize climate benefit, this captured CO2 should be placed into long-term storage, either by means of subsurface injection in suitable reservoirs, or through conversion into long-lived products.
Remove: Even after deep reductions and avoidance, it may be necessary to close the gap on climate targets through direct carbon dioxide removal (CDR) from the atmosphere. CDR can address current and legacy emissions and is generally cast into two categories: nature-based approaches and technology-based approaches. Nature-based approaches include reforestation, afforestation, and soil organic carbon enhancement. Technical approaches include direct air capture (DAC) or carbon mineralization for long-term storage of CO2. Both nature-based and technological solutions are needed for removing carbon from the atmosphere. A balanced deployment of these strategies taking into account the local resources, and the environmental and social needs is essential to ensuring a successful path towards carbon net neutrality.
While CO2 avoidance and CO2 removal may appear to play a similar role in mitigating emissions that cannot be reduced, it is more energy efficient and less expensive to capture carbon at the source (Pilorgé et al. 2020, Psarras et al. 2020). Hence, avoidance should be prioritized over removal whenever possible.
A State-Specific Strategy
As part of a larger effort to mitigate climate change, Nevada has pledged to achieve net-zero emissions of greenhouse gasses (GHGs) by 2050. In 2017, GHG emissions totaled 43.8 metric tons of carbon dioxide equivalent (MtCO2e) (Figure 1) (NDEP 2020), and these emissions are expected to rise to 71.3 MtCO2e by 2050 if no efforts are made to manage carbon emissions. In 2021, Nevada had a population of 3.17 million people (SNDT 2021) and one of the highest population growth rates in the country, with a projected population of 3.79 million in 2040 (SNDT 2020). It is also one of the most urbanized states, with over 90% of its population living in cities (Iowa State University 2010).
Nevada is also the driest state in the country (World Atlas 2019) and receives only 250 mm of average rainfall per year (NOAA 2021). Due to water scarcity, the local ecosystems are composed of 74% desert and semi-desert, 15% forests and woodlands, 7% shrub and herb vegetation, and 5% other ecosystems (USGS 2016a). This desert environment is appropriate for solar power generation, with an average horizontal solar irradiance of 4.5–5.25 kWh/m2/day in the northern half of the state and of 5.25–5.75 kWh/m2/day in the southern part of the state with seasonal variation (NREL 2018). Nevada also has one of the highest amounts of geothermal resources in the country (DOE 2018).
Nearly 87% of the land in the state is publicly owned by the federal government (NACO 2020), and 63% of the state is managed by the Bureau of Land Management (BLM) (DOI n.d.). Nevada has extensive mining operations that extract gold, silver, copper, diatomite, lime, sand, and gravel (NVMA 2020, USGS 2020). The mining sub-sector consumed over 36.5-66.4 million GJ in the late 2010’s (including energy from grid electricity) (Evolved Energy 2020, TNC NV 2018) and generated over $8B in 2019 (USGS 2020), the highest amount of any state.
Projection out to 2050 is difficult due to many uncertainties. Will current trends maintain the same trajectory? Will projects require different levels of economic investment? What impacts might the actions and decisions (political and otherwise) of neighboring states have on the state? And how might priorities shift due to climate feedback events? To address these inherent uncertainties, we define a business-as-usual scenario and four unique decarbonization scenarios with progressive assumptions and actions:
- Business-as-Usual (BAU) Scenario. In this “pre-baseline” case, all growth trajectories are held at pre-goal levels.
- Baseline Scenario. In the baseline case, a call to action has been established, but movement proceeds without urgency.
- Low-Optimistic Scenario. In this scenario, actions are notably more aggressive than in the baseline.
- High-Optimistic Scenario. This scenario represents extreme action, fueled by compliance mandates and aggressive initiatives, likely backed by strong governmental support.
- Best-Case Scenario. This borderline fictitious scenario is designed to represent the incremental extension of the high-optimistic scenario to ideal conditions (e.g., electrification of homes and businesses achieves 100%, ICEVs are fully replaced by EVs, etc.)
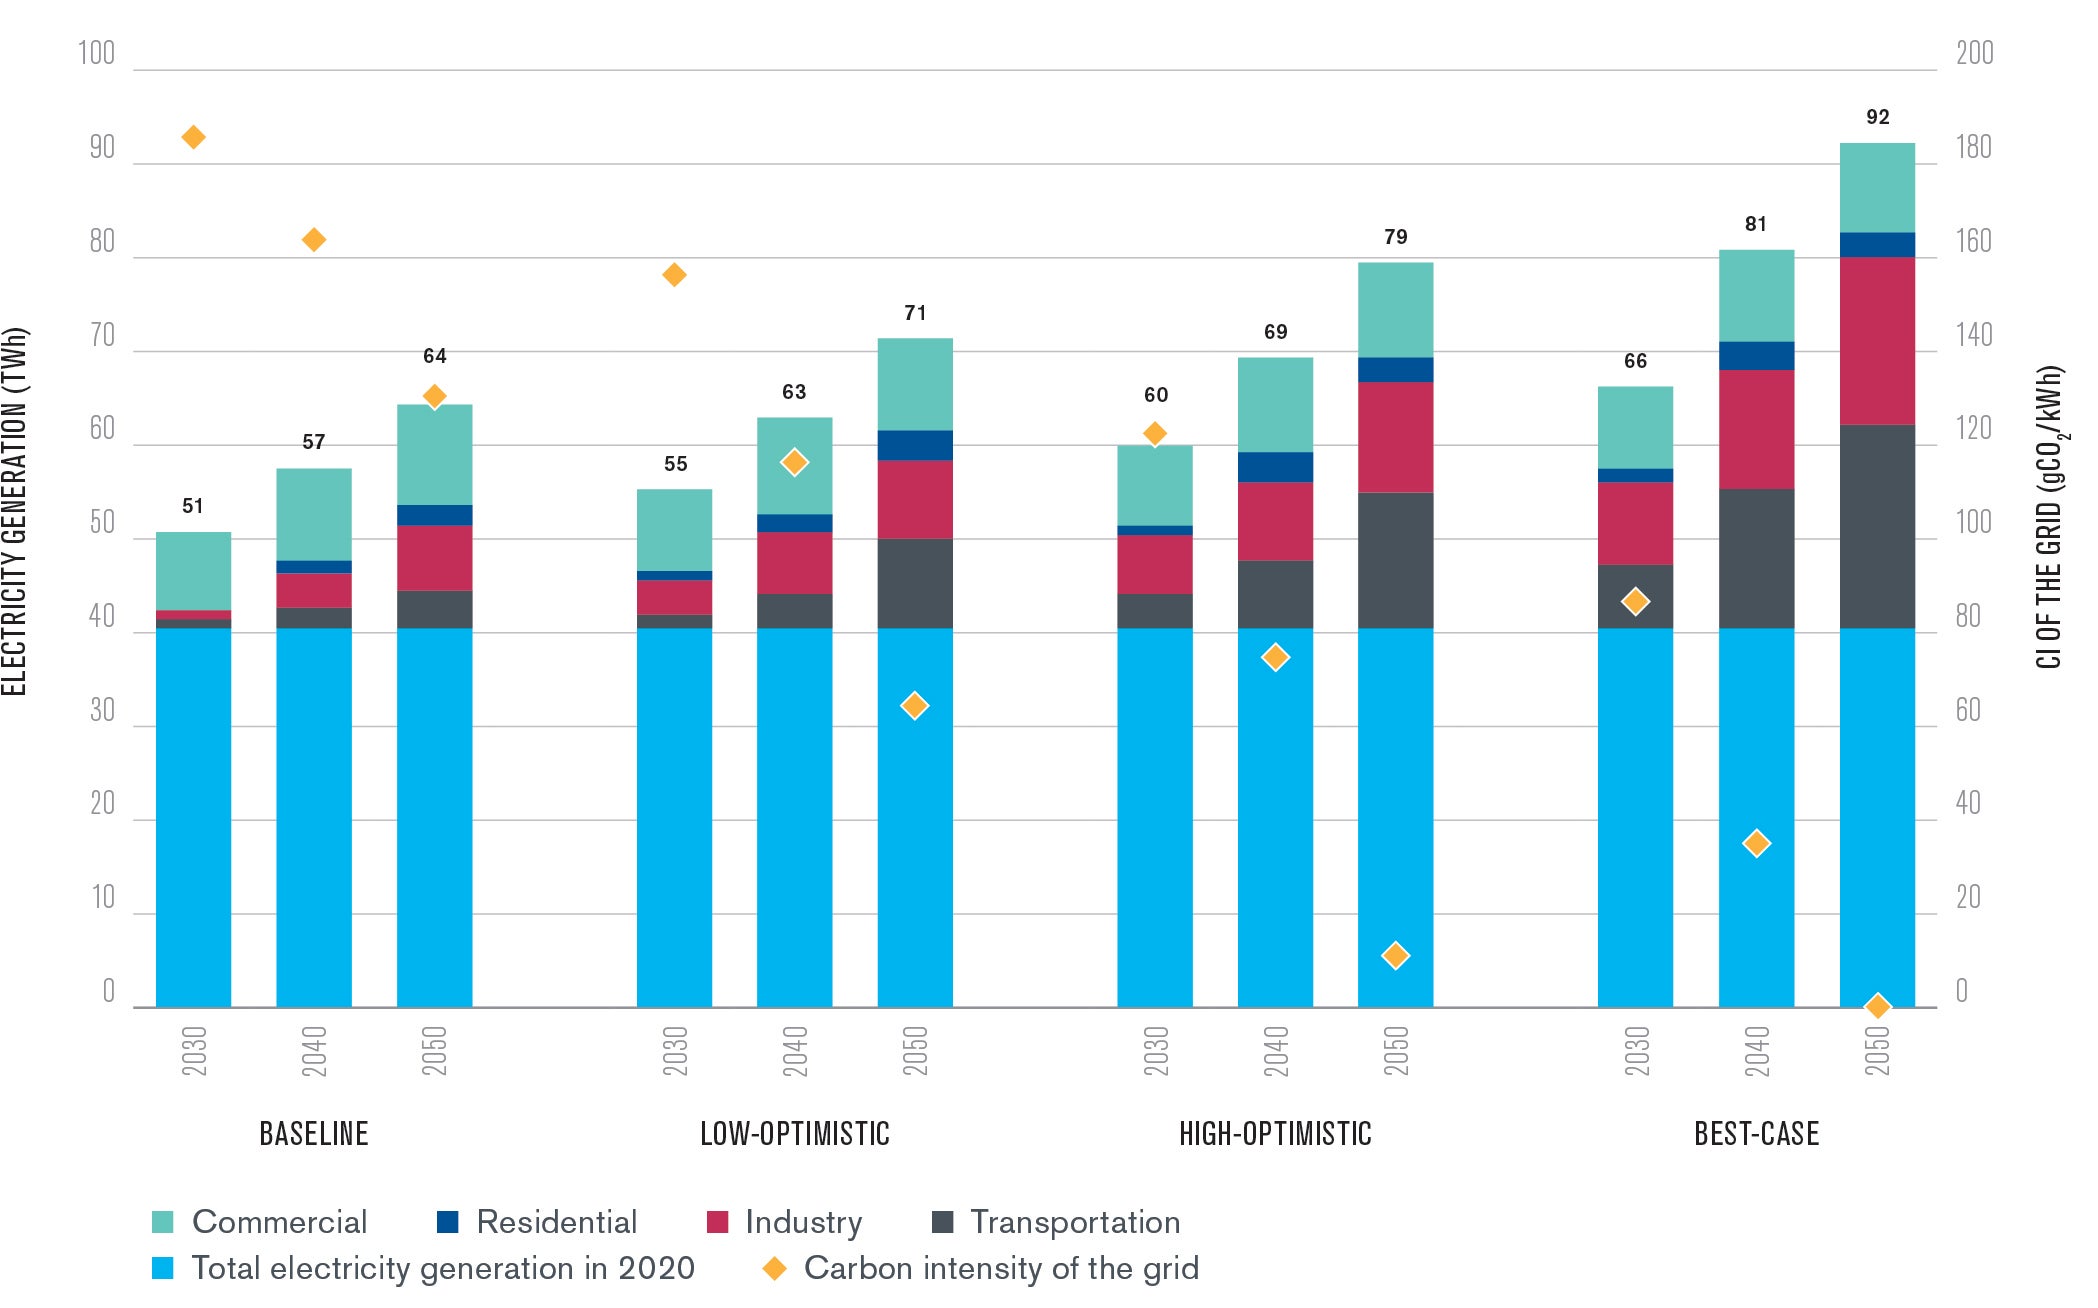
Since many strategies in the transportation, building, and industrial sectors rely on increased electrification, it is essential to monitor this growth in demand with respect to land usage and transmission build-out. Figure 4 shows electricity demand with projected grid carbon intensity over four scenarios. Under aggressive decarbonization scenarios, demand for electricity in 2050 requires a doubling of current capacity. To achieve net zero, the grid carbon intensity, or the amount of carbon emitted from electricity generation, will need to approach zero, or increased amounts of CDR will be called on to make up the difference. Many of the CDR solutions are also very energy intensive and will not only compete for resources but also require a very low carbon intensity energy source to maximize net removal of atmospheric CO2. By 2050, 5-33 GW of new capacity will need to be deployed to meet the utility needs alone. An additional 1-37 GW will be needed to supply DAC facilities. Because of the variability in capacity factor among renewable energy sources and because more aggressive deployment of renewable energy to supply utilities would require less DAC and vice versa, the total additional capacity to meet net-zero goals is estimated to 12-51 GW.
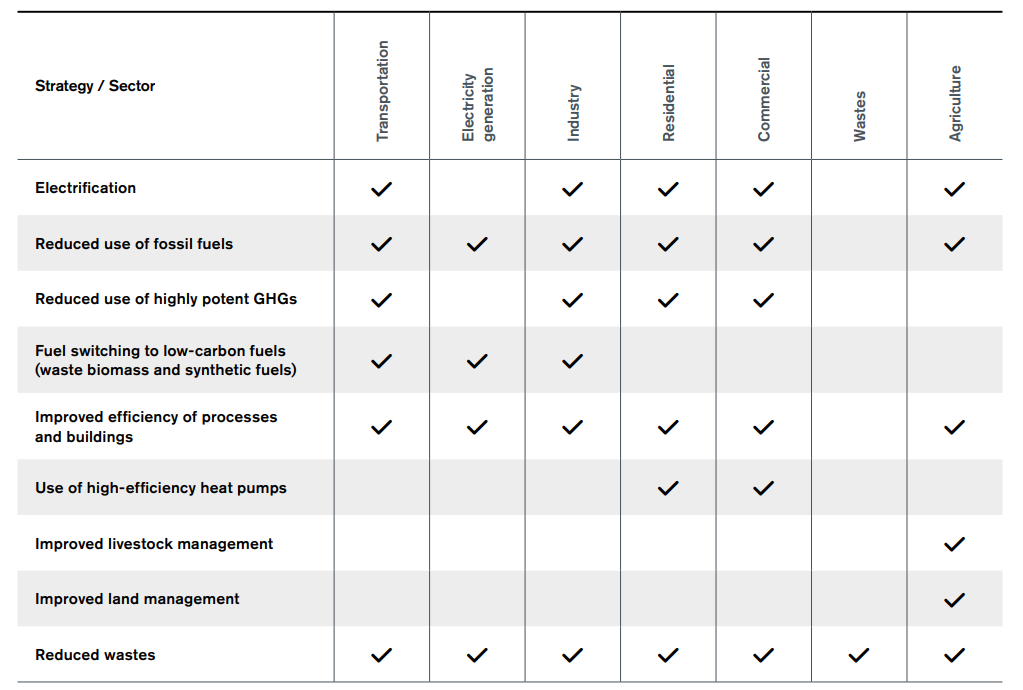
Other strategies to reduce carbon emissions include improving the efficiency of processes and buildings, reducing the amount of waste produced, and reducing the use of highly potent GHGs in cooling systems (Table 1).
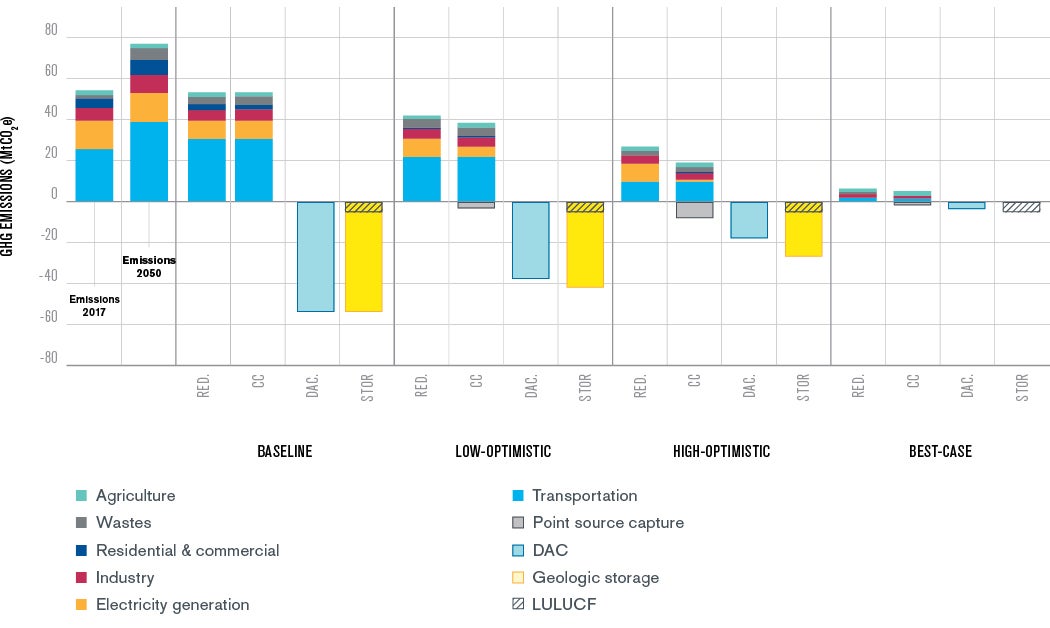
Major CO2 emitters like natural gas power plants and cement and lime facilities can be retrofitted with carbon capture to avoid releasing most of their CO2 into the atmosphere. Making these improvements could capture up to 8.3 MtCO2 in Nevada. We view direct air capture of carbon (DAC) as a complement to other decarbonization strategies and it is required in all the scenarios we considered to reach net-zero emissions in 2050. The amount of carbon that would need to be captured by DAC varies from a minimum of 4.3 MtCO2/yr (if significant progress is achieved using other strategies) to 49.6 MtCO2/yr (if little effort is made using other decarbonization strategies) (Figure 5).
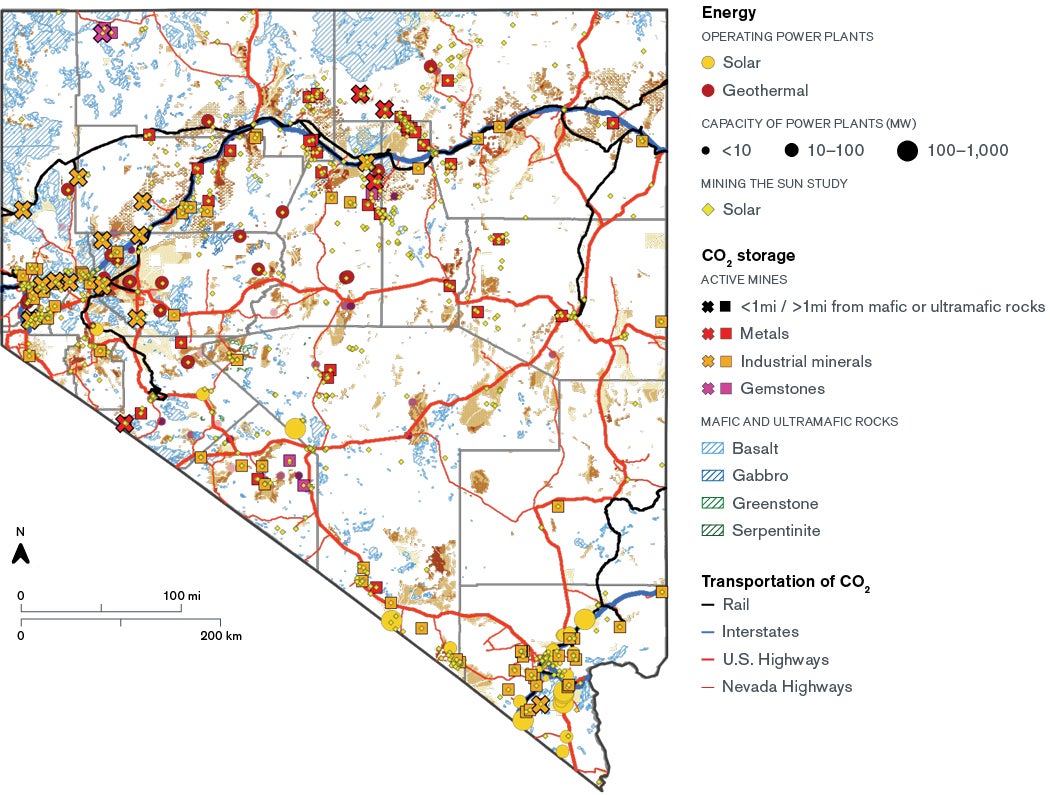
To maximize climate impact, captured CO2 should be stored permanently and securely. One option is injection in the subsurface of sedimentary basins or basaltic formations, while another is carbon mineralization with alkaline materials, such as industrial wastes, mine tailings, or rocks. Carbon mineralization of industrial wastes such as cement kiln dust and lime kiln dust could store about 50 ktCO2/yr, and mineralization of mine tailings at three major mines could store about 23 ktCO2/yr. This is about two orders of magnitude below the needed amount of CO2 storage in the state, but Nevada has geologic formations that could be used for in-situ storage of CO2 or ex-situ carbon mineralization (Figure 6).
Due to the large mining industry in Nevada, there may be tailings with the appropriate chemical composition that would react with CO2 and store it in the form of carbonates. Research is needed to develop carbon mineralization processes and evaluate the geologic storage potential for both subsurface CO2 injection and surface carbon mineralization processes; this research will be a key part of assessing in-state options for permanent storage. Alternative large capacity options that require less investigation might be available sooner in neighboring states, such as California and Oregon.
Ensuring Equitable and Just Transitions
While much of the strategic modeling of CCS and CDR deployment has focused on techno-economic impact categories, these types of analyses can overlook the cumulative social and environmental impacts of these approaches. Many of the strategies identified in this study could place increasing stress on marginalized populations.
For example, fossil-fueled and biomass-fueled cooking are major sources of indoor air pollutants and switching to electric-based and induction cooktops is an important step for the decarbonization of residential and commercial buildings. But these options are often more expensive than their fossil-fueled counterparts. Without support, cleaner technologies will likely remain out of reach for low-income households. It is also important to consider how the cost burden is distributed for residual fossil infrastructure (for generation and distribution), as more residents shift away from natural gas usage.
Implementation of more robust public transportation can help reduce light-duty vehicle miles traveled and benefit members of lower income communities who cannot afford a personal vehicle. Advancements in other technologies, like high-speed trains or hyperloops, could help reduce aviation-related traffic, with a concurrent decrease in emissions in the areas surrounding airports—which are typically lower income neighborhoods.
Care must be taken to ensure that placement of CDR within the state avoids potential harms to local ecosystems and communities (Batres et al. 2021). Several CDR options require large amounts of land and water, which could displace local biodiversity or divert resources from other needs. CDR siting should leverage existing resources and infrastructure, if possible, but we must examine the indirect upstream and downstream impacts. A CO2 pipeline could present issues in routing with respect to protected lands. Siting also raises environmental justice questions, as some communities can exert their political will and capital to sustain NIMBY resistance, while others cannot.
Policy Implications
Our report suggests that while Nevada is not on track to meet its own climate goals under current efforts, there are technological solutions that can bridge the gap—with proper political support.
Given the dependence on electrification as a strategy across most sectors, it makes sense to design, plan, and build electrical infrastructure to support carbon management goals. This requires massive investment in electricity generation, storage, transmission, and delivery systems. To that end, the landmark Infrastructure Investment and Jobs Act (IIJA) enacted in 2021 provided $21.3 billion to support the delivery of clean power and $21.5 billion for clean energy demonstration projects, including $84 million for geothermal R&D, $60 million for new and improved solar R&D, and $70 million for wind technology R&D. To stimulate carbon capture technologies, the Act allocated $6.9 billion for carbon capture hubs, demo projects and pilot programs, 2.5 billion of carbon storage validation and testing and $2.1 billion for CO2 pipeline infrastructure and finance programs (H.R. 3684 2021).
If enacted, the proposed Build Back Better Act would further enhance federal investment by extending the investment and production tax credits for renewable energy projects. This is another important policy measure for stimulating development of renewable energy and carbon capture infrastructure.
Another substantive barrier exists in siting renewable energy. For instance, The Nevada Independent has reported that the Bureau of Land Management (BLM), which manages more than 63% of Nevada’s land, has implemented procedures tailored toward permitting solar projects, but cost and land use conflicts have stalled the development of renewable energy on public lands (Rothberg 2019). The Energy Policy Act of 2020, which mandates that the Department of Interior permit 25 GW of renewable energy on public lands by 2025, has led to a surge in pursuit of available acreage for solar development in Nevada (H.R. 133 2020). Proper oversight could be managed through establishment of Renewable Energy Coordination Offices, as required in the Energy Policy Act, to assist in planning and coordination of renewable energy development on public lands.
Nevada is home to numerous opportunities in the form of potential mining lands and brownfield sites that could be developed for renewable energy. These sites could also potentially provide storage for CO2, either as sources of suitable feedstock or as disposal sites for the stable carbonated rocks; hence, it is important for the U.S. EPA and the IRS (in response to credit eligibility under 45Q which pays up to $35 per tonne of CO2 used beneficially and $50 per tonne stored underground) to issue firm guidance on how and when mining waste may be used for carbon storage. The USE IT Act, which encourages research and development (R&D) in CCUS and supports federal, state and non-governmental planning and development of CCUS facilities and infrastructure, could support research in the conversion of CO2 and industrial waste to carbonates, making the process more economic and able to incorporate a wider variety of feedstocks (S. 383 2019).
Carbon pricing, both within the state and in neighboring states, has the potential to help Nevada reach its emission goals. Currently, twelve U.S. states implement carbon pricing, including California’s cap-and-trade system. Revenue created under such a system can be redirected to other emission reduction strategies or used to help achieve equitable transitions, for instance to help multi-family housing participate in residential solar planning.
California’s cap-and-trade system requires that 35% of all revenue generated be redirected to environmentally disadvantaged and low-income communities (C2ES 2011). The measures taken by a neighboring state such as California can have a direct impact on Nevada’s climate goals: roughly 85% of Nevada’s consumed energy is imported from out of state (EIA 2021). Likewise, aggressive measures taken by neighboring states can potentially induce economic leakage into Nevada to escape progressive emission restrictions and cost-prohibitive CCS installations. Conversely, Nevada can incentivize carbon capture on its point-source emitters by providing low interest loans for CCS retrofits and should consider a progressive carbon pricing scheme to help support an equitable transition. As a member of the U.S. Climate Alliance (USCA), Nevada can leverage the USCA Impact Partnership to adopt best practices in deep decarbonization and CCUS policy implementation.
Policy guardrails are critical to ensuring that environmental justice concerns remain central in any net-zero policy. Low-income communities often cannot afford the additional costs of electrification, which can delay emissions reductions. As Nevada expands and modernizes its electricity grid and adopts carbon management goals, care should be made to shield at-risk communities from undue financial burden and avoid unjust outcomes. As Nevada designs a carbon reduction plan, it should include an assessment of the potential environmental justice issues that may arise from the deployment of clean energy and carbon capture technology.
Read the Full Paper
Want to dive into this research more? Read the full paper prepared by The Nature Conservancy in Nevada.
Read the Paper

Hélène Pilorgé
Research Associate, Clean Energy Conversions LabHélène Pilorgé is a research associate at the Clean Energy Conversions Lab at the University of Pennsylvania.

Caroline Magdolen
Student Advisory Council MemberCaroline Magdolen is a Kleinman Center Student Advisory Council Member and an undergraduate student studying in the Vagelos Integrated Program in Energy Research (VIPER) program. Magdolen was also a 2021 Undergraduate Seminar Fellow.

Samuel Layding
Doctoral CandidateSamuel Layding is a doctoral student in department of chemical and biomolecular engineering at the School of Engineering and Applied Sciences.

Peter Psarras
Research Assistant Professor of Chemical EngineeringPeter Psarras is a research assistant professor in chemical and biomolecular engineering at the School of Engineering and Applied Sciences and the Kleinman Center for Energy Policy.

Jaina Moan
Nevada External Affairs Director, The Nature ConservancyJaina Moan is the Nevada external affairs director and climate action lead for The Nature Conservancy, based in Las Vegas, Nevada. Her environmental career includes many roles—from scientist to program director.
Acknowledgments
This policy digest and the research behind it would not have been possible without the support of The Nature Conservancy in Nevada. We would like to thank John Zablocki for his original vision and his contributions to the research questions and approach. We appreciate the contributions of subject matter experts including Dr. James E. Faulds at the Nevada Bureau of Mines and Geology, Lucia M. Patterson at the Nevada Division of Minerals, and Allen Biaggi at the Nevada Mining Association. Jim, Allen, and Lucia, we thank you for your time, information, and expertise. We want to thank Tanya Anderson, Sara Cobble, Heather Sisan, for their review and contributions to the draft report.
Batres, Maya, Frances M. Wang, Holly Buck, Rudra Kapila, Ugbaad Kosar, Rachel Licker, Deepika Nagabhushan, Ester Rekhelman, and Vanessa Suarez. 2021.“Environmental and Climate Justice and Technological Carbon Removal.” The Electricity Journal 34 (7), 107002. https://doi.org/10.1016/j.tej.2021.107002.
Center for Climate and Energy Solutions (C2ES). 2011. “California Cap and Trade.” https://www.c2es.org/content/california-cap-and-trade/ (accessed 2/21/22).
NV AB465, 80th legislature. 2019. “Establishes Provisions Relating to Solar Energy.” (BDR 58-872). https://www.leg.state.nv.us/App/NELIS/REL/80th2019/Bill/6889/Overview (accessed 2/21/22)
Evolved Energy, GridLab, Natural Resources Defense Council, Sierra Club. 2020. Pathways and Policies to Achieve Nevada’s Climate Goals: An Emissions, Equity, and Economic Analysis. https://gridlab.org/works/achieve-nevadas-climate-goals/ (accessed 3/8/22).
Greenhouse Gas Protocol (GHGP). 2015. “A Corporate Accounting and Reporting Standard”. Revised edition. https://ghgprotocol.org/corporate-standard (accessed 7/19/21).
H.R. 133, 116th Congress, Division Z – Energy Act of 2020. 2019-2020. https://www.aip.org/sites/default/files/aipcorp/images/fyi/pdf/energy-act-of-2020.pdf (accessed 3/8/22).
H.R. 3684, 117th Congress, Infrastructure Investment and Jobs Act. 2021-2022. https://www.congress.gov/bill/117th-congress/house-bill/3684/text (accessed 3/8/22).
Iowa State University. 2010. “Urban Percentage of the Population for States, Historical.” https://www.icip.iastate.edu/tables/population/urban-pct-states (accessed 7/14/21).
National Renewable Energy Laboratory (NREL). 2010. “Solar Resource Maps and Data.” https://www.nrel.gov/gis/solar-resource-maps.html (accessed 7/3/21).
Nevada Association of Counties (NACO). 2020. “Public Lands.” https://www.nvnaco.org/advocacy/public-lands/ (accessed 7/14/2021).
Nevada Bureau of Mines and Geology (NBMG). n.d. “Active Mines and Energy Producers.” https://gisweb.unr.edu/activemines/ (accessed 7/23/21).
Nevada Department of Transportation (NV DOT). 2020. “Statewide Routes.” https://geohub-ndot.hub.arcgis.com/datasets/NDOT::statewideroutes/about (accessed 7/11/21).
Nevada Division of Environmental Protection (NDEP). 2020. “Nevada Statewide Greenhouse Gas Emissions Inventory and Projections, 1990-2040.” https://ndep.nv.gov/air/air-pollutants/greenhouse-gas-emissions (accessed 3/8/2022).
Nevada Mining Association (NVMA). 2020. “Data and Analysis.” https://www.nevadamining.org/faqs/analysis/ (accessed 6/30/21).
National Oceanic and Atmospheric Administration (NOAA) National Centers for Environmental Information. 2021. “State Climate Summaries: Nevada.” https://statesummaries.ncics.org/chapter/nv/ (accessed 7/14/21).
Pilorgé, Hélène; Noah McQueen, Daniel Maynard, Peter Psarras, Jiajun He, Tecle Rufael, and Jennifer Wilcox. 2020. “Cost Analysis of Carbon Capture and Sequestration of Process Emissions from the U.S. Industrial Sector.” Environmental Science & Technology 54 (12): 7524–7532. https://doi.org/10.1021/acs.est.9b07930.
Psarras, Peter, Jiajun He, Hélène Pilorgé, Noah McQueen, Alexander Jensen-Fellows, Kourosh Kian, and Jennifer Wilcox. 2020. “Cost Analysis of Carbon Capture and Sequestration from U.S. Natural Gas-Fired Power Plants.” Environmental Science & Technology 54 (10): 6272–6280. https://doi.org/10.1021/acs.est.9b06147.
Rothberg, D. 2019. “Large-Scale Solar, Wind and Geothermal Developers Hit Project Headwinds on Public Land.” The Nevada Independent (April 1st). https://thenevadaindependent.com/article/large-scale-solar-wind-and-geothermal-developers-hit-project-headwinds-on-public-land (accessed 2/21/22).
State of Nevada Department of Taxation (SNDT). 2021. “Nevada County Population Projections 2021 to 2040.” https://tax.nv.gov/Publications/Population_Statistics_and_Reports/ (accessed 3/8/2022).
State of Nevada Department of Taxation (SNDT). 2020. “Population Statistics and Reports.” 2020 Governor’s Certified Series. https://tax.nv.gov/Publications/Population_Statistics_and_Reports/ (accessed 2/7/2022).
383, 116th Congress, USE IT Act. 2019-2020. https://www.congress.gov/bill/116th-congress/senate-bill/383″>https://www.congress.gov/bill/116th-congress/senate-bill/383 (accessed 3/8/22).
The Nature Conservancy Nevada (TNC). 2018. “Mining the Sun.” https://www.arcgis.com/apps/webappviewer/index.html?id=43dca1562b00488c87ce6478d7cb0bf3 (accessed 7/14/21).
United States Department of Energy (DOE). Office of Efficiency and Renewable Energy. 2018. “Geothermal Maps.” https://www.energy.gov/eere/geothermal/geothermal-maps (accessed 7/3/21).
United States Department of the Interior (DOI). Bureau of Land Management. n.d. “BLM Nevada History.” https://www.blm.gov/about/history/history-by-region/nevada (accessed 7/14/21).
United States Department of Transportation (US DOT). Bureau of Transportation Statistics. n.d. “Geospacial at BTS Open Data Catalog.” https://data-usdot.opendata.arcgis.com/ (accessed 8/3/21).
United States Energy Information Administration (EIA). 2021. “Nevada State Profile and Energy Estimates.” https://www.eia.gov/state/?sid=NV (accessed 3/8/22).
United States Environmental Protection Agency (EPA), 2019, “Sources of Greenhouse Gas Emissions.” https://www.epa.gov/ghgemissions/sources-greenhouse-gas-emissions (accessed 3/8/22).
United States Geological Survey (USGS). 2016a. “GAP/LANDFIRE National Terrestrial Ecosystems 2011.” https://www.sciencebase.gov/catalog/item/573cc51be4b0dae0d5e4b0c5 (accessed 7/14/21).
United States Geological Survey (USGS). 2016b. “Mineral Resources Data System.” Retrieved from: https://mrdata.usgs.gov/mrds/. (accessed 3/8/22)
United States Geological Survey (USGS). 2020. “USGS Mineral Commodity Summaries 2020.” https://pubs.usgs.gov/periodicals/mcs2020/mcs2020.pdf (accessed 6/15/21).
World Atlas. 2019. “States that Receive the Least Amount of Rain.” https://www.worldatlas.com/articles/the-10-driest-states-in-the-united-states-of-america.html (accessed 7/14/21).
World Resources Institute (WRI). 2021. Global Power Plant Database. https://datasets.wri.org/dataset/globalpowerplantdatabase (accessed 3/8/22).
