Impact of Solar Lighting Kits on the Lives of the Poor
Solar kits in rural Ghana slashed energy costs, boosted student performance, and led to more than a 200% return on donor investment—proving light can truly power lasting change.
At A Glance
Key Challenge
This study tackled the challenge of providing clean, affordable lighting to off-grid, low-income households who rely on costly and harmful energy sources.
Policy Insight
Subsidizing or donating solar kits yields high social and economic returns, making it a cost-effective policy to improve well-being and drive rural development.
Motivation
Light is a necessity of life. Currently, one tenth of humankind, and specifically half of Africa, does not have access to electricity and is constrained to live without clean and reliable lighting sources. These low-income households predominantly rely on either flame-based solutions (e.g., kerosene) or battery-based solutions (e.g., flashlights) for their lighting needs, but these solutions can be unreliable, harmful to health, and costly in the long run.
Grid-based lighting solutions are ideal, but extending grid to remote rural populations is capital-intensive. Even if the grid is extended, one may not be able to afford the connection fee because of severe cash constraints. Recognizing this plight, there has been an emergence of several off-grid lighting solutions in these countries, ranging from small to large solar home systems with televisions and fans.
There are private firms that sell these technologies, and there are organizations that donate these solutions free of charge. We ask a question that is pertinent to these parties: to what extent an off-grid lighting technology can impact the lives of the poor, specifically their economic and educational outcomes and their overall well-being?
We are particularly interested in examining the magnitude of impact that realizes in the lives of low-income households if they could access light without any monetary constraints. The findings from such a study will be of immediate interest to donor organizations. Understanding the full potential of impact will also guide private firms and policymakers to design better pricing schemes and energy policies.
As part of our study, we distributed solar lighting kits free of cost to rural Ghanaian households and recorded a variety of impact variables for a duration of one year. The kits varied in their configurations, which allowed us to examine differential impacts of the quality of lighting source on different outcomes of interest. We next discuss the details of our field experiments, and then present our findings.
Field Experiments
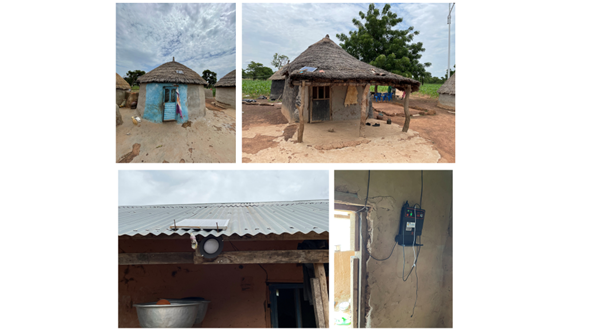
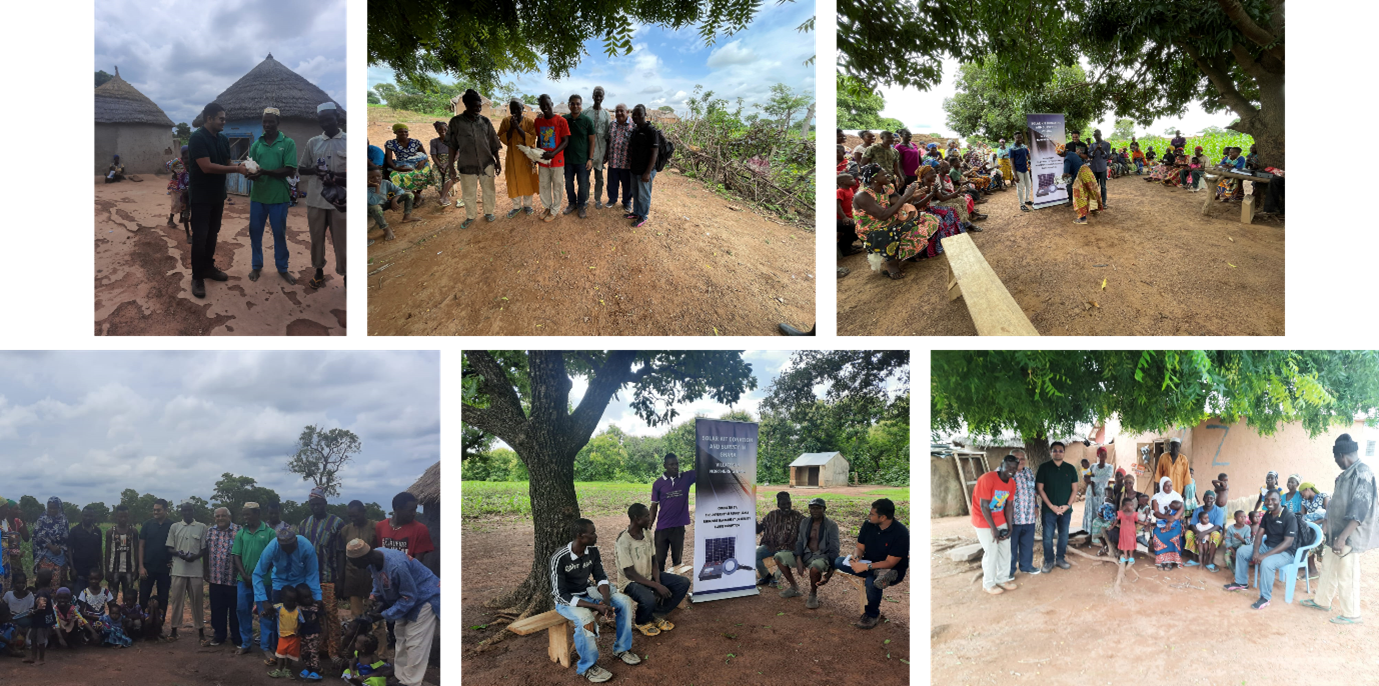
The exogenous variations in our experiments were operationalized through differently configured solar lighting kits. Depending on the configuration, the kit provides either brighter or dimmer light and had one or more bulbs. To obtain such customized kits, we collaborated with Elumis Foundation (a non-profit organization) and JUA Energy (the manufacturer of solar kits). Each kit came with a solar panel, bulbs, and a battery with two additional USB ports that could be used to charge any compatible devices (e.g., mobile phones, radios, batteries). The subsidiary of Elumis Foundation in Ghana provided us with field officers necessary to conduct the study.
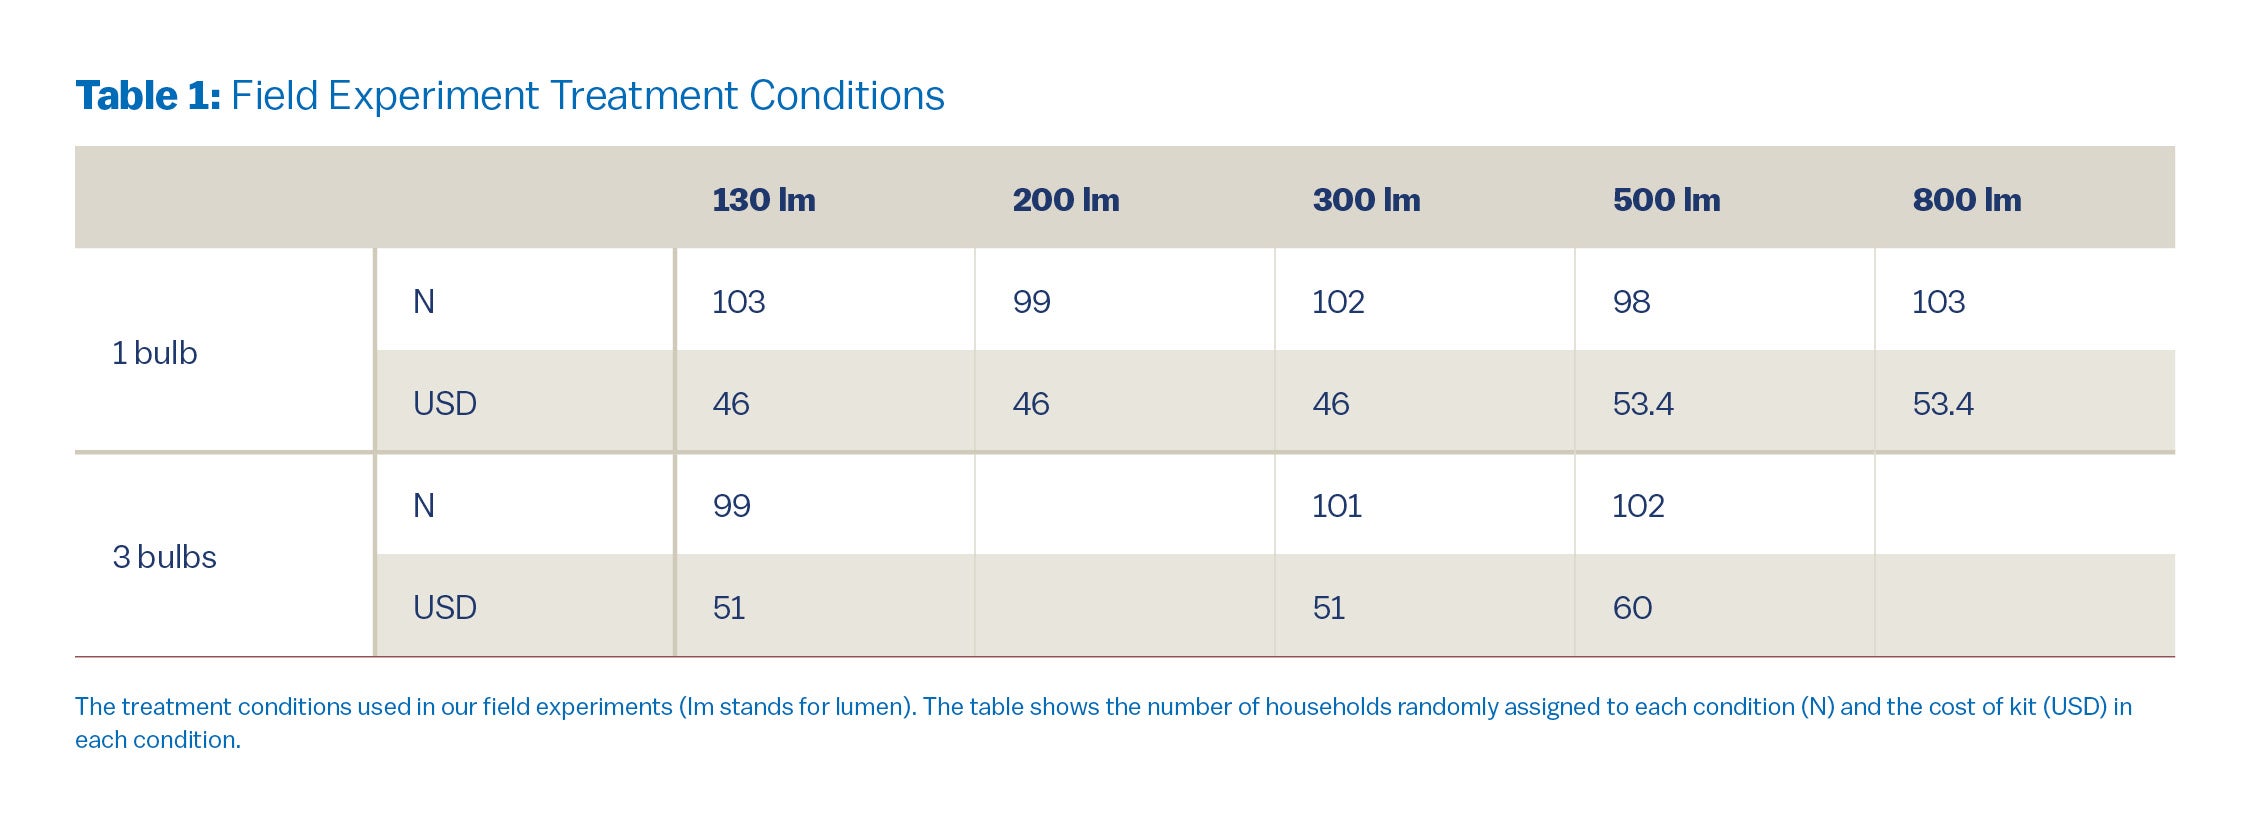
We used eight treatment conditions in our field experiments, see Table 1 below. We varied the brightness levels over a wide range, from 130 lumens, close to the brightness level of smaller solar lamps that are currently sold, to 800 lumens, close to the brightness level of a low-end tube light. In all the treatment conditions, the battery in the kit was sized such that, when fully charged, it can provide at least eight hours of light, and the panel is sized such that the battery is fully charged within six hours.
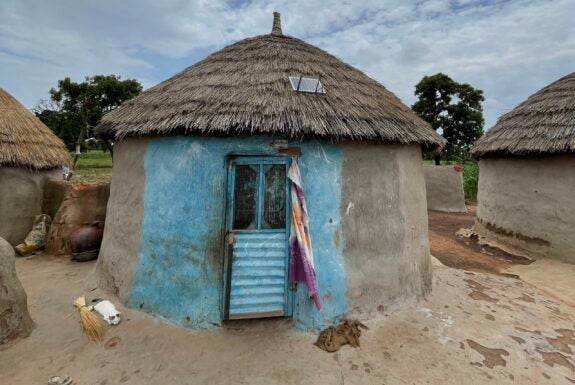
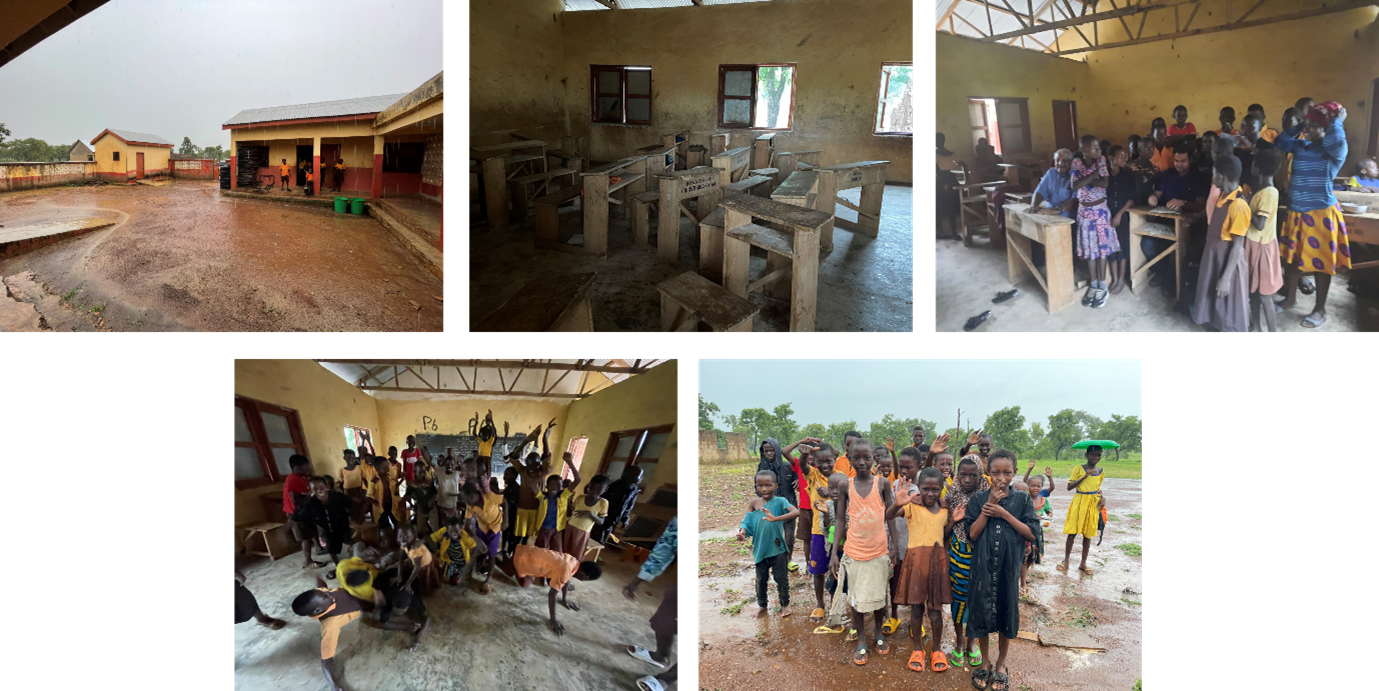
The timeline of our study was as follows. We conducted a scoping study in 2021 to identify potential research sites. We required a population that was living off the grid, relied on traditional unclean lighting sources, and was willing to participate in our study. We then selected 32 villages with similar characteristics in the northern part of Ghana. All the villagers were farmers.
Along with the treatment group that received kits, we also included a control group in our study which was not offered any kits. The randomized assignment was at the village level to treatment and control groups, and at the household level to multiple treatment conditions within the treatment group. Specifically, of 32 villages, 26 villages (containing 807 households) were randomly assigned to the treatment condition and six villages (with 197 households) to the control condition. Within the treatment group, Table 1 shows the number of households (N) that were randomly assigned to each treatment condition (with on average 100 households per condition), and the costs in USD per kit for each configuration.
The solar kits were manufactured and transported by JUA Energy to Ghana by the end of 2021. Our field officers started installing the kits in treatment households in April 2022, and the installation finished by May 2022. Simultaneously, we conducted our baseline survey that recorded the living conditions of both the treatment and control households at the beginning of the study.
Thereafter, our field officers visited all the households every month to collect different types of data until June 2023. We conducted surveys that recorded several impact variables for both treatment and control groups. The main variables include: (i) energy-related expenditures, (ii) health issues that they may have experienced, (iii) expenses on other categories such as food, farming, and education, and (iv) the daily routines of the individuals in the household. We also collaborated with local schools to obtain data on children’s attendance levels and examination scores.
We secured IRB approvals and obtained consent from the households for data collection and processing. To incentivize regular participation of control households, we provided them with some daily necessities, alternating between rice, chocolate milk powder, oil, and soaps. The quantities were small, and the households were not informed in advance of what they will be offered, so we believe this incentive scheme does not systematically introduce biases in their planning or expenditure decisions.
Findings
We now present a summary of our findings from a preliminary analysis of our data sources, along with some anecdotes from our field visits. For most of our discussion, we combine all the treatment conditions in Table 1 into one treatment group and compare it with the control group. (The reason will be evident later.)
Impact on Energy Expenditure
The primary impact of a solar lighting kit is on the purchase and usage of other lighting sources: flashlights, batteries, and smaller solar lamps. (The households in our study stopped using kerosene for lighting purposes much before the start of the study.) The solar kit also has USB ports, so it affects the purchases of other USB-compatible devices (e.g., radios and rechargeable flashlights).
Moreover, before the intervention, the households had to recharge their mobile phones frequently at stores in the village because there was no energy source at home. But with solar kits, the treatment households could recharge their mobile phones at home using the USB port, so we expect a decrease in mobile recharge expenses.
Figure 1 displays average expenditures in the local GHS currency on all these categories per household, for the treatment and control groups. The numbers are displayed at a quarterly level. Quarter 1 represents January–March of 2022, which is before the intervention, representing the status at the baseline. Quarter 6 represents April–June of 2023, the last quarter of our study.
In quarter 1, the treatment and control groups start at almost the same values in all the panels of Figure 1, indicating that both the groups were similar at the beginning of the study. Starting quarter 2, the expenditures on flashlights, batteries, solar lamps, and public mobile recharges decrease over time for the treatment group when compared to control group. We find from a regression analysis that the treatment households saved an average 250 GHS per quarter for these categories in total. (All the effects that we present in this report are statistically significant.)

We also see from the last panel of Figure 1 that simultaneously the treatment group increased its expenditure on USB-compatible devices (mainly, flashlights and radios, and USB cables) by an average 30 GHS per quarter compared to the control group. This allows treatment households to replace the traditional battery-based devices with devices that could be recharged using the USB ports in their homes. The expenditure on USB devices was uniform across all the treatment conditions. These devices acted as complements to the solar kit; they provided more light for the needs within the house as well as outside; for example, farmers could use these flashlights for farm-related activities or commutes in the early-morning and late-night times. This complementarity diluted the difference between 1-bulb vs 3-bulb configurations in our study.
Moreover, when a low-brightness bulb is paired with another flashlight, the overall brightness increases, which dilutes the difference between the brightness conditions in our experiment. Therefore, different treatment conditions resulted in almost similar impact on the variables of interest; that is why we combine them all into one group.
Impact on Other Dimensions
Figure 2 displays expenditure on (i) food items, which includes fruits and vegetables, meat, eggs, flour, and cooking oil, and (ii) temptation items, including bottled soft drinks, alcohol, cigarettes, and snacks from outside. We see that the expenditures largely remain the same across treatment and control groups (also confirmed by a regression analysis), which means that the money saved from energy expenditures is not spent by the treatment households on food, alcohol, cigarettes, and junk food. (Note that the general increasing trend in the expenditures that we see in Figure 2, for both treatment and control groups, is due to the recent currency devaluation in Ghana, which shot up the prices of several items all over the country.)

Figure 3 displays expenditures on two more categories: transportation (both public and private) and medicines. Each household in our sample owns one or two mobile phones, which are recharged at least three times in a week. The consumers travelled to a recharge center (e.g., a retail store) to get their mobiles recharged, which was not necessary after the intervention. So, as we see in the first panel of Figure 3, the transportation expenditure of treatment households is on average 20 GHS lower per quarter than that of control households.
Moreover, having light in the house in the nighttime helps repel mosquitos and prevents reptilian attacks. There were lower numbers of malaria cases, and snake- and scorpion-bite incidents in the treatment households when compared to control households. Therefore, the expenditure on medicines is also lower in the treatment group; see the second panel of Figure 3 – the treatment group spends on average 10 GHS lower per quarter on medicines.

The surveys as well as anecdotes from our field visits suggest an improvement in the overall well-being of the treatment households after the solar kits. There was less theft in the villages. People were able to identify strangers easily and deal with them accordingly. Some people also mentioned that they have a better level of self-esteem and that their village looks much brighter now as if they have electricity.
Earlier, people used to sleep around 7‒8 PM and wake up around 6‒7 AM, following sun’s cycle. Now, people sleep around 11 PM or later and wake up around 5‒6 AM. The extra hours are used for household chores, farming-related activities at home, socializing, and helping children do homework. Of course, there is potentially the effect of less sleep which may have long-term effects that we do not measure.
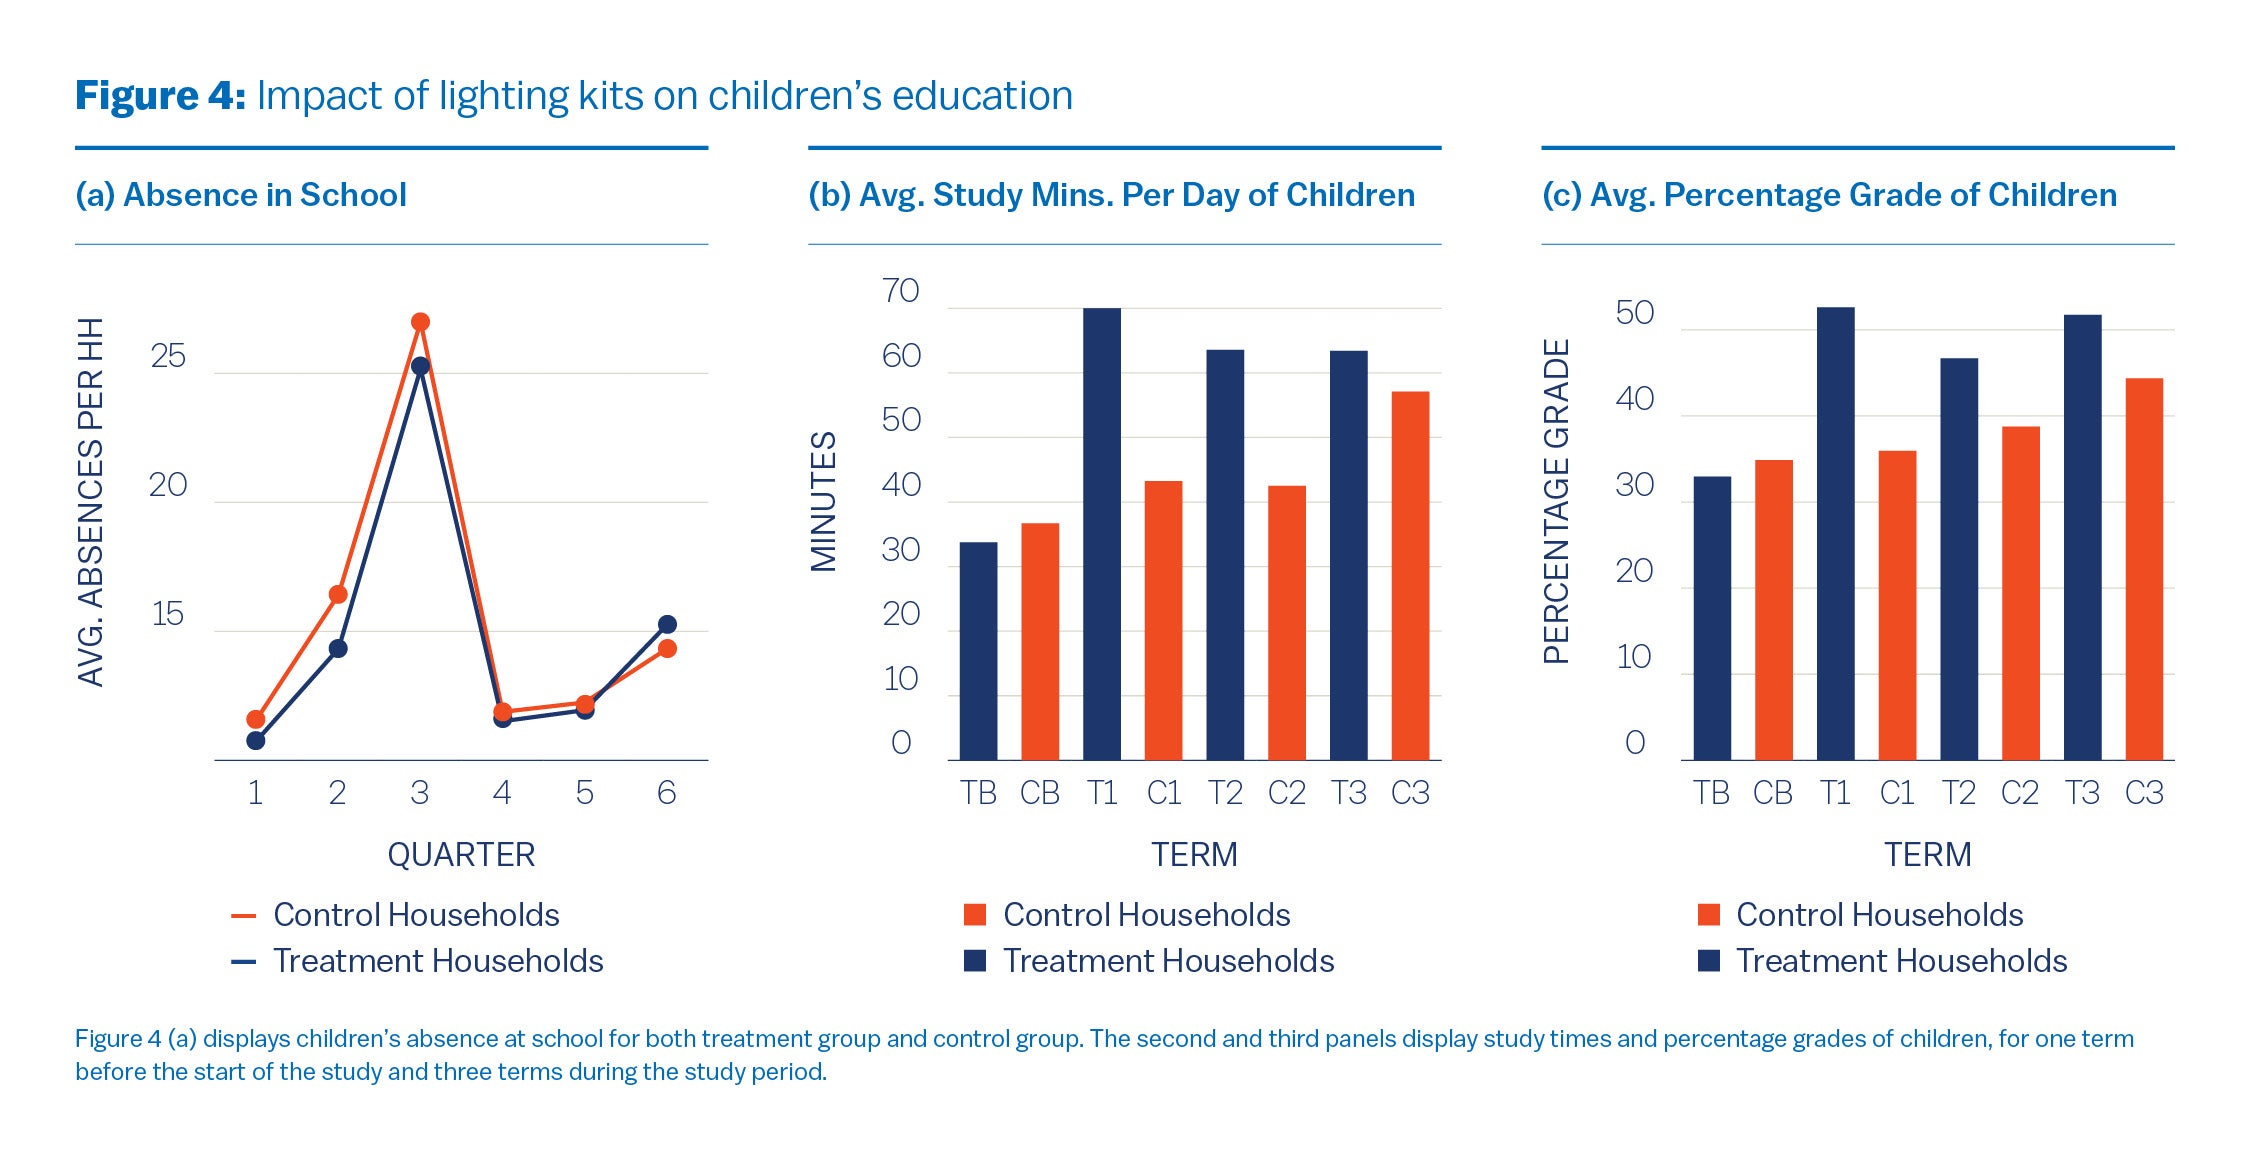
Figure 4 displays impact on children’s education. The first panel shows the average number of days per quarter a child was absent at school, averaged over all the children in the household. We see no significant difference between the absenteeism of children from the two groups. The commonly cited reasons for absenteeism are rains and illness.
The second and third panels show the time spent by children studying at home and their grades (percentage points) in the term before the start of our study (denoted as TB for treatment and CB for control) and in the three academic terms after our intervention (denoted as T1, C1, and so on). The numbers are averaged over all the children at home. The children from the two groups spent almost the same amount of time studying and scored similarly before the intervention, but the treated children spent, on average, 20 minutes longer studying and scored 13 percentage points higher than the children in the control group after the intervention. The effect was stronger on the children who were performing relatively poorly at the baseline.
In the schools that we visited in the field, headmasters observed that the solar kits have improved students’ performance in the classroom. The students expressed themselves better, finished their homework regularly, and experienced fewer sick days.
The students themselves gathered their exercise books and gave them to the teachers as opposed to hiding from teachers, which they did earlier. Parents acknowledged that their children were studying for longer hours, and they were excited to go back to books at home. Prior to the study, some teachers used to travel to the nearest city and are now staying closer to the villages by renting houses there because of the light.
Overall, we witnessed a strong sense of gratitude in the treatment villages during our field visits. People danced for us to thank us. The villagers gifted us guineafowl eggs and live chickens when we returned. This gratitude, as expected, was missing in the control villages.
Return on Donation
From the discussion above, we note that, on average, a treatment household was able to save 220 GHS per quarter from energy expenditure and an additional 30 GHS per quarter from expenditures on transportation and medicines. This accounts to a saving of 250 GHS per quarter, or 83 GHS per month.
To put this number into perspective, we note that the average monthly earning reported by both the treatment and control households was around 400 GHS. So, these savings amount to 21% of earnings, which we believe is a significant impact in the lives of the poor.
Another way to look at these savings is from a donor’s viewpoint. Note from Table 1 that the average cost of a kit was 50.85 USD, which in 2021 was equivalent to around 315 GHS. If we think of a donor as an impact investor, then an investment of 315 GHS led to an annual return of 1000 GHS in consumers’ lives, which is a whopping 217% annual return on investment.
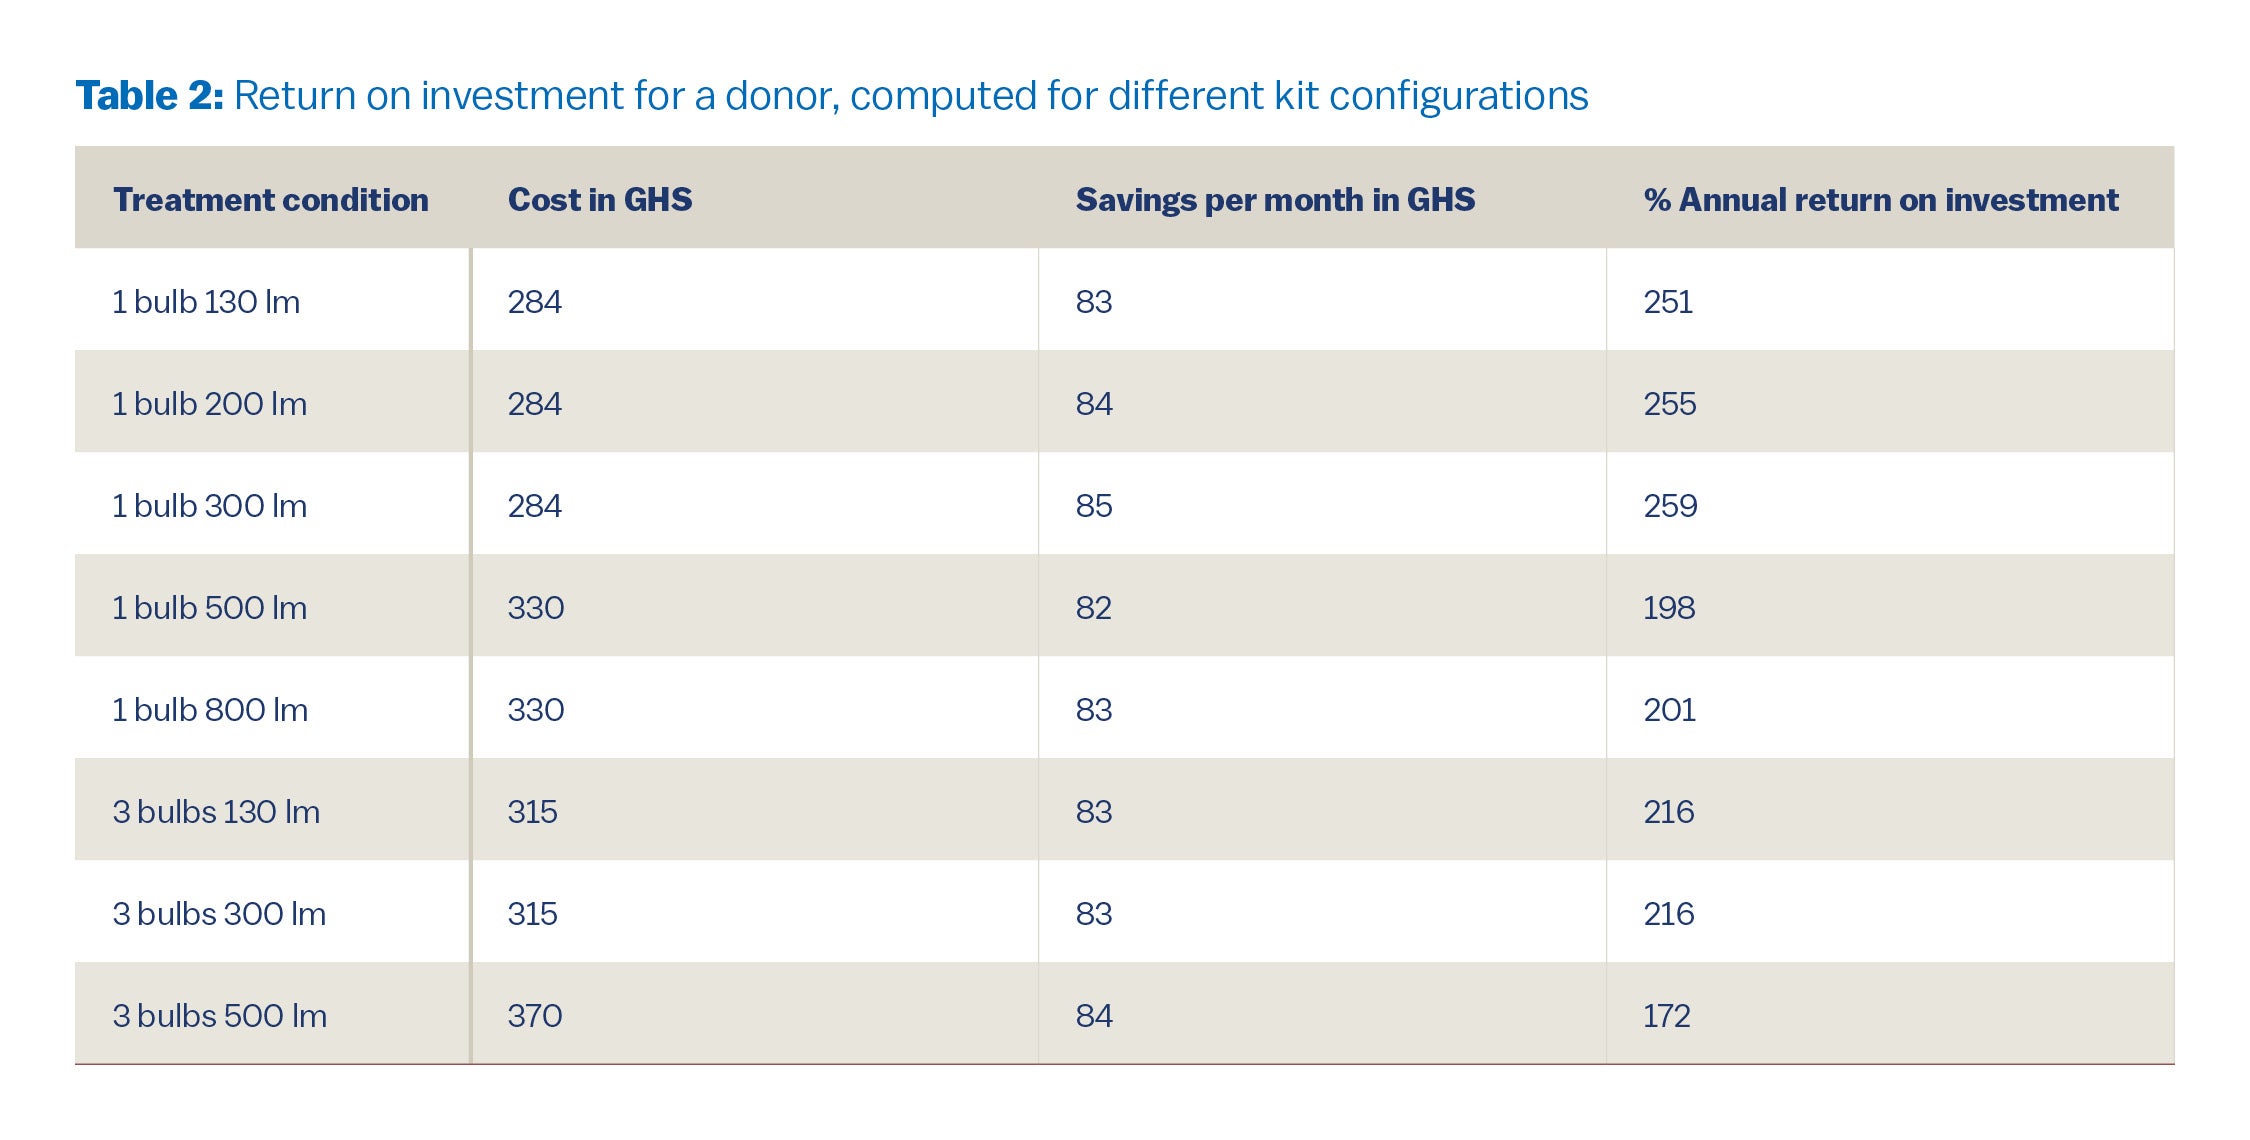
We could also compute the return on investment individually for each solar kit configuration used in our study, as shown in Table 2. As we mentioned earlier, because consumers complemented their kits with USB-compatible devices, there was not much difference between the treatment conditions in terms of their impact.
Therefore, the savings from different configurations also do not differ much. The numbers in the third column of Table 2 are not statistically different. However, these configurations differ in their costs and, hence, in their returns as well. The best return on investment is on the configuration 1-bulb-300-lm, which is statistically not very different from the returns on the configurations with 130 lm or 200 lm bulbs.
Savings and Investments
A natural question then arises: what are the consumers doing with their saved amounts? As mentioned, the money saved on traditional lighting sources was redirected toward more sustainable and rechargeable USB devices. But this is only a small portion of the savings, so what happened to the remaining amounts?
Even with a significant expenditure saved because of solar kit, a typical consumer can save no more than 1000 GHS annually. Consumers, therefore, need to wait to make big-ticket investments. The treatment households held their saved money at home for most of our study duration. Toward the end of our study (i.e., a year later), some purchased crop spraying machines, which cost 900 GHS.
Because other households held their money even longer, we went back one year later (i.e., two years after the intervention) to conduct a short survey on what they did with their saved money. We learned that almost all the treatment households were farming more land, hiring more labor, and purchasing more chemicals and fertilizers. This costs them, on average, 1100 GHS more, which justifies their wait for longer than a year. Interestingly, almost all the treatment households invested their savings into farming, perhaps because of a lack of other investment opportunities.
Policy Implications
Our study shows that making solar kits available to poor populations has multiple positive effects on their expenditure patterns, but also on children’s education, on safety, and security. Therefore, supporting penetration of solar kits is attractive from an individual, the government, and the donor perspective.
We estimate that, for donors, return on donation is more than 200% per year, making it one of the best-known ways to achieve impact with donations in a short term. In the long term, we find that individuals turn savings from solar panels into productivity improvements for their farming operations, leading to long-term economic growth. Overall, our findings support policies that encourage investments and donations for solar kits due to a multitude of benefits.

Serguei Netessine
Senior Vice Dean of Innovation & Global Initiatives, WhartonSerguei Netessine is Senior Vice Dean of Innovation and Global Initiatives and Dhirubhai Ambani Professor of Innovation and Entrepreneurship in the Operations, Information and Decisions Department at The Wharton School.

Bhavani Shanker Uppari
Assistant Professor, Singapore Management UniversityBhavani Shanker Uppari is assistant professor of operations and management at Singapore Management University.
