Has Europe’s Emissions Trading Scheme Taken Away a Country’s Ability to Reduce Emissions?

Many individual countries pursue climate policies yet are also covered by a broader, overlapping emissions trading system. We explore when such overlapping policies help mitigate climate change, and when they are ineffective or might backfire.
At a Glance
Key Challenge
EU member states have enacted many policies to reduce carbon emissions, but their effectiveness can be undone by the compromise of the EU Emissions Trading Scheme.
Policy Insight
With wider carbon-pricing systems in place, the climate effectiveness of overlapping policies depends strongly on policy design, geographic coverage, and time. For policymakers, our formulae for internal leakage and the waterbed effect can be valuable as a guiding principle to climate effectiveness.
Introduction
Under increasing pressure to combat climate change, jurisdictions around the world are enacting a plethora of policies to support decarbonization. A notable example is the UK’s carbon fee of £18 per ton of carbon dioxide on electricity generation that has been hailed as “perhaps the clearest example in the world of a carbon tax leading to a significant cut in emissions” (Plumer and Popovich 2019). Other examples include Spain’s large-scale renewables support program, Germany’s phase-out of coal-fired power generation, and carbon levies on air travel in several European countries.
These policies share an important common feature. They are policies enacted by member states of the European Union (EU) to target an individual sector—like electricity or aviation—that has, at the same time, already been covered by the EU’s emissions trading system (ETS). We call them “overlapping climate policies.” The EU ETS covers carbon emissions from power generation, industrial installations and aviation across the 27 member states.1
We ask a simple question: how does an overlapping policy help mitigate climate change? Any system-wide climate benefit will be driven by the policy’s impact on total emissions in the EU as a whole, not just the country and the sector that is the direct target of the policy. The “climate effectiveness” of an overlapping policy hinges on two channels: how the policy affects the product market of the policy’s targeted sector (such as electricity), and on the design of the wider carbon market with which the policy overlaps (such as the EU ETS). These two forces together determine the extent to which a policy’s cut in domestic emissions translates into an aggregate emissions reduction across the jurisdictions and sectors covered by the carbon market.
Internal Carbon Leakage and the Waterbed Effect
To fix ideas, it is useful to start with two polar cases in which an overlapping policy has no climate benefit. First, starting with the product market, suppose that an individual country’s phase-out of coal-fired power generation succeeds at reducing its domestic emissions. But suppose that this reduction is exactly offset by additional emissions due to increased imports of coal-fired power from a neighboring country that also participates in the carbon market.
This leaves the aggregate demand for carbon allowances across the system unchanged. In this case, the overlapping policy reshuffles but does not reduce aggregate emissions. We call this situation 100% “internal carbon leakage.”2
Leakage can take on different values. In the previous example, if the reduced domestic emissions are only partially offset by emissions from extra power imports, leakage will be between 0 and 100%. As discussed below, leakage can even be negative or larger than 100%.
Second, turning to the carbon market, consider the textbook case of a cap-and-trade system that sets a fixed cap on aggregate emissions and lets the allowance price clear the carbon market (Baumol and Oates 1988). Suppose that the coal phase-out policy succeeds at reducing aggregate demand for allowances in the power sector—perhaps because any extra power imports come from cleaner sources such as renewables or gas.
However, given the fixed aggregate emissions cap, this must be exactly offset by increased emissions elsewhere in the system—in other countries and/or other sectors. That is, lower demand for carbon allowances in one country or sector exclusively translates into a drop in the system’s equilibrium carbon price, which in turn increases demand for carbon allowances elsewhere.
Once again, the overlapping policy merely reshuffles emissions—we call this situation a 100% “waterbed effect.” At the other extreme, under a carbon tax, the policy reduces power-sector emissions but the carbon price in the other sectors remains the same, and therefore emissions in the other sectors don’t increase—the waterbed effect is zero.
Real-world carbon-pricing schemes are more complicated than these extreme cases (a fixed cap or a carbon tax) because their aggregate emissions cap is not necessarily fixed: they have “flexibility mechanisms.” For example, with its large-scale reform in 2018, the EU carbon market moved from a simple fixed cap to a complex intertemporal reserve mechanism called the Market Stability Reserve (MSR) that cancels allowances under certain market circumstances—its emissions cap shrinks when there are lots of banked allowances in circulation.
For example, for every ten extra allowances in circulation, four allowances might be cancelled (and that number changes over time).3 A reduction in demand for allowances in the power sector (driven by the coal phase-out in Germany) now adds to the bank of unused allowances, and therefore more allowances will be canceled, and aggregate emissions will go down.
Under this carbon-market design, the waterbed effect takes on intermediate values between zero and 100% (which, again, can change over time) thus enabling overlapping policies to affect aggregate emissions.
A Simple Formula for Climate Effectiveness
An overlapping policy’s ability to combat climate change—that is, the change in aggregate system-wide emissions that it generates—equals its direct change in emissions in its target country or sector adjusted by its internal carbon leakage L and the waterbed effect W in the carbon market with which it overlaps:
![]()
We can interpret as the effective emissions reduction rate. For example, consider two countries A and B that share a carbon market that covers electricity and manufacturing with a waterbed effect of 50%. Country A phases out coal in its power sector, reducing its domestic power sector emissions by 100 tons. Now assume that the internal leakage rate is 33%: one-third of the domestic power-sector emissions reduction is replaced with equally-dirty power imports from country B. The system-wide emissions reduction is then , only a third of what the policy achieves in country A’s power sector. The effective emissions reduction rate R is then .
The stakes are high: we show that some policies are truly complementary in the sense that they induce additional emissions reductions elsewhere (R > 1), while others backfire by raising aggregate emissions (R < 0). The former can happen under no waterbed effect (e.g. under a carbon tax) and negative leakage,4 while the latter can occur when leakage is over 100%. We will now discuss when such cases can occur.
Internal Carbon Leakage Depends on Policy Type
Popular unilateral policies can be split into two groups, which have very different rates of internal carbon leakage. The first group comprises policies that reduce the domestic supply of dirty products: by unilaterally raising the carbon price for emissions-intensive production (as in the UK’s carbon fee) or by directly limiting production at targeted firms (as in Germany’s coal phase-out).
These policies are prone to leakage. As one country reduces production (because of higher costs in the UK or less production capacity in Germany), the product price increases in the policy’s targeted sector (such as electricity). Other countries seek to “fill the gap” by increasing their production and thus emissions. Moreover, if other countries have dirtier production technologies, this substitution effect can be sufficiently strong that the policy backfires by increasing aggregate demand for allowances (L > 1).
The second group comprises policies that reduce the domestic demand for emissions-intensive production, for example, by promoting renewables (as in Spain’s renewables program) or energy efficiency. These policies have negative internal carbon leakage (L < 0).
Consider, for example, more renewables with near-zero marginal cost reduces the wholesale price of electricity in Spain. The lower power price, in turn, reduces the supply of more costly and carbon-intensive power from generators in Spain itself and from the countries that export electricity to Spain—so Europe-wide power-sector emissions go down more than emissions in Spain. This is known as the “merit-order effect” (Borenstein 2012; Antweiler and Muesgens 2021).
Empirical Illustrations of Climate Effectiveness of Overlapping Policies
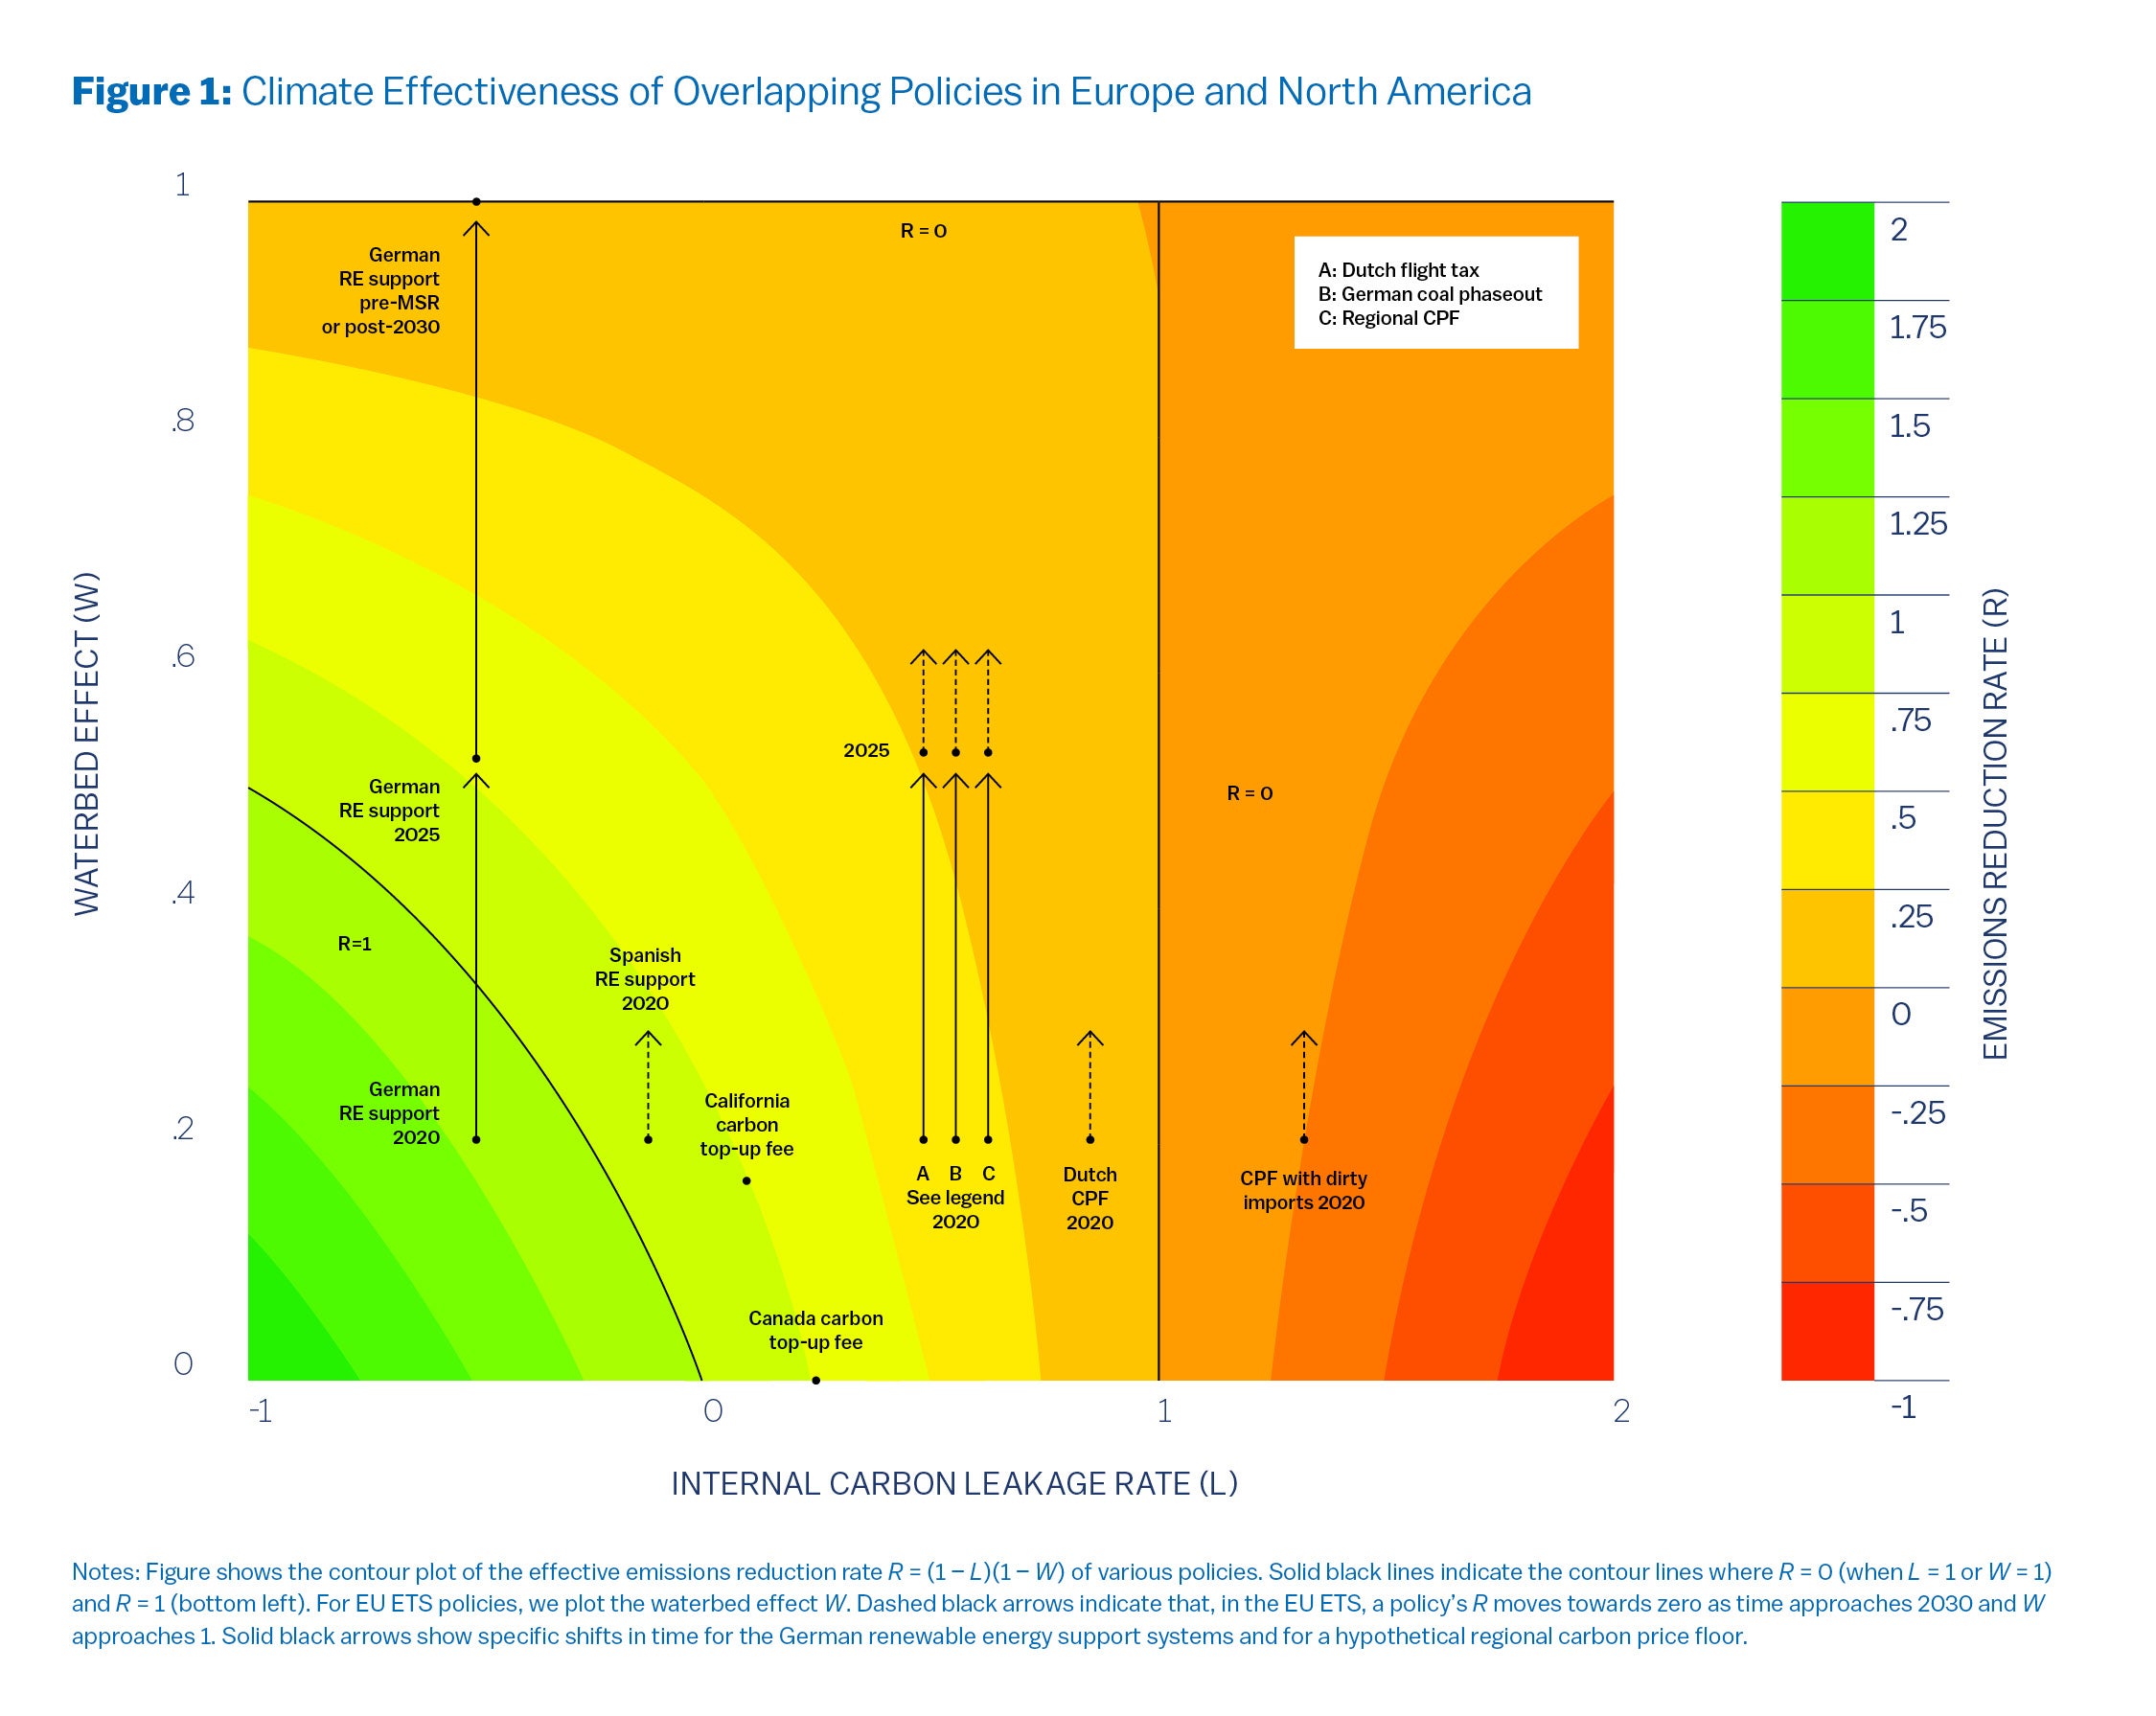
We now provide some numerical examples of overlapping climate policies in Europe. Our main outcome of interest is a policy’s effective emissions reduction rate , and we obtain estimates of L and W from a variety of studies. Figure 1 provides a visual summary. It plots the contour lines of R in (L, W)-space along with a number of example policies.
Policies in the green regions are highly effective, with those in the bottom-left being generally complementary (R > 1). Policies in the light orange regions have limited effect, while those in the dark orange regions backfire by increasing aggregate emissions (R < 0).
The Waterbed Effect in the EU ETS
The waterbed effect in the post-2018 EU ETS is driven by its-MSR, the complex flexibility mechanism described above. The MSR “punctures” the waterbed effect (i.e., it differs from 1) because allowances are permanently cancelled if the bank of unused allowances grows too large.
This is good news for the climate effectiveness of national policies: they now also reduce Europe-wide emissions. The specifics of the MSR rules imply a time-varying waterbed Wt, which has increased from 0.21 (2020) to 0.53 (2025) to 1 (post-2030).
Because Wt varies over time, so does the effective emissions reduction rate Rt for an overlapping policy. This is visible in the dotted grey arrows in Figure 1, where all European policies move north. In this illustration, we assume that by 2030, we are back to a fixed cap: W2030 = 1, so all overlapping policies in the EU ETS end up at R = 0.
Examples of Overlapping Policies
Discouraging Fossil Electricity
The Dutch government approved a national carbon price floor (CPF) for the electricity sector, with a minimum carbon price that increases from EUR 14.90/tCO2 in 2022 to EUR 31.90/tCO2 in 2030—as of mid-2024, however, the policy is not binding as the EU ETS carbon price exceeds the Dutch CPF.5
The Netherlands has also adopted a CPF for its industrial sectors, starting at EUR 30.48 in 2021 and increasing to EUR 150.31 by 2030.6 Such policies, if binding, suffer from intra-EU carbon leakage as domestic electricity generation gets replaced with imports; we expect high leakage for small countries such as the Netherlands. Quantitative estimates for the Dutch CPF find L = 0.85 (Frontier Economics 2018).
Such CPFs in small interconnected countries are unlikely to reduce EU-wide emissions by much, with R2020 = 0.12 (W2020 = 0.21, L = 0.85) even under the punctured waterbed (see Figure 1). As more countries join a regional CPF, R2020 rises to 0.31 (W2020 = 0.21, L = 0.61). These types of policies can even backfire if imports are substantially dirtier than domestic production. We plot a hypothetical “CPF with dirty imports” for which L = 1.33 such that EU-wide emissions increase, R < 0.
The Powering Past Coal Alliance groups national and sub-national governments, including twelve EU countries, committed to phasing out coal. Examples include the British and Dutch policies to close their remaining coal-fired power plants by 2025 and 2030, respectively. Germany has also passed regulation to phase out coal by 2038. The German coal phase-out has been estimated to have an internal leakage rate of 0.55 in 2020 (Pahle et al. 2019), so R2020 = 0.36 (W2020 = 0.21, L = 0.55$) and decreasing to zero by 2030.
Aviation Taxes
Several European countries, such as Austria, Germany, Norway and Sweden, have aviation taxes; others, such as Denmark, Ireland and the Netherlands, abolished them after initial implementation. Such policies are prone to leakage: when the Netherlands adopted an aviation tax in July 2008 at a rate of EUR 11.25 for short-haul flights and EUR 45 for long-haul flights, about 50% of the decline in passengers at Dutch airports was offset by increased passenger volumes at nearby airports in Belgium and Germany (Gordijn and Kolkman 2011).
The intra-EU leakage rate is 0.50. As a result, the Dutch government abolished the tax in July 2009—but then reintroduced a modest ticket tax of EUR 7 on all flights starting in 2021 (Forbes 2020). Assuming the same internal leakage rate as in 2008-2009, we estimate R2020 = 0.40 (W2020 = 0.21, L = 0.50).
Renewable Energy Support
Germany and Spain have adopted some of the world’s most ambitious incentives for wind and solar energy, which include feed-in tariffs and market premium programs. Abrell et al. (2019) estimate negative carbon leakage for renewables support in Germany and Spain as additional zero-carbon energy depresses wholesale electricity prices—via the merit-order effect—and offsets imported gas- and coal-fired electricity in Germany (L = -0.50) and Spain (L = -0.12).
Figure 1 shows that, at least in the year 2020, the German renewable support scheme reduces Europe-wide emissions by more than the domestic emissions reduction in Germany (W2020 = 0.21, L = -0.50, R2020 =1.19)—and is truly a complementary policy in this sense. As time passes, W increases and eventually the puncture is sealed, reducing R to zero from 2030 onwards.
(Note: Figure 1 also plots some policies for North America; see Perino et al. (2023) for details.)
Conclusion and Policy Guidance
With a wider carbon-pricing system in place, the climate effectiveness of overlapping climate policies depends strongly on policy design (which determines the rate of internal carbon leakage), geographic coverage (leakages can differ substantially across industries and jurisdictions), and time (which can affect the magnitude of the waterbed effect).
We hope that our analysis will be useful to policymakers, as our simple formulae for internal leakage and the waterbed effect lend themselves to “back-of-the-envelope” calculations that can be valuable as a first guiding principle to climate effectiveness.

Arthur van Benthem
Associate Professor of Business Economics and Public PolicyArthur van Benthem is an expert in environmental and energy economics, exploring the economic efficiency of energy policy. He is a faculty fellow at the Kleinman Center and an associate professor of Business Economics and Public Policy at Wharton.

Grischa Perino
Professor, University of HamburgGrischa Perino is a professor of Environmental Economics at the University of Hamburg.

Robert Ritz
Economist, University of CambridgeRobert Ritz is an economist at the University of Cambridge where he co-directs the Energy Policy Research Group at Judge Business School and is a Fellow in Economics at Peterhouse.
Abrell, J., M. Kosch, and S. Rausch. 2019. “Carbon Abatement with Renewables: Evaluating Wind and Solar Subsidies in Germany and Spain.” Journal of Public Economics 169, 172–202.
Antweiler, W. and F. Muesgens. 2021. “On the Long-Term Merit Order Effect of Renewable Energies.” Energy Economics 99, 105275.
Barbiroglio, Emanuela. 2020. “The Netherlands Keeps Going Upstream When It Comes to Aviation Tax.” Forbes. Available at https://www.forbes.com/sites/emanuelabarbiroglio/2020/04/18/the-netherlands-keeps-going-upstream-when-it-comes-to-aviation-tax/#552d54136e86.
Baumol, W. and W. Oates. 1988. The Theory of Environmental Policy. Cambridge University Press, 2nd edition.
Borenstein, S. 2012. “The Private and Public Economics of Renewable Electricity Generation.” Journal of Economic Perspectives 26, 67–92.
Dutch Emissions Authority. n.d. “Tarieven CO2-heffing.” https://www.emissieautoriteit.nl/onderwerpen/tarieven-co2-heffing. Accessed 2/19/2025.
Frontier Economics. 2018. “Research on the Effects of a Carbon Price Floor.” Available at https://www.frontier-economics.com/media/u0pai0qz/reasearch-effects-carbon-price-floor.pdf.
Gordijn, H. and J. Kolkman. 2011. “Effects of the Air Passenger Tax: Behavioral Responses of Passengers, Airlines and Airports.” KiM Netherlands Institute for Transport Policy Analysis. Available at http://publicaties.minienm.nl/documenten/effects-of-the-air-passenger-tax-behavourial-responses-of-passen.
Government of the Netherlands. n.d. “Wet minimum CO2-prijs elektriciteitsopwekking.” https://www.eerstekamer.nl/wetsvoorstel/35216_wet_minimum_co2_prijs. Accessed 2/19/2025.
Pahle, M., O. Edenhofer, R. Pietzcker, Oliver Tietjen, Sebastian Osorio, and Christian Flachsland. 2019. “Die Unterschätzten Risiken des Kohleausstiegs,” Energiewirtschaftliche Tagesfragen, 69 (6), 1–4.
Perino, G., R. Ritz and A.A. van Benthem. 2023. “Overlapping Climate Policies.” https://www.arthurvanbenthem.com/docs/OverlappingClimatePolicies.pdf
Plumer, Brad and Nadja Popovich. 2019. “These Countries Have Prices on Carbon. Are They Working?” New York Times. Available at https://www.nytimes.com/interactive/2019/04/02/climate/pricing-carbon-emissions.html.
- The UK’s carbon price support on electricity overlapped with the EU ETS from its introduction in 2013 until, as a consequence of Brexit, the UK left the EU ETS at the end of 2020 and created a UK ETS. [↩]
- Our focus here differs from external carbon leakage, where the policy leads to increased emissions-intensive imports from countries outside the carbon-pricing system. [↩]
- This over-simplifies the MSR, but carries over the main intuition. [↩]
- Negative leakage occurs when a policy causes emissions to fall domestically and abroad. For example, renewables support in country A lower power prices regionally, thereby reducing carbon-intensive power generation in country B. [↩]
- The Dutch government approved a national carbon price floor (CPF) for the electricity sector, with a minimum carbon price that increases from EUR 14.90/tCO2 in 2022 to EUR 31.90/tCO2 in 2030—as of mid-2024. However, the policy is not binding as the EU ETS carbon price exceeds the Dutch CPF (Government of Netherlands, n.d.) [↩]
- The Netherlands has also adopted a CPF for its industrial sectors, starting at EUR 30.48 in 2021 and increasing to EUR 150.31 by 2030 (Dutch Emissions Authority, n.d.). [↩]
