Future Energy Demands on the Global Aviation Industry

Changes in the air transportation system greatly impact our current and future energy demands, and since the year 2000 the aviation system has experienced tremendous change. Major federal and international policy changes are radically re-shaping the future global aviation system and its energy demands and environmental emissions.
Winds of Change
First, Open Skies Agreements between countries that deregulate international aviation markets are removing the legal barriers that restrict airlines from creating new international aviation routes. International airlines, from the Gulf carriers like Emirates to low-cost Norwegian Airlines, are expanding rapidly and defining new markets. In addition, the Department of Transportation recently granted antitrust immunity to three groups of airline partners that solidified their businesses cases for new international routes.
Second, Federal Aviation Administration (FAA) policy guidance that allows the busiest U.S. airports to provide incentives to airlines for more and expanded services is encouraging more and more airport competition, both regionally and inter-regionally. Nearly contemporaneous to these two major policy shifts is the massive restructuring of U.S. airlines. Six major U.S. airlines merged into three in the first decade of the 2000s, largely in response to high and wildly fluctuating fuel prices and cost pressures. These newly merged airlines began practicing “capacity discipline” or reducing service in marginally profitable markets and concentrating their operations on key hub airports located in major cities.
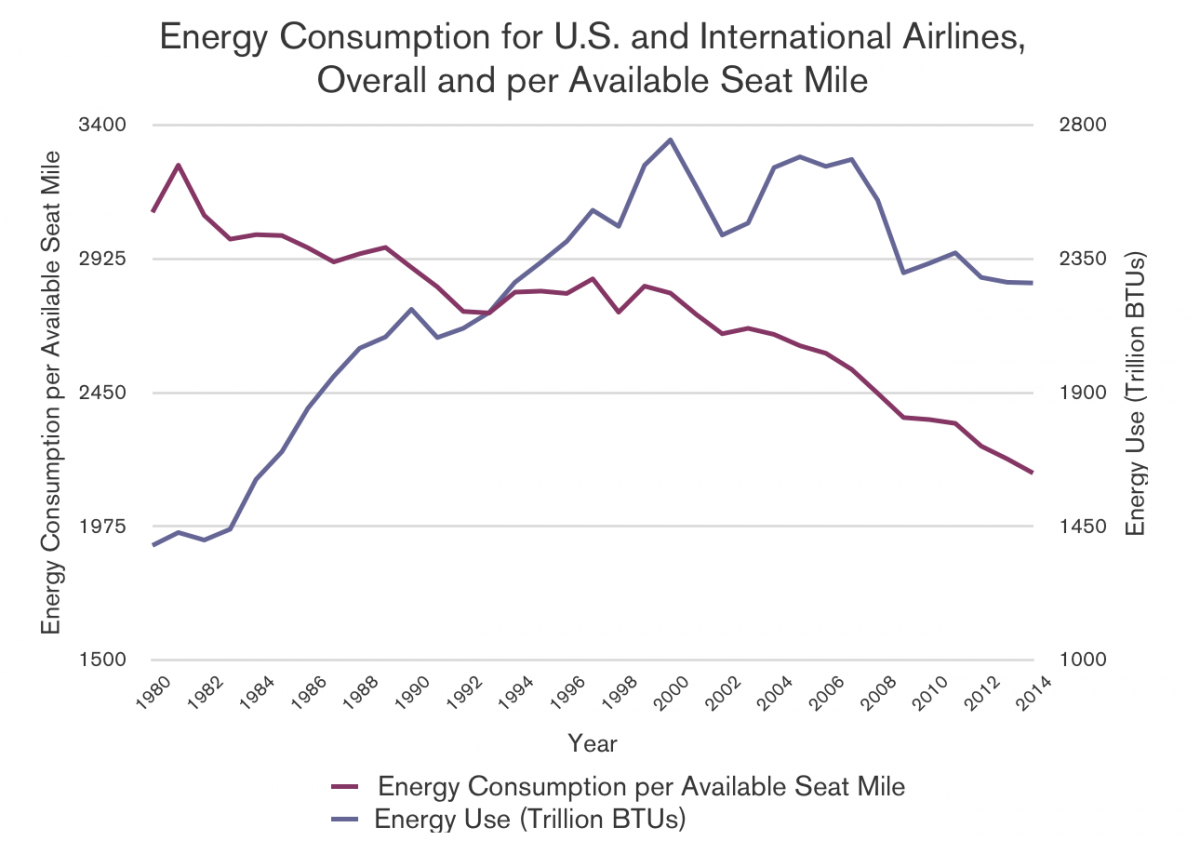
These policy changes are having a massive effect on the supply of air transportation services, which is in turn changing energy demand. Consider that, while energy consumption per available seat mile (a common metric which represents the number of seats flown multiplied by the number of miles flown) across all U.S. and International airlines has declined, the raw total energy consumed by flights has largely increased. Figure 1 shows this trend in energy efficiency and total energy demands for all U.S. and International Airlines, data collected from Oak Ridge National Laboratory (2015). The implication is that while aircraft and airlines are certainly becoming more efficient from an energy demand perspective, the overall energy demands of airlines are increasing.
Energy Demands in Perspective
Aviation’s demand for energy is 8% of total transportation (highway and non-highway) energy demand; a number that may seem small until it is put into context. One way to do this is to consider the amount of jet fuel consumed—converted to greenhouse gas emissions (GHG) using an EPA conversion factor of jet fuel consumed to GHG—and compare it with urban sustainability goals.
Let’s consider the urban sustainability goals of two major U.S. cities. The city of Philadelphia has the goal of reducing vehicle miles traveled (VMT) by nearly 600 million per year (The City of Philadelphia, 2012). The amount of GHG saved by this VMT goal is equivalent to the amount of fuel consumed and GHGs emitted from a year of daily flights between Philadelphia and Doha, a new daily flight route added by Qatar Airlines in 2014.
The City of Boston added a bike share program and estimated that from 2011 to 2014 the bike share system saved 350 tons of carbon dioxide, the most abundant GHG (The City of Boston, 2014). If we compare this to the GHG emissions from the daily flight from Boston to Beijing from 2014-2015, the flight emitted 167 times more GHG than were saved by the bike share program over disproportionate periods of time. The implication is that, despite single-digit impacts on our energy demands, the air transportation systems’ vast energy needs can outstrip progress made in other avenues.
Intended and Unintended Consequences of Incentives
Given this background, how will changes in airline structure and policies on airline collaboration both in the U.S. and abroad impact energy consumption? How will the new FAA policy allowing the busiest airports to provide incentives for airlines launching new service impact energy consumption? And how will both of these policies shape the future aviation system?
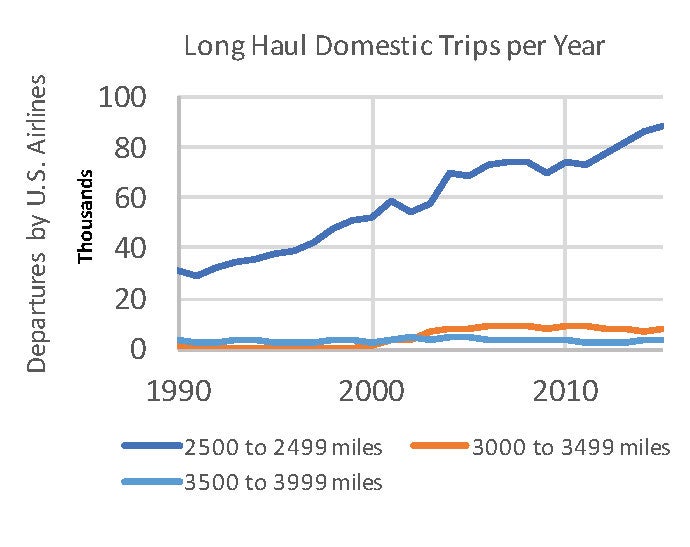
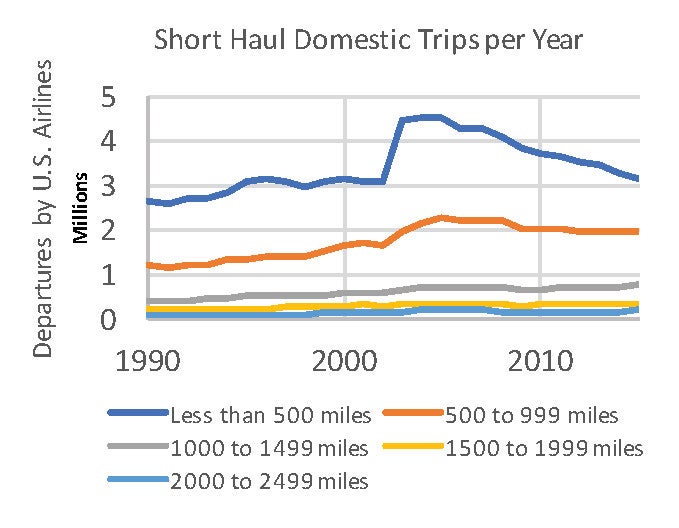
City officials and planners have long sought to attract air traffic to their airports, believing that air traffic stimulates economic development (see Mosbah and Ryerson, 2016 for more discussion). However, the 2000s saw six major airlines consolidate into three contemporaneously with more than 70% of the 30 busiest U.S. airports expanding their airfield capacity with a new runway or a runway extension (Ryerson and Kim, 2013; Ryerson and Woodburn, 2014). Airlines entered into a period of “capacity discipline”—meaning reduced service in marginally profitable markets and reduced flights in any redundant markets with their merger patterns. The trends (Figure 2) in the reduction of short-haul flights after airlines mergers are stark, with flights less than 500 miles dropping from 4.4 million in 2003 to 3.1 million in 2015; at the same time, flights between 2500 and 3000 miles increased from 57,000 in 2013 to nearly 89,000 in 2015. Airline mergers came after years and years of unprofitability from the airlines, and this reduction in flights—particularly in these short-haul flights with higher costs and lower fuel inefficiency—helped the airlines improve their profitability (Ryerson and Hansen, 2010). It also helped these airlines reduce their fuel consumption in short-haul markets while increasing fuel consumption in long haul markets.
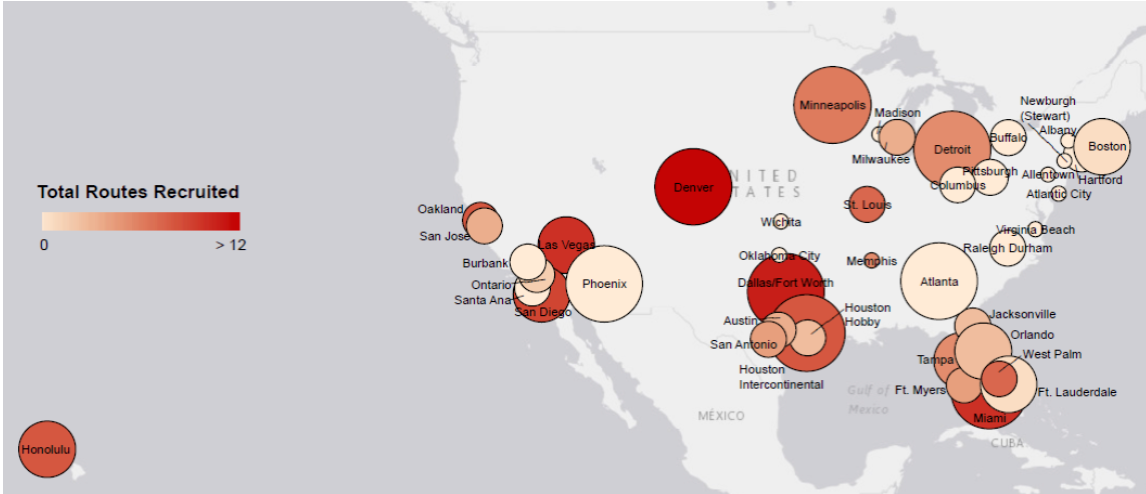
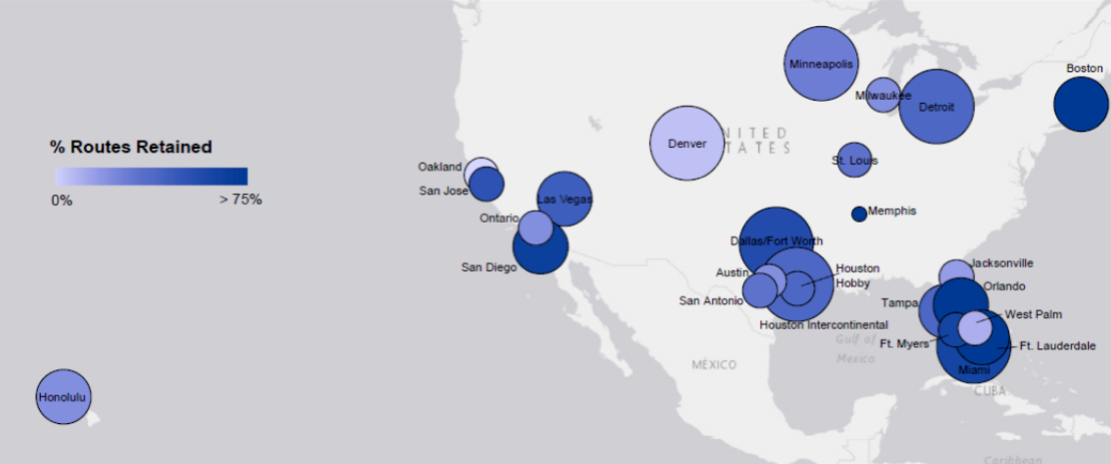
In 1999 and again in 2010 the FAA published the Guidebook on Air Service Incentive Programs which specifies how airport sponsors can recruit new air service by providing incentives to airlines establishing new service at their airports; the incentives can last 1 to 2 years and include waived airport fees and airport funded marketing programs (Federal Aviation Administration, 2010; Ryerson, 2016a). Airports with incentive programs may spend up to $30 per passenger and $3,500 per flight that receives an incentive (Ryerson, 2016b). Overall from 2012-2015Q1, a small fraction of the time incentive programs have been explicitly permitted by FAA policy, 26 of the U.S. 44 airports with incentive programs that recruited new routes spent $171.5 million combined. Of the new routes that were established by airlines receiving incentives, 40% were terminated once the incentive period was over (Ryerson, 2016a). These findings are depicted on the maps in Figure 3. The size of the circles indicates the size of the airports in terms of passengers moved, while the color indicates the number of new routes recruited and the percent of new routes retained. In general, we see that larger airports in the larger cities are the most successful at recruiting and retaining routes, while smaller airports in smaller cities are less successful.
Open Skies and Anti-Trust Immunity
Incentives are particularly popular for international routes. Airports in cities like Austin, San Diego, Raleigh, and San Jose have all recruited new international routes through the use of incentives (Ryerson, 2016a, 2016b). But international travel is also growing due to new policies for international travel. Open Skies agreements, for example, deregulate the international aviation market, eliminating government intervention on fares, capacities, and routes. The specific European Union-U.S. Open Skies Agreement, signed in 2007 and amended in 2010, goes even further, creating “a transatlantic Open Aviation Area: a single air transport market between the E.U. and the U.S. with free flows of investment and no restrictions on air services, including access to the domestic markets of both parties” thus allowing airlines to launch services between the EU and the US (Department Of State, 2010, 2007).
Contemporaneously with the European Union-U.S. Open Skies Agreement which generically liberalized markets, the U.S. Department of Transportation granted antitrust immunity to the three major international airline alliances:
Oneworld
- American Airlines (USA)
- British Airways (U.K)
- Iberia (Spain)
- Finnair (Finland)
Star Alliance
- United Airlines (USA)
- Lufthansa (Germany)
- Swiss International Air Lines (Switzerland)
- Brussels Airlines (Belgium)
- Austrian Airlines (Austria)
Sky Team
- Delta Airlines (USA)
- Air France (France)
- KLM Royal Dutch Airlines (Netherlands)
- Alitalia (Italy)
Antitrust immunity also exists between U.S. carriers and Asia, including a partnership between American Airlines and Japan Airlines and another between United Airlines and All Nippon Airways. The antitrust immunity agreements allow airline partners to collude on prices and service levels and share in the revenue of flights in certain geographies (i.e., transatlantic); in short, multiple airlines operate as a single airline. While in some cases collusion could reduce flights, in the case of Joint Ventures total flight supply is likely increasing because flights are added in riskier, less-tested international markets.
Implications
One of the major implications of these growth trends—fewer short-haul flights connecting smaller cities with larger cities and a consolidation of operations at the biggest cities—is a changing choice set for passengers looking to travel. Passengers have long faced a complex, interrelated choice set when traveling on a long-distance air transportation trip: a choice between airlines and different airfares, a choice between a connecting itinerary and a non-stop itinerary, and a choice of airports. Dramatic changes to the industry have greatly altered the air service and the cost of that service at U.S. airports and have in turn changed the scope of airports that passengers may choose between.
As airfares have changed and as short-haul flying has decreased significantly, the geographic scope of airports may be growing and shrinking. It is therefore likely that there is significantly more “airport market leakage”—the practice of passengers choosing a distant airport for their air travel instead of their proximate airport—from the passenger perspective. (Fu and Kim, 2016) establish the presence of market leakage for a small group of case study airports; for example, travelers living proximate to Jacksonville, Florida choose to drive to the Orlando airport. Incentive programs are exacerbating leakage even more, by consolidating passengers at the largest airports and forcing these passengers to access their airport using the surface transportation system. Airport market leakage matters tremendously from a transportation energy standpoint. Considering the findings of (Chester and Horvath, 2012), that a typical sedan consumes more than triple the amount of energy per passenger from just vehicle operation compared with a typical short-haul aircraft (Figure 4). Despite the importance of studying market leakage, and the trends which suggest that more and more of this is occurring due to the changes in the aviation system, there has been significantly less focus on this topic in both research and practice. It is one that directly relates to the transportation energy demands going forward.

A Conflicting Outlook
The aviation system has undergone rapid and transformative change since the turn of the century, facilitated by federal policies promoting the growth of airlines. While airlines have emerged with a newfound profitability, the aviation system as a whole has less spatial balance. There are cities and airports with high levels of aviation service and connectivity and those with very low levels of service and connectivity. The result is a conflicting outlook for the demand for air transportation: while overall aviation might look like it’s reducing its energy demand with more efficient operations, the efficiency gains in aviation might be simply causing inefficiency in ground transportation energy demands. The intermodal energy demand link is one that must be studied going forward.
The author wishes to acknowledge helpful comments from a reviewer of an earlier draft. Any remaining errors are the responsibility of the author alone.

Megan Ryerson
UPS Chair of Transportation, Weitzman SchoolMegan Ryerson is the UPS Chair of Transportation and Associate Chair of City and Regional Planning at the Stuart Weitzman School of Design.
Chester, M., Horvath, A., 2012. High-speed rail with emerging automobiles and aircraft can reduce environmental impacts in California’s future. Environ. Res. Lett. 7, 34012. doi:10.1088/1748-9326/7/3/034012
Department Of State, 2010. U.S.-EU Air Transport Agreement of June 24, 2010.
Department Of State, 2007. U.S.-EU Air Transport Agreement of April 30, 2007.
Federal Aviation Administration, 2010. Air Carrier Incentive Program Guidebook: A Reference for Airport Sponsors.
Fu, Q., Kim, A.M., 2016. Supply-and-demand models for exploring relationships between smaller airports and neighboring hub airports in the U.S. Journal of Air Transport Management 52, 67–79. doi:10.1016/j.jairtraman.2015.12.008
Mosbah, S., Ryerson, M.S., 2016. Can U.S. Metropolitan Areas use Large Commercial Airports as Tools to Bolster Regional Economic Growth? Journal of Planning Literature. doi:10.1177/0885412216653100
Oak Ridge National Laboratory, 2015. Transportation Energy Data Book [WWW Document]. URL http://cta.ornl.gov/data/index.shtml (accessed 10.11.16).
Ryerson, M.S., 2016a. Incentivize It and They Will Come? How Some of the Busiest U.S. Airports Are Building Air Service With Incentive Programs. Journal of the American Planning Association 82, 303–315. doi:10.1080/01944363.2016.1215257
Ryerson, M.S., 2016b. Building Air Service Sustainability. Transportation Research Record: Journal of the Transportation Research Board 2569, 1–15. doi:10.3141/2569-01
Ryerson, M.S., Hansen, M., 2010. The potential of turboprops for reducing aviation fuel consumption. Transportation Research Part D: Transport and Environment 15, 305–314. doi:10.1016/j.trd.2010.03.003
Ryerson, M.S., Kim, H., 2013. Integrating airline operational practices into passenger airline hub definition. Journal of Transport Geography 31, 84–93. doi:10.1016/j.jtrangeo.2013.05.013
Ryerson, M.S., Woodburn, A., 2014. Build Airport Capacity or Manage Flight Demand? How Regional Planners Can Lead American Aviation Into a New Frontier of Demand Management. Journal of the American Planning Association 80, 138–152. doi:10.1080/01944363.2014.961949
The City of Boston, 2014. Greenovate Boston: Climate Action Plan.
The City of Philadelphia, 2012. Greenworks Progress Reports.
