Evaluating K-12 Public School District Sustainability Plans for Justice and Equity
Sustainability and climate plans for public K-12 school districts have the potential to address infrastructural gaps that produce outdated, unhealthy, and unsafe school facilities. This project takes a deeper look at several plans across the nation.
At A Glance
Key Challenge
Sustainability and climate action plans for K-12 public school districts have the potential to equitably and justly address climate vulnerability. Sometimes, however, these plans fall short.
Policy Insight
Leaders in districts with medium to high levels of equity and justice earn legitimacy with data—both as a baseline of existing district conditions, and as a means of evaluating the progress.
Introduction and Research Questions
School districts and school facilities are vital components to communities, cities, and regions. Over the last two decades, school district leaders have realized the substantial physical footprint they occupy in the United States and began establishing and implementing district-wide sustainability and climate action plans (SCAPs). There are more than 100,000 public K-12 school facilities in the United States, serving over 50 million students and employing over 6 million staff and teachers.
In addition to the primary purpose of educating students, schools are critical to other non-educational community needs. These alternate purposes were made plain during the COVID-19 pandemic: when school facilities shuttered to limit the spread of the virus, school communities offered services, such as vaccines, subsidized meals, and other public benefits.
Prior to the pandemic, school facilities in climate-vulnerable areas were often designated as emergency management command centers and disaster shelters, providing a physical space to coordinate communities and administer aid. Due to their connective role, schools effectively function as a critical piece of social and physical infrastructure in the United States.
This project analyzes the sustainability and climate plans of large public K-12 school districts across several dimensions, with an emphasis on just and equitable planning.
Sustainability and climate plans for public K-12 school districts have the potential to address several of the infrastructural gaps that produce outdated, unhealthy, and unsafe school facilities. Larger school districts are more likely to have internal variations and disparities, making just and equitable climate and sustainability planning critical to stabilizing vulnerable school facilities and communities. Using content analysis of school district plans from 2015-2022, and interviews with district leaders, we answer the following questions:
- How, and to what extent, are K-12 public school districts addressing climate equity and justice through sustainability and climate plans?
- What resources are available, at the district and school building level, to support the plan’s creation and implementation?
- How, if at all, are these school district plans coordinated with local (municipal/county) climate and sustainability plans?
- What barriers and opportunities impact just and equitable climate and sustainability planning for school districts? And how do these barriers and opportunities vary across large public school districts?
Our initial findings point to the reduction of energy use and costs as a primary driver for many public K-12 school district SCAPs, which shapes the types of data, processes, and goals used in these plans. However, the ability to produce widespread buy-in across the district was limited by this focus on energy use and costs: these plans often evolved over time to include broader aspects of sustainability and climate and included more district departments and leaders.
Resources for these plans are limited, and often fall under the purview of a single sustainability officer. Major opportunities for increasing resources lie with greater coordination with county- and local-level climate and sustainability plans, although we find that school districts can contribute their district-wide equity foci to these local sustainability planning efforts.
Conceptualization, Data, and Methods
Sustainability and climate planning has taken on renewed importance and policy support over the last two decades. Researchers have analyzed these plans over several dimensions, with many focusing on the plan’s ability to advance broader place-based equity and justice goals.
From the “triple-bottom line” literature, which describes how plans (and planners) deal with tensions between achieving social, economic, and environmental priorities,(Campbell 1996) to identifying specific types of equity and justice that plans can achieve (Schrock, Bassett, and Green 2015; Clark and Miles 2021; Diezmartínez and Short Gianotti 2022), the literature has produced several methods and frameworks to assess justice and equity in sustainability planning.
We use the literature to conceptualize and operationalize the following aspects of this research: justice, equity, and plans. We find that justice is impossible to separate from equity, such that, for a plan to be equitable, it must be just, in either its outcomes or process. However, tensions arise in achieving either (Fainstein 2014).
When measuring SCPs for justice, we rely on distributive and procedural understandings of justice, as well as the recently emerging concept of justice as recognition. We rely on the work of Walker and others, who, building on Rawls, define distributive justice as “the belief that the outcome…is fair, equitable, and deserved” (Walker, Lind, and Thibaut 1979, 1402), and procedural justice as “the belief that the techniques…are fair and satisfying in themselves” (Walker, Lind, and Thibaut 1979, 1402).
Note that both definitions require a validity in the perception of fairness and equity in the specified process and outcomes. We tie that perception to the planning process for the SCAP, by operationalizing and measuring how accessible, transparent, and public are the envisioning, goal-setting, engagement, and reporting aspects of these plans. We operationalize the concept of justice as recognition, by identifying specific mentions of, or attempts to engage and center, historically marginalized groups that have been disproportionately impacted by environmental hazards or climate change.
With regards to equity, we draw from four categories in the literature: distributive, procedural, social, and geographic. The definitions for distributive and procedural equity align with those for justice, relying on perceptions of fair outcomes and processes. We use Schrock et al.’s (2015) definitions of social equity (equity across socioeconomic factors, such as race, class, and gender) and geographic equity (equity across geographic units—in this case, individual school facilities). In addition, we employ a mechanism to understand how equity is deployed in plans, which allows us to link equity and justice in the planning process. We included codes to determine whether equity is explicitly mentioned in the plan’s vision and/or goals (distributive), as a problem to be addressed for certain groups (recognition), or as a guiding principle for a planning recommendation and/or action (procedural).
Data and Methods
We began our data collection by identifying all K-12 public school districts in the United States (n = 13,318) and focusing on those with enrollments greater than 15,000 (n =341) for the 2021-2022 academic year (NCES 2015). We used this as a cutoff to focus on large school districts who we believed would have sufficient resources to create and implement a sustainability and/or climate action plan (SCAP). Large school districts in the United States are generally categorized as districts with more than 25,000 students enrolled (n=288), but we lowered that threshold after cross-referencing it with a dataset of all school districts that have or have had sustainability policies (n=154), according to the Center for Green Schools (CGS).
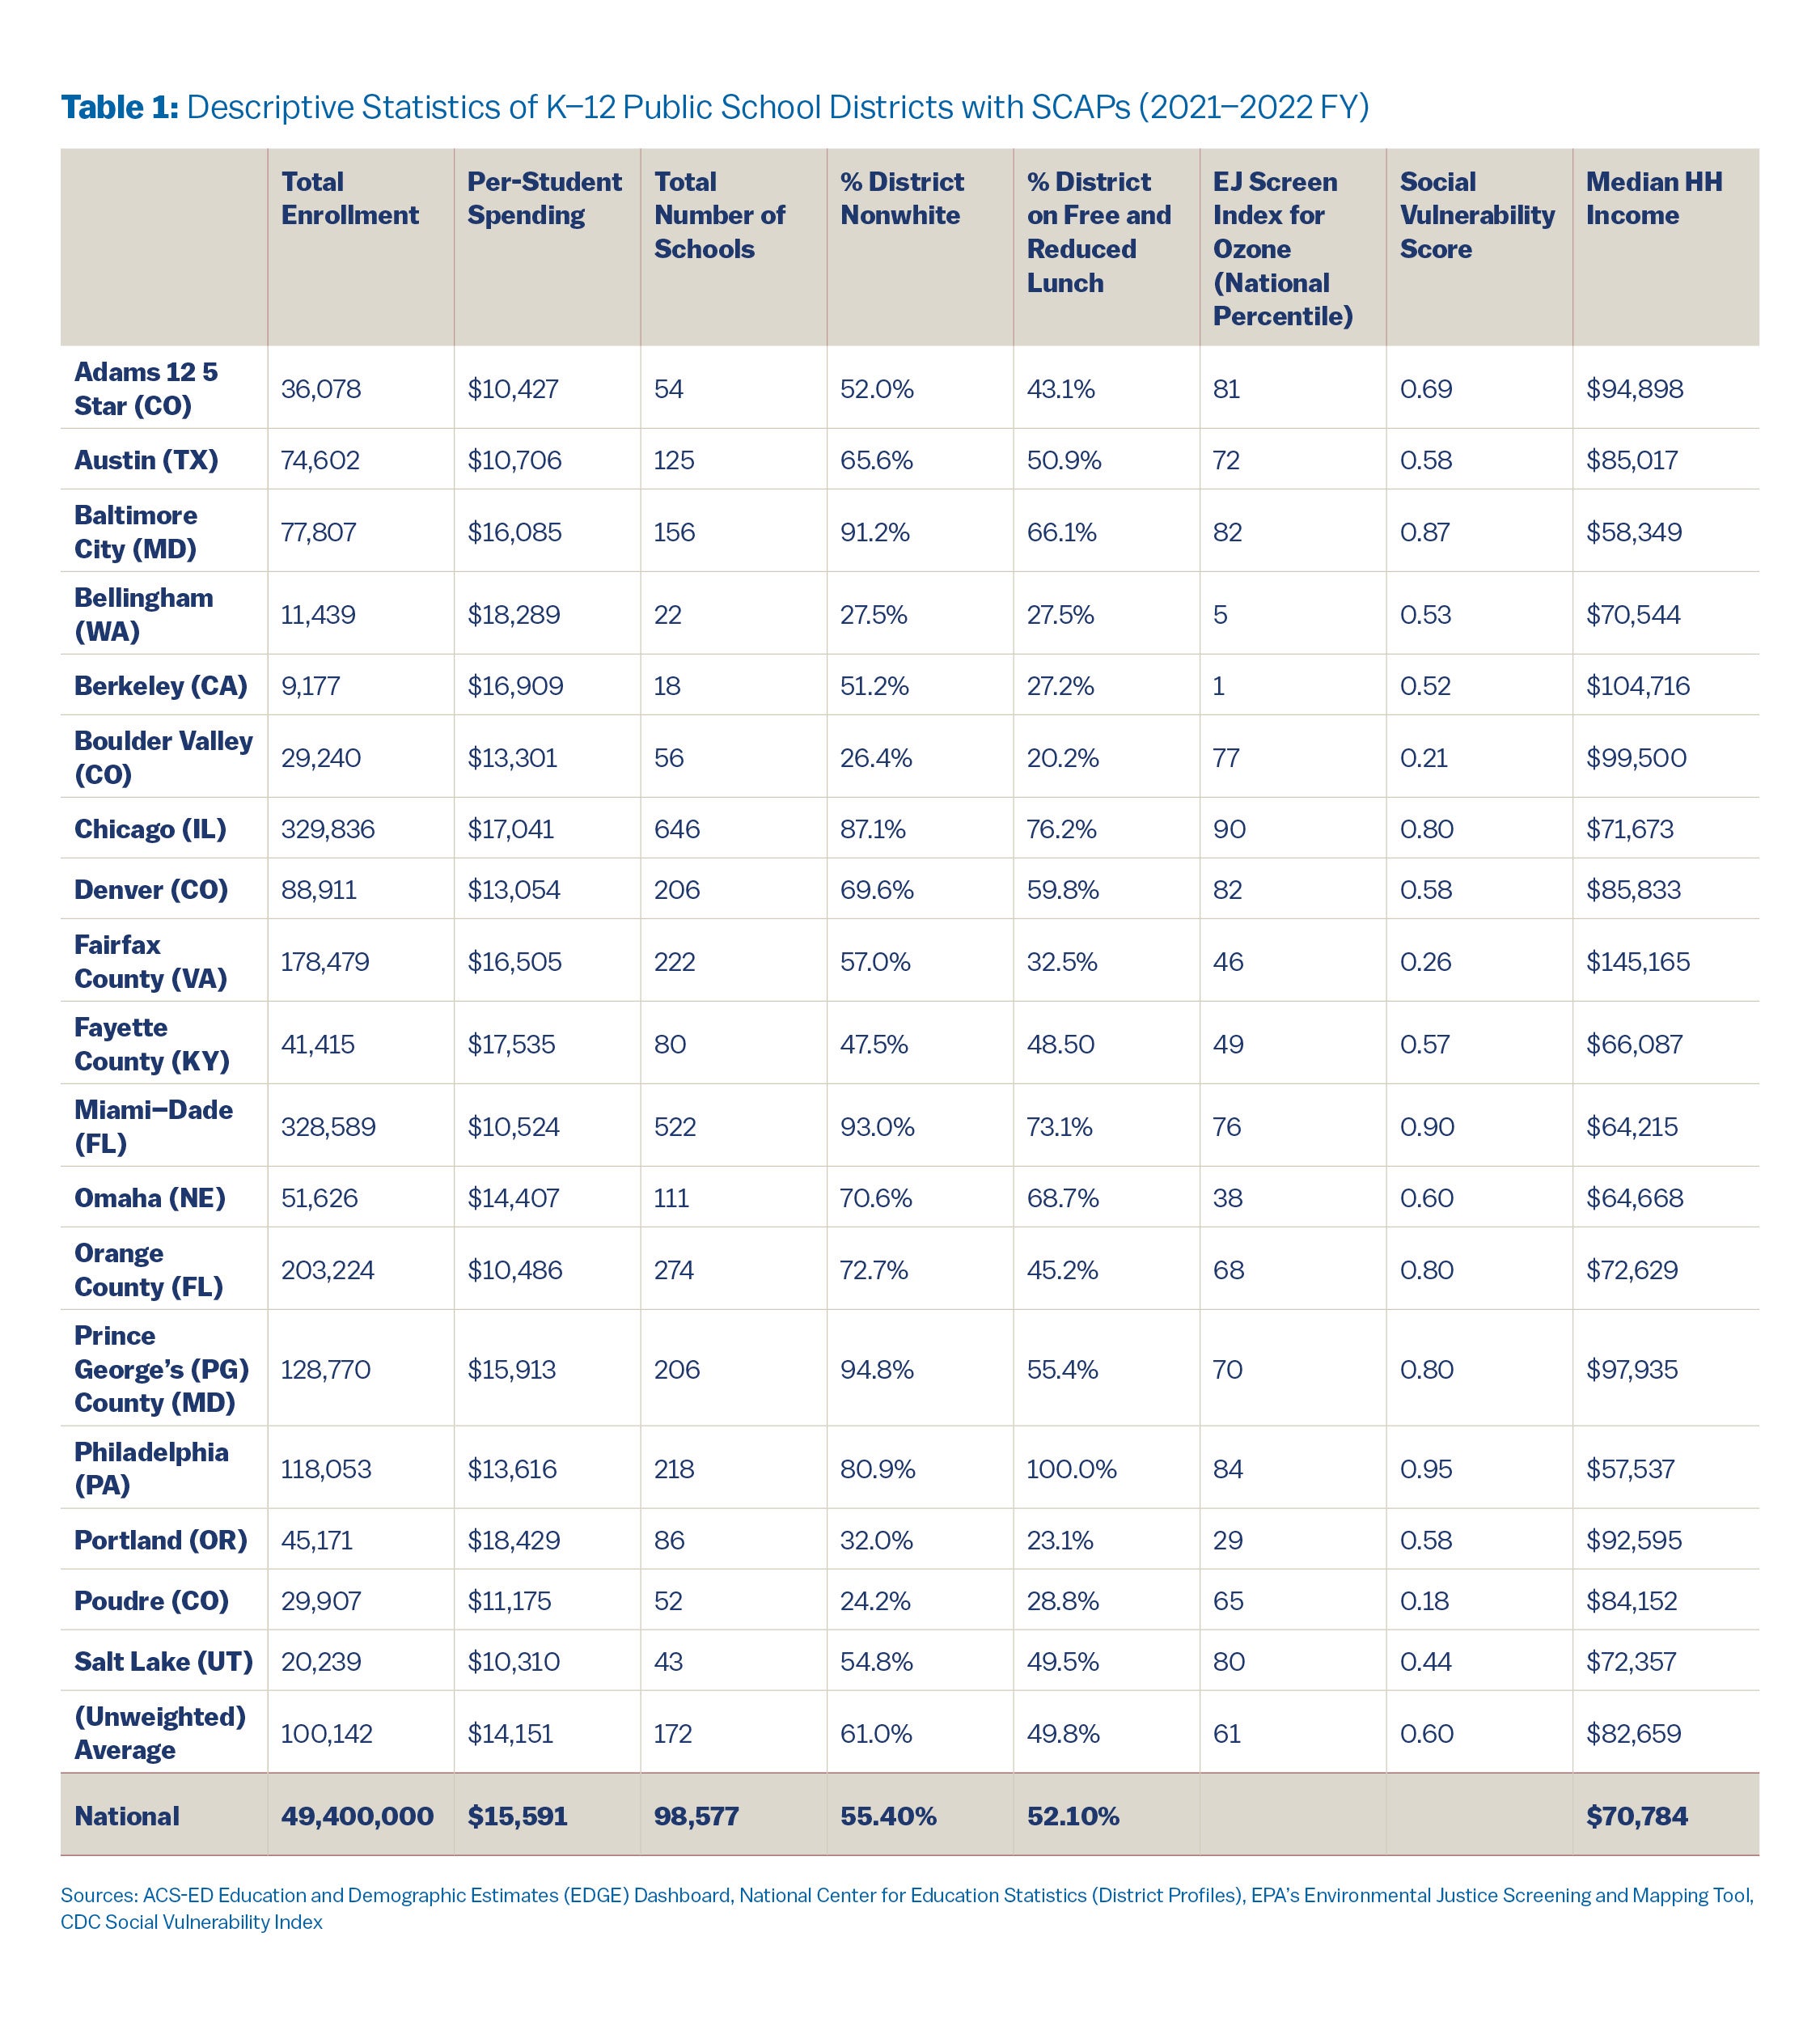
From this list, we narrowed it further to include only school districts with sustainability and/or climate plans (SCAPs). We define a plan as a public, written document that uses data (both quantitative and qualitative) to design a strategy to address a given problem within a defined place and time. This narrowed scope resulted in 18 school districts that were varied enough across existing conditions to produce a robust dataset for our analysis. Table 1 provides a summary of the school districts’ descriptive statistics, including data on enrollment, per-student spending, percentage eligible for free and reduced lunch programs, environmental justice screening and social vulnerability scores, and other relevant socioeconomic demographics of the district’s residential population.
Plan and Policy Document Analysis
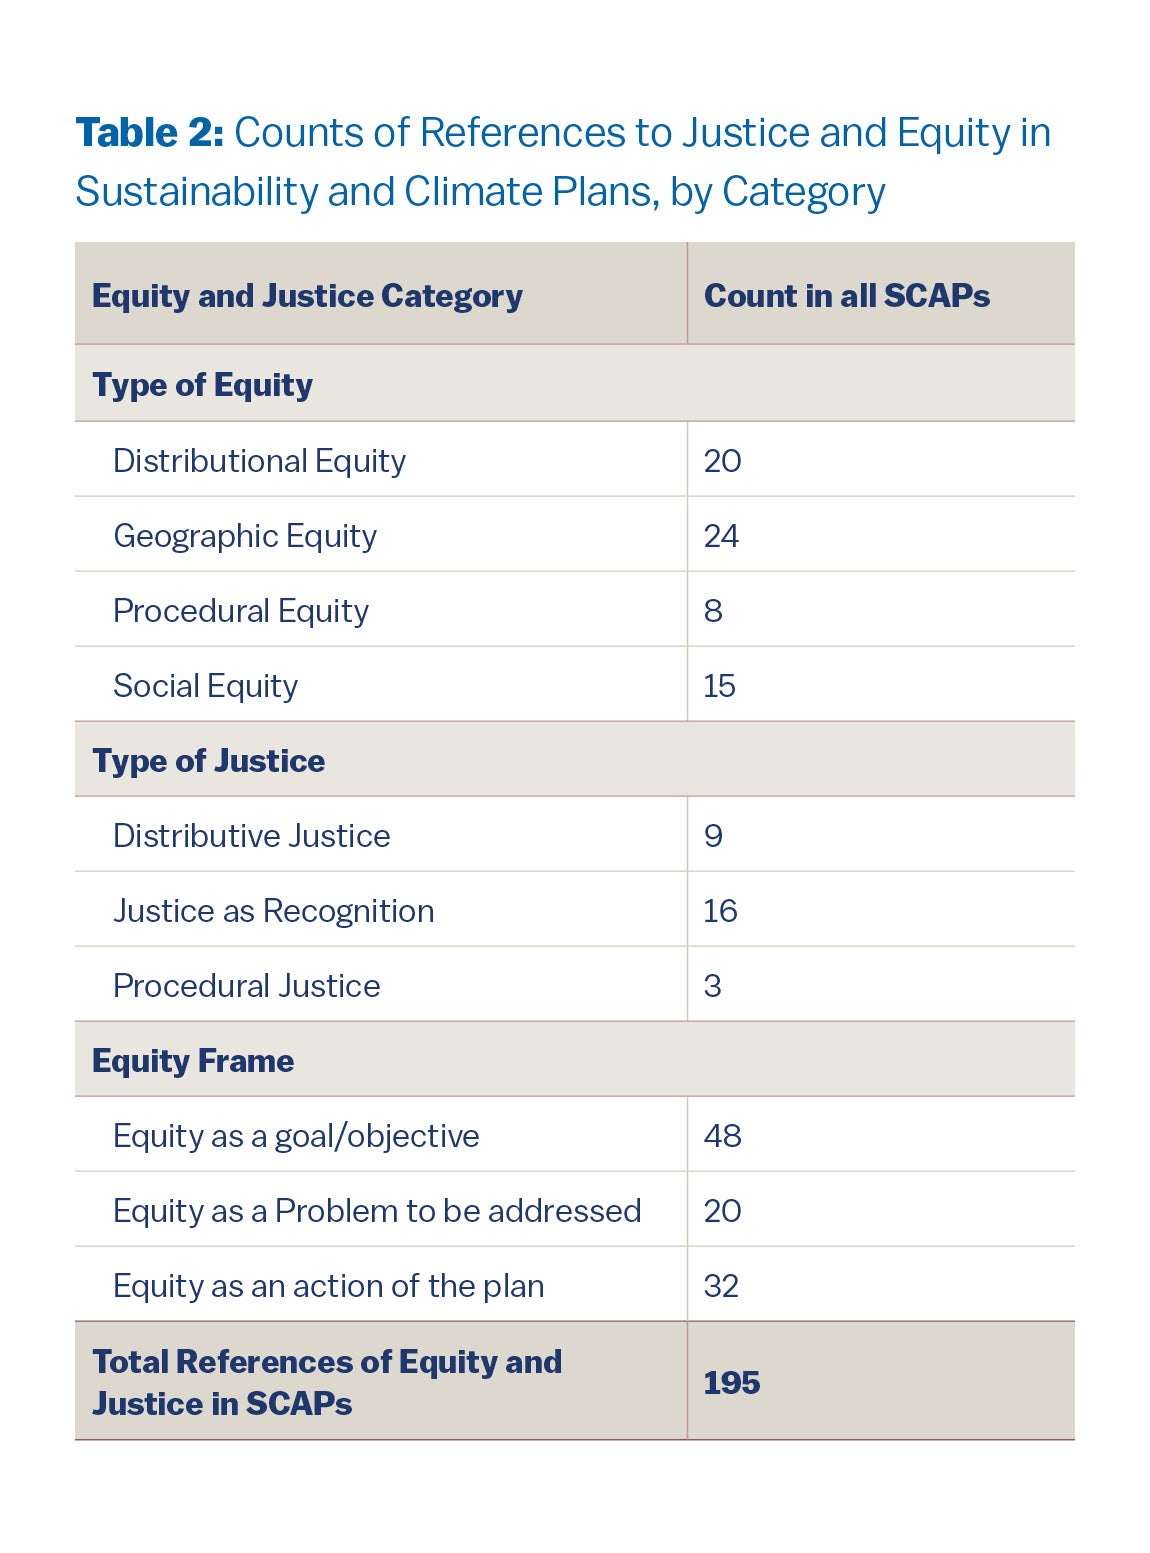
We assessed justice and equity in school plans through three methodological approaches. The first, informed by our review of the literature, is a content analysis of publicly available SCAPs and associated policies for the 18 school districts since 2015. We counted and coded all references to justice and equity in SCAPs and policies across three dimensions: type of equity (procedural, geographic, social, and distributional), type of justice (distributive, procedural, and recognition), and the use of equity in the plan (as a problem to solve, a goal to achieve, or an action of the plan). The summary of the counts from all plans by equity and justice typology are below in Table 2.
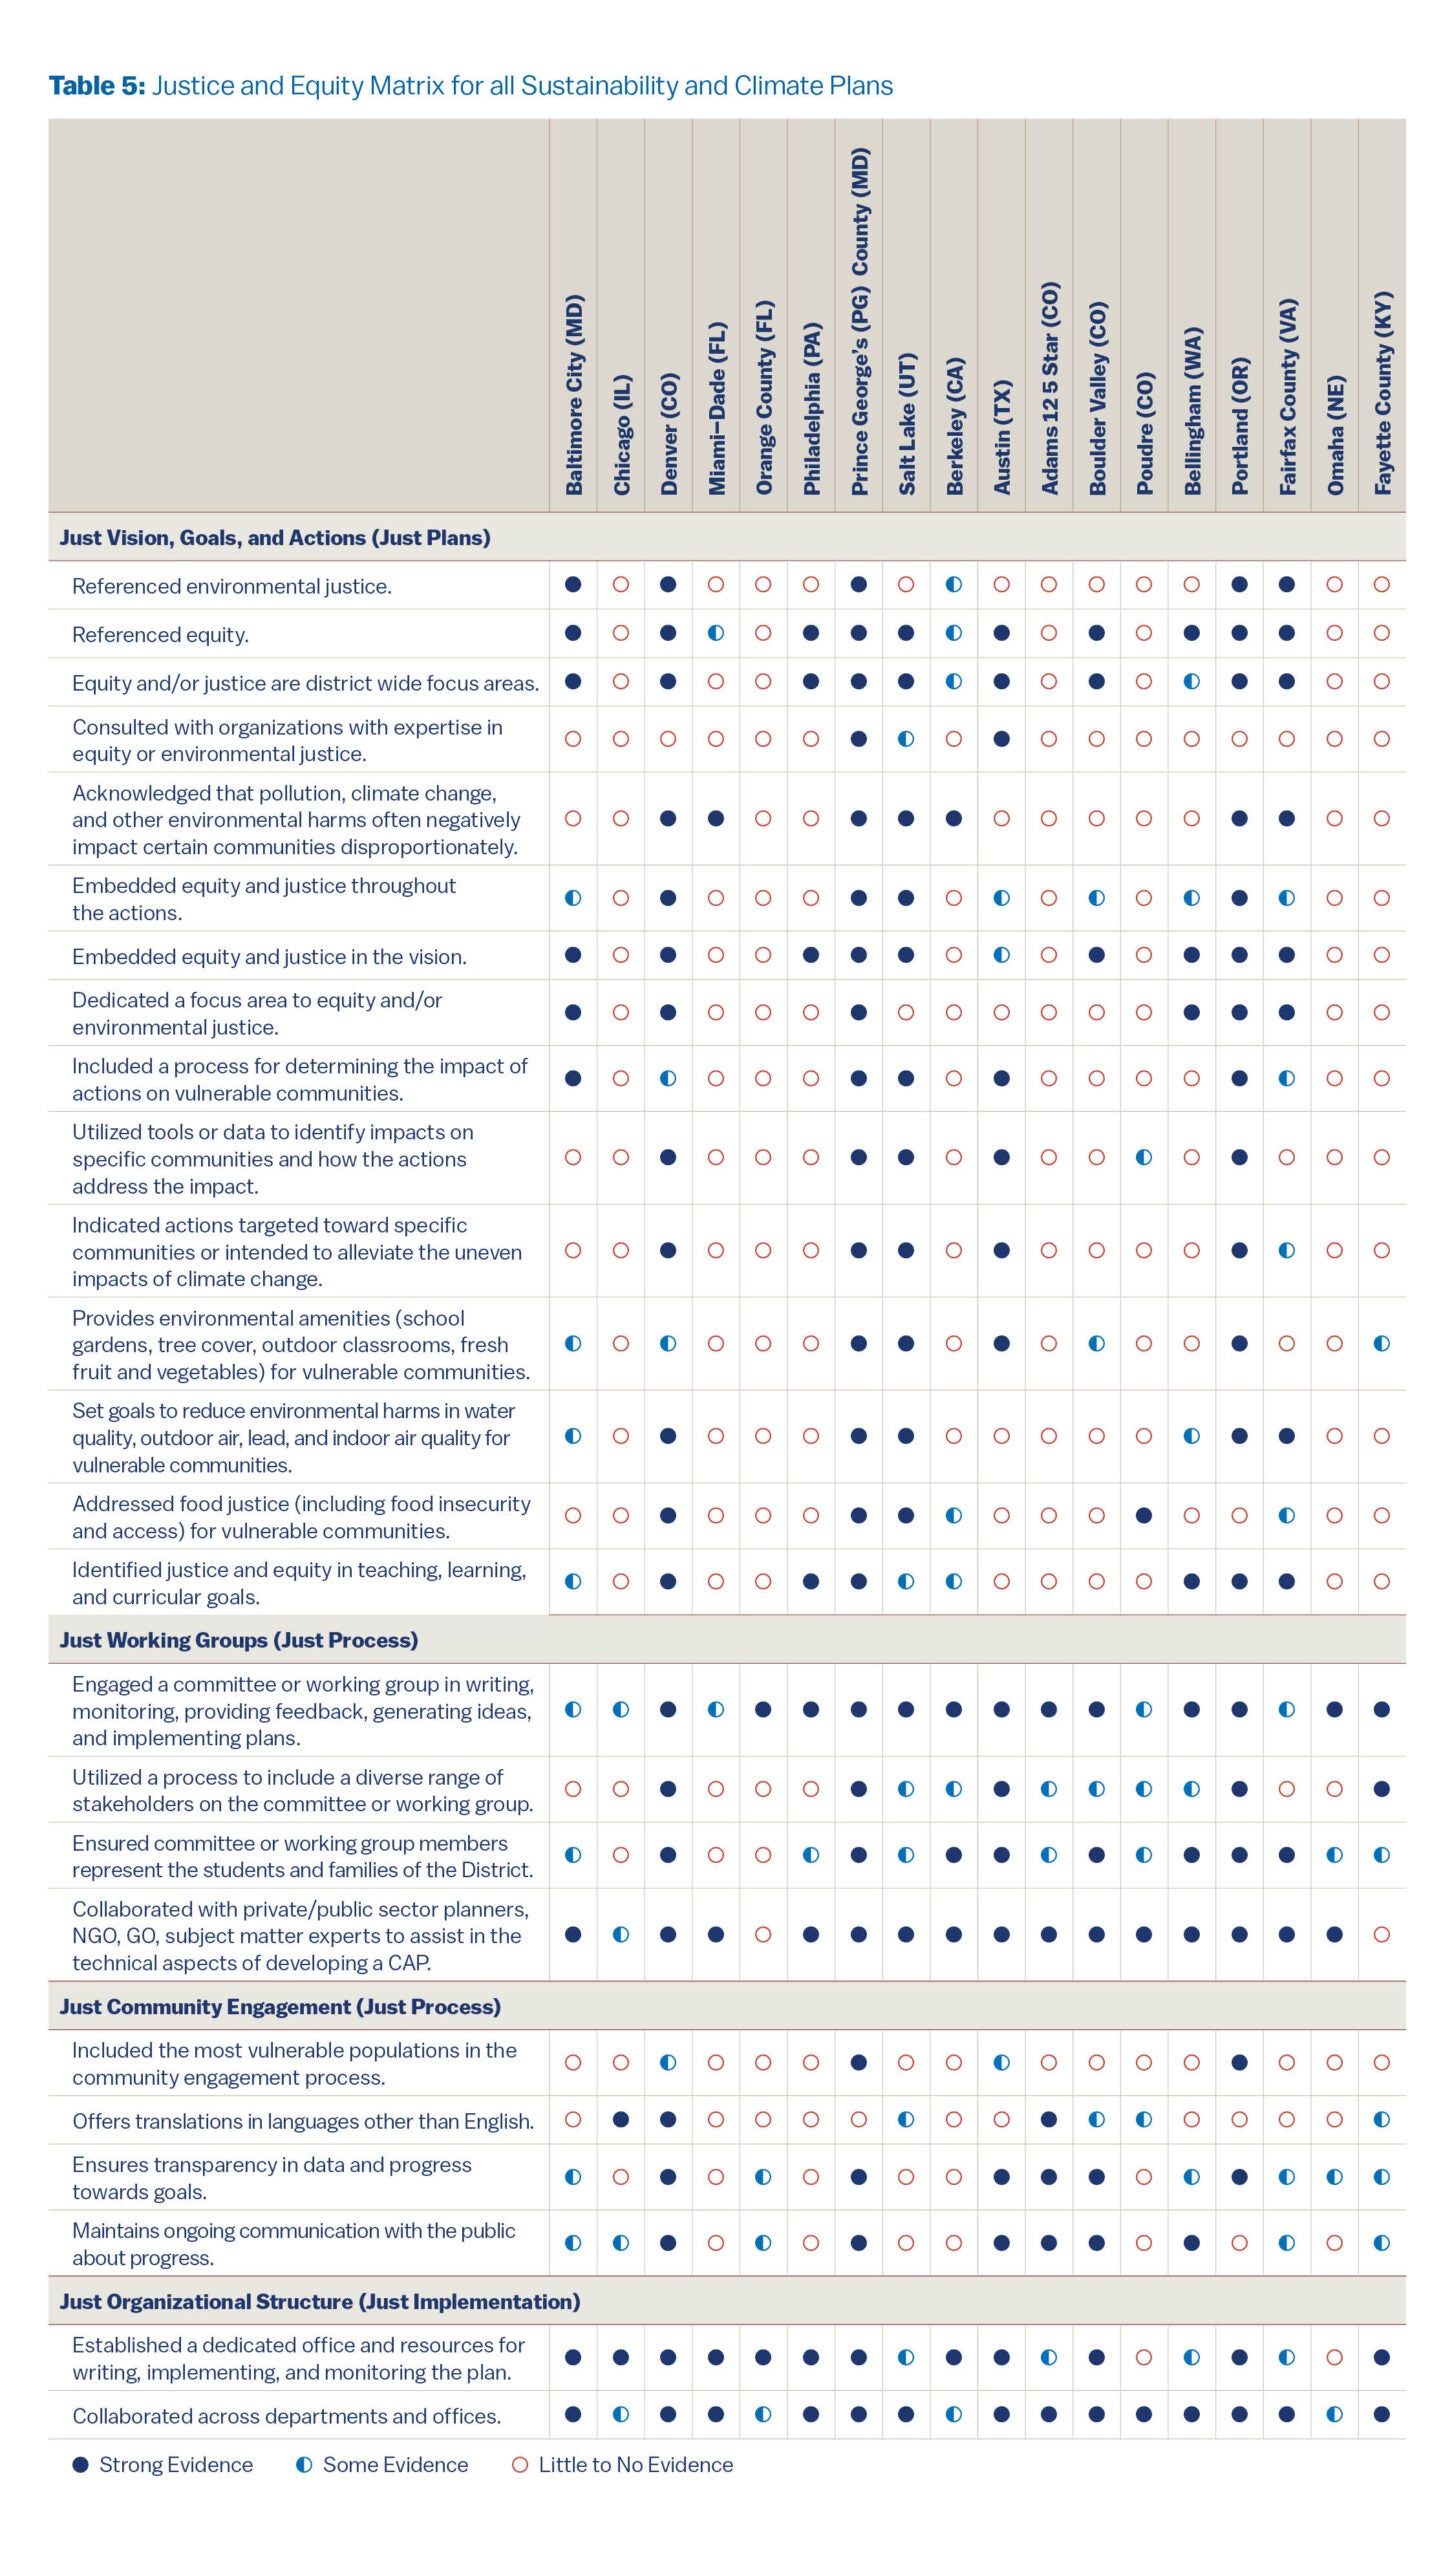
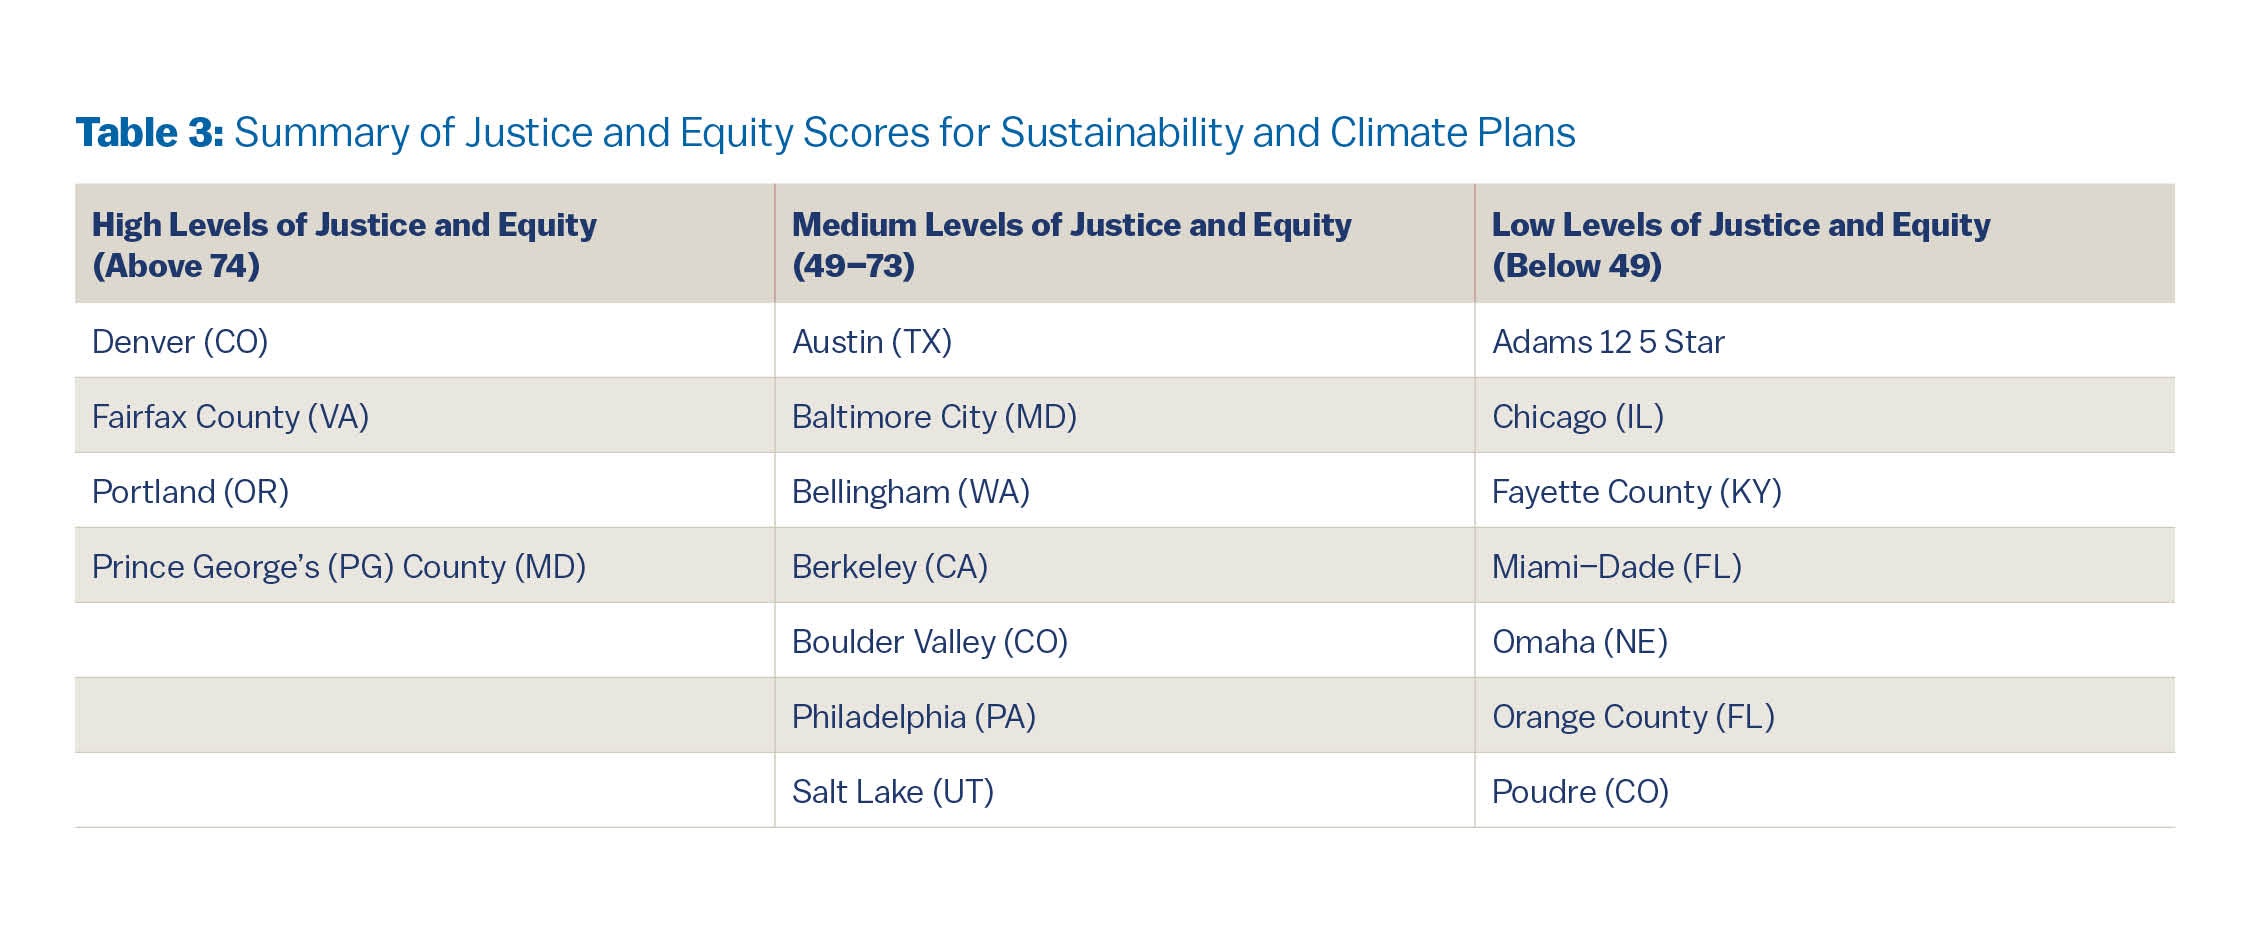
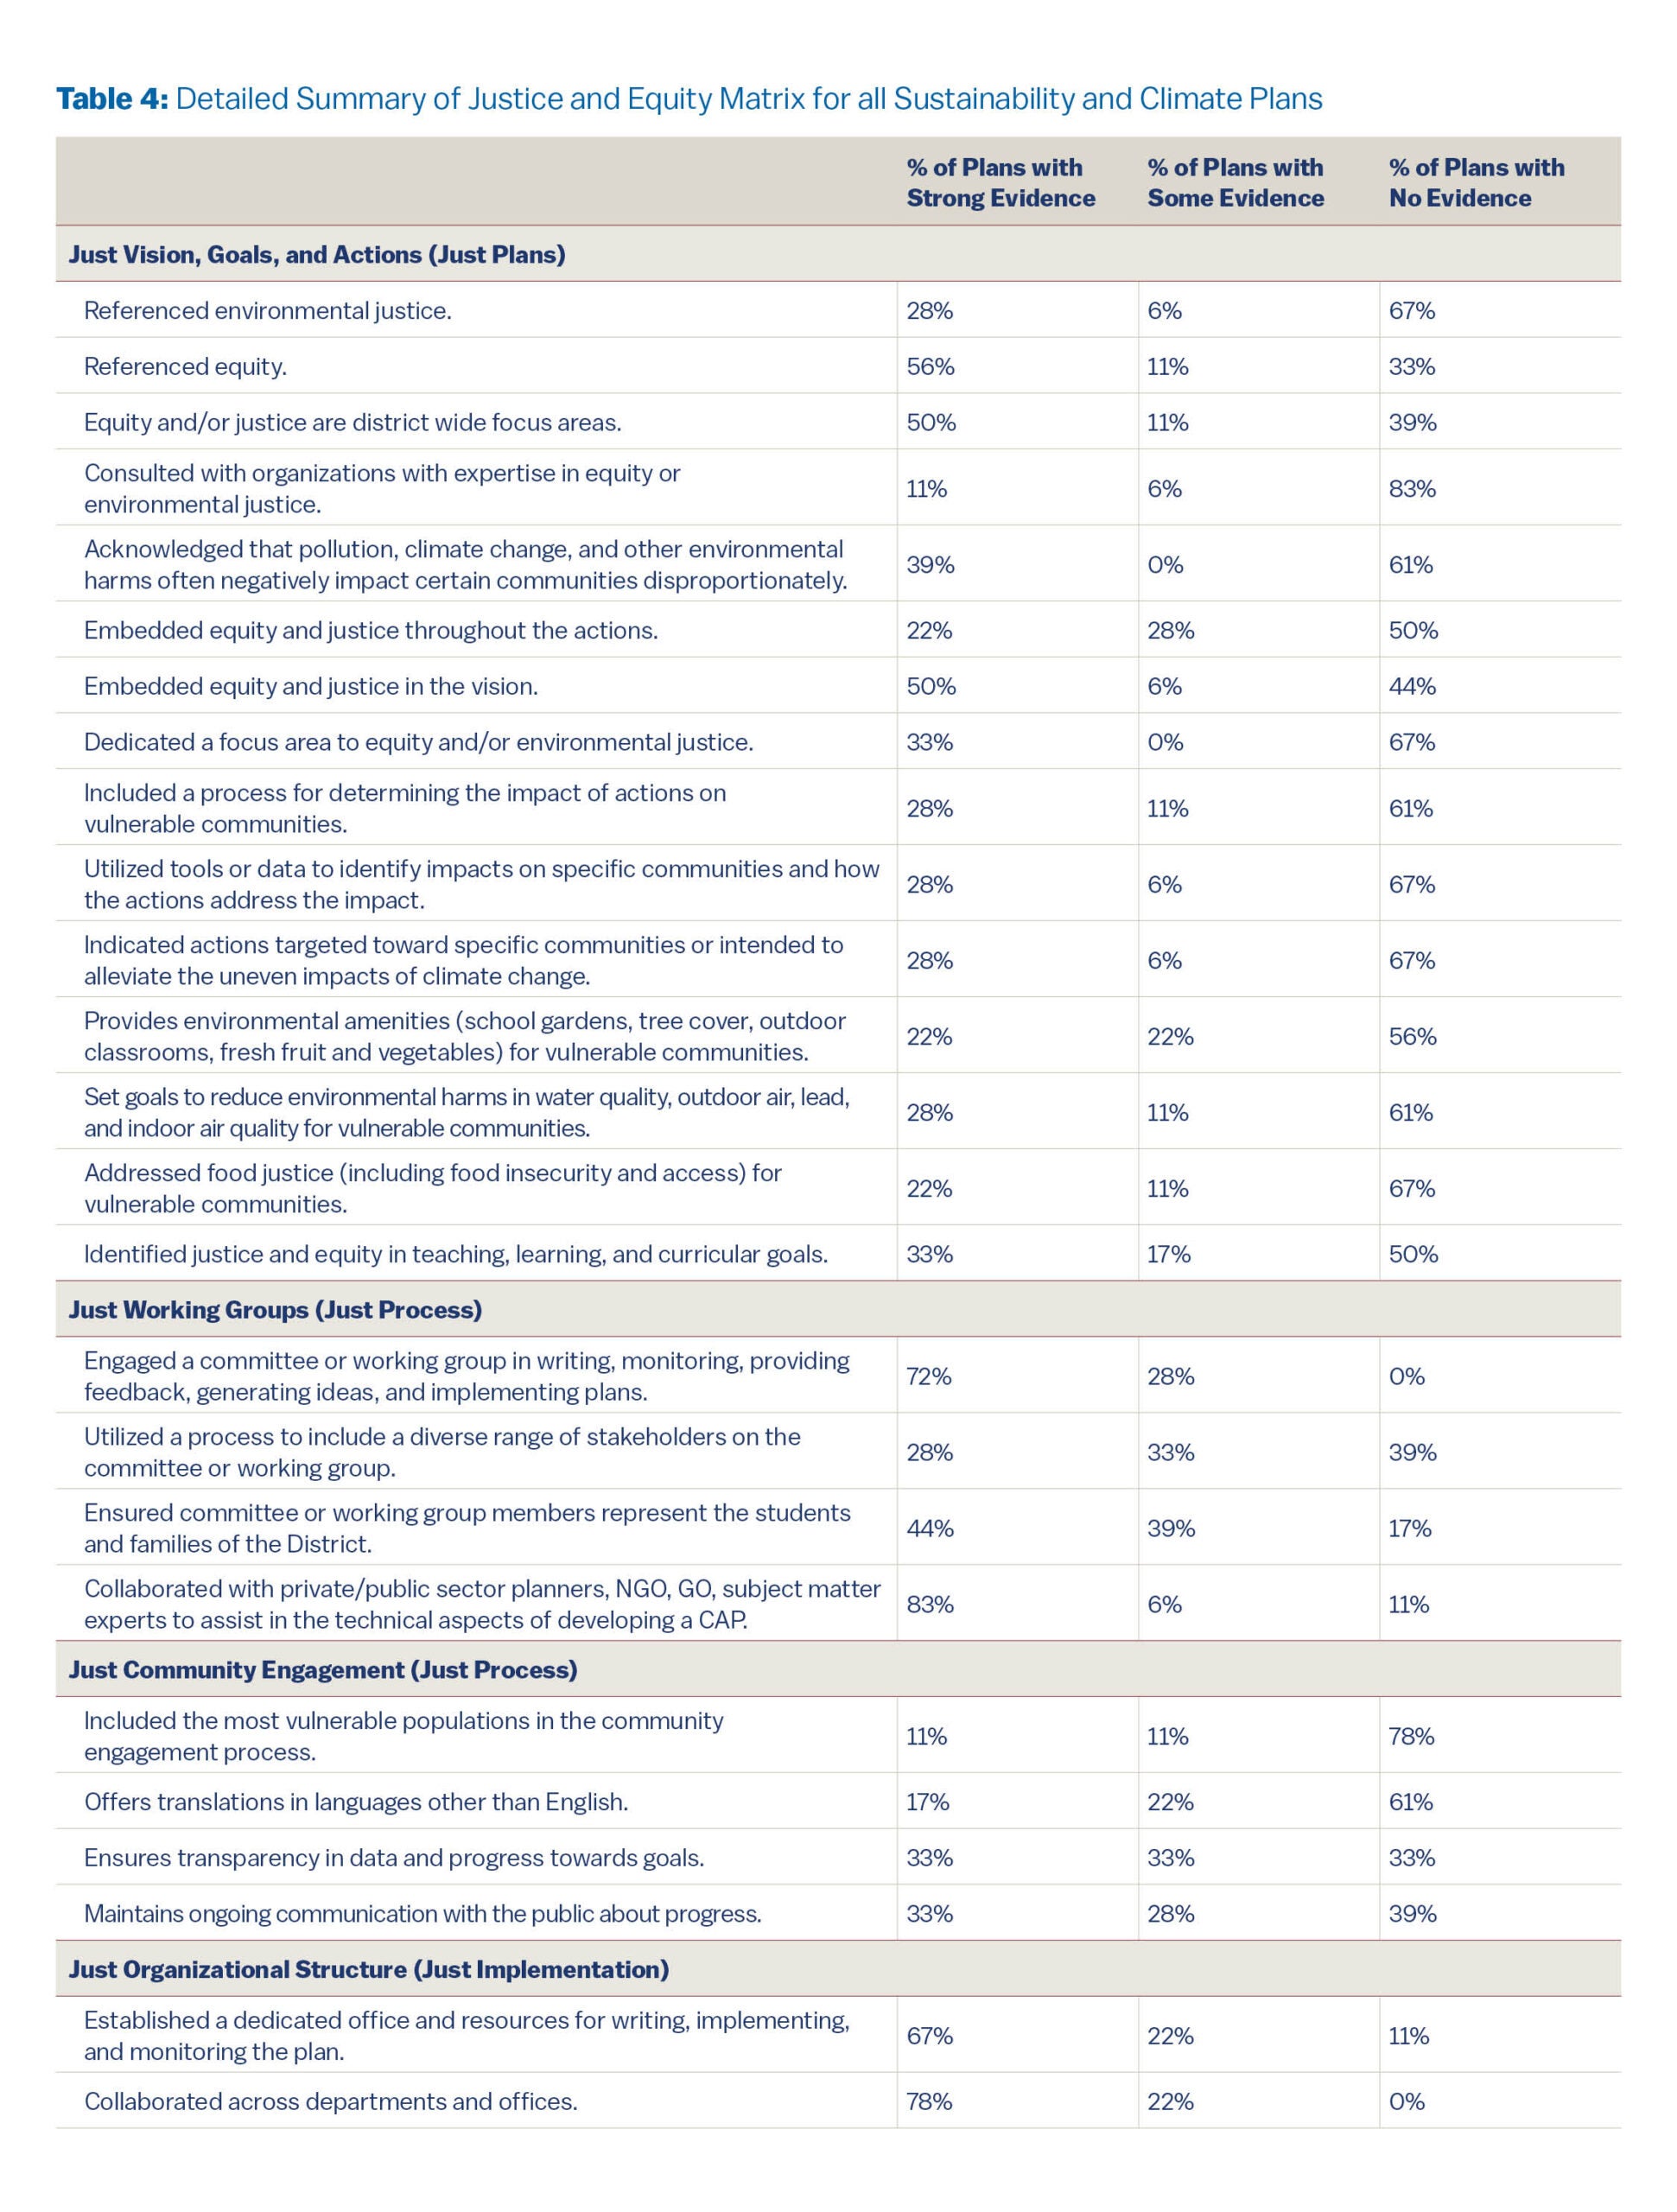
Also drawing from our extensive literature review, and consultation of best practices with CGS, we created a scoring matrix identifying 27 components of just and equitable SCAPs. The results of this matrix (see Appendix Table 1) allow for a standardized comparison between plans, using scaled scoring methods. We scored plans across each component on a categorical scale (3 = strong evidence; 2 = some evidence, 1 = little to no evidence), and totaled and indexed these scores into three broader categories for each SCAP (high, medium, or low levels of justice and equity—see Table 3 below).
Interviews with District Leaders
Once we scored and coded the SCAPs, we used interviews to fill in some of the gaps and contradictions we found in our content analysis. As an example, there would be many district plans that claimed to use equity as a frame (n=48), but few who were operationalizing this frame into any concrete goals, strategies, and actions.
To understand these complexities better, we reached out to all 18 school districts to interview leaders of their sustainability efforts. All interviews were conducted over Zoom, recorded with consent, transcribed, and coded. We utilized many of the same codes from our content and document analysis. We conducted eight interviews with sustainability leaders over a two-month period, which are the focus of this digest.
Results and Analysis
The results are organized around three major findings from our analysis (see Tables 2–4). The first finding is the use of equity as a frame—either as a goal to achieve or a problem to address—without proper techniques (such as baseline data collection, targeted engagement and priorities, or post-implementation evaluation and reporting) to procedurally achieve this goal.
The second is around capacity building. Like many other studies on climate and sustainability plans, the lack of capacity remains a major stumbling block to ensuring the longevity and impact of the SCAPs.
Finally, the role of climate action champions contributed to the increased focus on equity and justice in plans over time. These champions can come from the top (e.g., district leader positions) or bottom (e.g., student and teacher advocates).
Equity as a Frame
A major takeaway from public K-12 SCAPs is the importance of equity throughout the plans. Our initial content analysis of the 18 SCAPs produced high counts of references to equity, however, there were few mentions of justice. Nearly all but two SCAPs framed their goals or objectives around an achievement of equity, and many specified the type of equity which plan actions could address.
This was often the result of district-wide equity policies, that required the consideration and inclusion of equity as a goal in all district policies, programs, and plans. In our analysis, however, we found that there was little procedural action to support these equity goals. In our analysis of evidence supporting procedural justice and equity (or the search for concrete examples in plans that processes determining and implementing justice and equity are accessible and fair to all), we found few explicit mentions in the 18 SCAPs (see Table 2).
The plans themselves range in how they tackle equity. Some identified specific groups and geographies to engage and prioritize for plan implementation. In Austin, a district where half the population is eligible for free and reduced lunch, the plan’s engagement process was intended to inform and solicit data from historically marginalized populations:
“The [community engagement] process has also been fruitful in generating public awareness and interest in the District’s sustainability initiatives and in the ESAC [environmental stewardship advisory committee]. It also underscores the importance of conducting targeted outreach with priority for harder-to-reach audiences such as participation from Title I schools and their respective families.” (Austin ISP Sustainability Action Plan, p. 7)
In an interview with an Austin school district leader, it was noted how this equity frame pushed decision-makers to continuously interrogate their commitment to equity through a longstanding partnership with an Environmental Stewardship Advisory Committee (ESAC). The ESAC first emerged as a group of interested stakeholders committed to steering and implementing the plan.
Austin’s sustainability office soon shifted this group into a more targeted, equitable representation of the district’s most vulnerable and underrepresented populations, exemplifying a shift to justice as recognition in their planning process:
“This also stimulated a kind of a redo of our committee, so we had we realized that the voices on the committee weren’t representative of the communities we serve, and that we had a whole new application process and viewed applicants with a lot of this sustainability by design Framework in mind. Our metrics were around where they’re representing and things like that rather than interest. And so we’re going to start in September with a new committee. Yeah, with a lot of voices that haven’t been part of the conversation in the past.” (Interview with Austin ISD, August 2023)
Other school districts prioritized the use of baseline data and post-implementation evaluation and reporting to measure their commitment to equity. In Baltimore City Public Schools, a district that is 91% nonwhite and serves a population where two-thirds of the students are eligible for free and reduced lunch, the frame of equity was used to drive actions and measurable goals.
Capacity Building
Through our interviews and plan analyses, we noted that many SCAPs originated as cost-saving efforts to reduce energy expenditures for public school districts. After salaries, energy bills were the second largest expenditure for most districts. Many district SCAPs were led by energy professionals, with roles that either transformed into sustainability leaders or required them to lead in two roles. This limited capacity to implement the plan, especially its focus on equity and justice. But it also created new opportunities to bridge divisions in increasingly siloed school district bureaucracies.
“My position is an interesting one where I’m reporting directly to the chief of staff. And I don’t necessarily have efficacy in overseeing any one of the actual areas of implementation, but my role is really to help the chief of staff create and plan a system-wide structure for bringing people together between silos. To approach this work intentionally and with the justice-centered lens and to make sure that we have all these different pieces, whether it’s curriculum and operations speaking to one another… through this understanding of how could we use this work to really elevate and center our students that have the most need. It’s really complex…my job isn’t necessarily any one of those things, but it is kind of like all of those people together (Interview with Portland Public School district leader, November 2023).
In addition to the limited human capital available to staff and implement SCAP offices and plans, many sustainability leaders faced decreasing buy-in of the plans when focusing primarily on energy reduction. An interview with a district leader from Orange County, FL describes these limitations:
“The first strategies were really done at a district level and not focused on engagement of students, staff. It was really, transportation…energy conservation, but there were no real strategies within on how to engage” (Interview with Orange County Public School district leader, December 2023).
The Role of Climate Action Champions
SCAPs with high levels of equity and justice were served by many factors, but key among them was the role of climate action champions at the top and from below. In Prince George’s County, Maryland, one of our highest rated plans for justice and equity, our interview with district leadership credited the former superintendent as a critical champion. The superintendent aligned the SCAP and district’s strategic plan on equity, secured the resources to achieve both plans’ goals, and had the legitimacy to secure widespread buy-in across and within the school district.
“[the former superintendent] had overseen the new Strategic Plan…an equity strategic plan. At the beginning of our climate change action plan, we link to the strategic plan, so there is equity through the whole process… I think her ability to discuss that framework and her passion for it… We were able to tap into professors and academic leaders as well as the NAACP and grassroots leaders on environmental justice” (Interview with Prince George’s County Public School district leader, November 2023).
In Boulder Valley County, public school students, with the support of national youth organization Sunrise Movement, advocated for specific policies and legislation, such as the Green New Deal for Public Schools. Although Boulder Valley district leaders were already planning and implementing a SCAP, this renewed (and public) student advocacy pushed them to create more public-facing processes, goals, and communication of their SCAP.
“We have students who are more active than ever, so they’ve always been a voice in all these plans. We have a district-level Advisory Committee overseeing the plan, that has students as part of that committee. There have been students, for example, showing up at every board meeting this year, demanding action around climate and climate justice. And you know…admittedly, [they want change] faster than we’re going” (Interview with Boulder Valley County Public School district leader, November 2023).
Policy Recommendations and Conclusion
Based on the above analysis, we recommend three concrete policy actions to increase equity and justice in public K-12 sustainability and climate action plans:
- Greater cooperation with municipalities and counties on their existing sustainability and climate action plans
Many cities and counties have established SCAPs and offices, which a few district leaders acknowledged in their SCAPs and during our interviews. Nonetheless, most districts with low levels of equity and justice were not explicitly partnering with local sustainability planning efforts.
The administrative and institutional divisions between local planning offices and school districts create tensions in land use, transportation, housing, and sustainability planning efforts. Cooperating in joint sustainability and climate planning can increase resources and capacity for both groups, while also providing a united front to advocate and lobby for resources at the state and federal level.
- Increasing resources and capacity of sustainability officers to institutionalize ongoing engagement with stakeholders across district departments, schools, and communities
In order for the SCAP to have an impact on equity in a just way, district leaders need to invest in multiple resources to expand capacity. Leaders in districts with medium to high levels of equity and justice highlighted the vital role of students, teachers, and community members in maintaining the necessary accountability and transparency for just and equitable SCAPs.
The first is the ability to secure buy-in and legitimacy using data—both as a baseline of existing district conditions, and as a means of evaluating the progress in achieving equity. This requires an acknowledgement of the disproportionate impact climate change has on historically marginalized groups and populations (justice as recognition), of which there were few in our analysis. While many districts had data on energy use, few had comprehensive data on tree canopy, food sourcing, trash and waste, and environmental hazards.
Even fewer mentioned relying on any publicly available data at the city, county, or district-level, such as air quality and other environmental burden and social vulnerability data. Low-resource districts should partner with local sustainability offices to share data, priorities, and projects. The nearly universal focus on equity in most U.S. school districts provides an opportunity for municipal and county-level SCAPs to adapt this value as a priority in their processes.
- Lobbying for and leveraging federal opportunities to fund and maintain green infrastructure and green retrofits in school facilities
Many interviewees noted the importance of federal funding, especially that dedicated to improving air quality in classrooms following the COVID-19 emergency. For the first time in decades, new federal funding streams emerged (briefly) to improve environmental hazards in classrooms. A simultaneous subsidy to electrify school buses also increased resources for district SCAPs.
In addition, the Environmental Protection Agency (EPA) and the Department of Energy have small grants available to improve energy efficiency in public school facilities, prior to the elimination of virtually all these opportunities through the actions of the Trump administration. One major obstacle to these federal funds, which severely limited the impact of the COVID-19 funding when it was available, was the lack of capacity to complete federal grant paperwork for large-scale capital projects in the emergency timeline.
Shoring up capacity at the state and school district level to take on federal (and state) funds can address some of the resource inequities between districts and increase the ability to implement and sustain just and equitable SCAPs. School districts and state educational agencies should increase efforts around advocacy and lobbying for the return and permanency of federal funding for school infrastructure and climate resilience.

Akira Drake Rodriguez
Assistant Professor of City PlanningAkira Drake Rodriguez is an Assistant Professor of City Planning at the Stuart Weitzman School of Design. Her research examines the politics of urban planning.

Samantha Shasanya
Senior Development Operations Manager, Community VenturesSamantha Shasanya is a development operations manager at a non-profit affordable housing developer in Philadelphia. She holds a master of city and regional planning and a master of science in education from the University of Pennsylvania.
Campbell, Scott. 1996. “Green Cities, Growing Cities, Just Cities?: Urban Planning and the Contradictions of Sustainable Development.” Journal of the American Planning Association 62 (3): 296–312. https://doi.org/10.1080/01944369608975696.
Clark, Susan Spierre, and Monica Lynn Miles. 2021. “Assessing the Integration of Environmental Justice and Sustainability in Practice: A Review of the Literature.” Sustainability 13 (20): 11238.
Diezmartínez, Claudia V., and Anne G. Short Gianotti. 2022. “US Cities Increasingly Integrate Justice into Climate Planning and Create Policy Tools for Climate Justice.” Nature Communications 13 (1): 5763.
Fainstein, Susan S. 2014. “The Just City.” International Journal of Urban Sciences 18 (1): 1–18. https://doi.org/10.1080/12265934.2013.834643.
National Center for Education Statistics. 2024. “Table 214.10 Number of Public School Districts and Public and Private Elementary and Secondary Schools: Selected School Years, 1869-70 through 2022-23.” https://nces.ed.gov/programs/digest/d23/tables/dt23_214.10.asp.
Schrock, Greg, Ellen M. Bassett, and Jamaal Green. 2015. “Pursuing Equity and Justice in a Changing Climate: Assessing Equity in Local Climate and Sustainability Plans in U.S. Cities.” Journal of Planning Education and Research 35 (3): 282–95. https://doi.org/10.1177/0739456X15580022.
Walker, Laurens, E. Allan Lind, and John Thibaut. 1979. “Relation between Procedural and Distributive Justice, The.” Virginia Law Review 65 (8): 1401–20.