Electric Vehicle Penetration and Urban Spatial Restructuring: A Case Study of Beijing with Geospatial Machine Learning
Electric vehicles are proliferating worldwide, yet the urban infrastructure that must support them is often mismatched between demand and supply. This digest uses Beijing as a case study to explore how EVs are reshaping urban patterns.
At A Glance
Key Challenge
The non-linear and heterogeneous growth of electric vehicles creates complex demand patterns, making it challenging for urban planners to strategically deploy public charging infrastructure.
Policy Insight
Given the current concentration of PCS in urban centers, we propose shifting the focus of PCS deployment toward large-scale residential areas. Charging patterns indicate that a 1.5 km radius is a crucial threshold for peak charging activities.
Introduction
The number of electric vehicles (EV) on the road has been growing rapidly, reaching more than 60 million worldwide. Nearly 13 million EVs were sold in China alone, which is the world’s largest EV market. This exponential growth results both from the advancement of technologies, such as batteries, and from the generous incentives implemented by governments around the world. However, in many markets, issues have also emerged as cities are struggling to integrate EVs into their spatial and infrastructure planning.
Despite ambitious zero-emission targets, EV penetration remains a small portion of global transportation. Integrating EVs into urban environments, particularly assessing their impact on existing systems, is largely unexplored and uncertain. Rising EV adoption is also creating new costs and potential resource waste due to oversupply, especially in urban centers (Kang et al. 2022).
In typical Chinese urban centers, the average utilization rate of public charging infrastructure is below 13% (China Academy of Urban Planning and Design 2023). Cities often prioritize deploying numerous public charging stations in commercial areas, parks, transportation hubs, and other public spaces. However, many of these locations face oversupply and reduced service efficiency.
Furthermore, the link between increasing EV adoption and evolving urban spatial structures remains under-researched. This gap may lead to reduced investment returns and missed opportunities for sustainable planning. To improve infrastructure efficiency and resilience, planners must carefully consider integrating EV systems with the existing urban framework.
While the significant influence of growing EV penetration on future city structures is acknowledged, the details of this transformation are unclear. A critical need exists to explore the relationships between rising EV adoption and urban expansion patterns, including changes in land use dynamics and the interaction between EVs and public transportation.
To address these challenges, this study investigates the non-linear relationship between EV penetration rates and key aspects of the built environment. Utilizing multi-source geospatial big data, including anonymized residential data of EV users and charging request data from location-based services (LBS), we employ geospatial analytics and machine learning models.
First, GIS-based spatial analytics are used to visualize the residential patterns of EV users in relation to built-environment variables: land use mix, building coverage ratio, accessibility to public charging and transit, employment density, and local economic productivity (GDP). Subsequently, a machine learning model assesses the non-linear correlations between residential EV penetration rates and these built-environment variables.
Case Study and Data Source
This investigation centers on two key questions: how to quantify and assess the interaction between EV penetration and the evolving built environment in urban research, and how to inform EV proliferation in urban planning and governance. Beijing serves as the primary case study. As a global leader in EV promotion, Beijing incentivizes EV ownership through direct subsidies and exemptions from gasoline car restrictions. By 2022, over 600,000 EVs were registered in Beijing. This rapid EV growth is reshaping Beijing’s urban layout and influencing infrastructure strategies.
Beijing’s centripetal urban structure, defined by its ring road system, intricately interacts with the spatial distribution of population densities, shaped by historical and economic forces. The increasing number of EVs and their supporting infrastructure are now integral to this dynamic, actively influencing the city’s ongoing development. As EVs become a dominant feature of Beijing’s transportation, understanding their reciprocal effects on urban spatial transformation is crucial for future infrastructure decisions and urban governance strategies.
The datasets for this study originate from various channels. The principal spatial unit of analysis is the urban parcel, representing built-up areas and serving as the foundational unit for spatial analysis and modeling (Gong et al. 2020).
We compiled 24,778 EV charging records (from public stations in November 2019), and EV owner home locations were derived from location-based services (LBS) data sourced from Baidu Maps, China’s leading mobile map service. After data cleaning, the final dataset used for analysis and modeling comprised 2,970 parcels with 20,387 active EV residents (engaging in public charging). EV users were aggregated to urban parcels and spatially integrated with other variables using ArcGIS Pro.
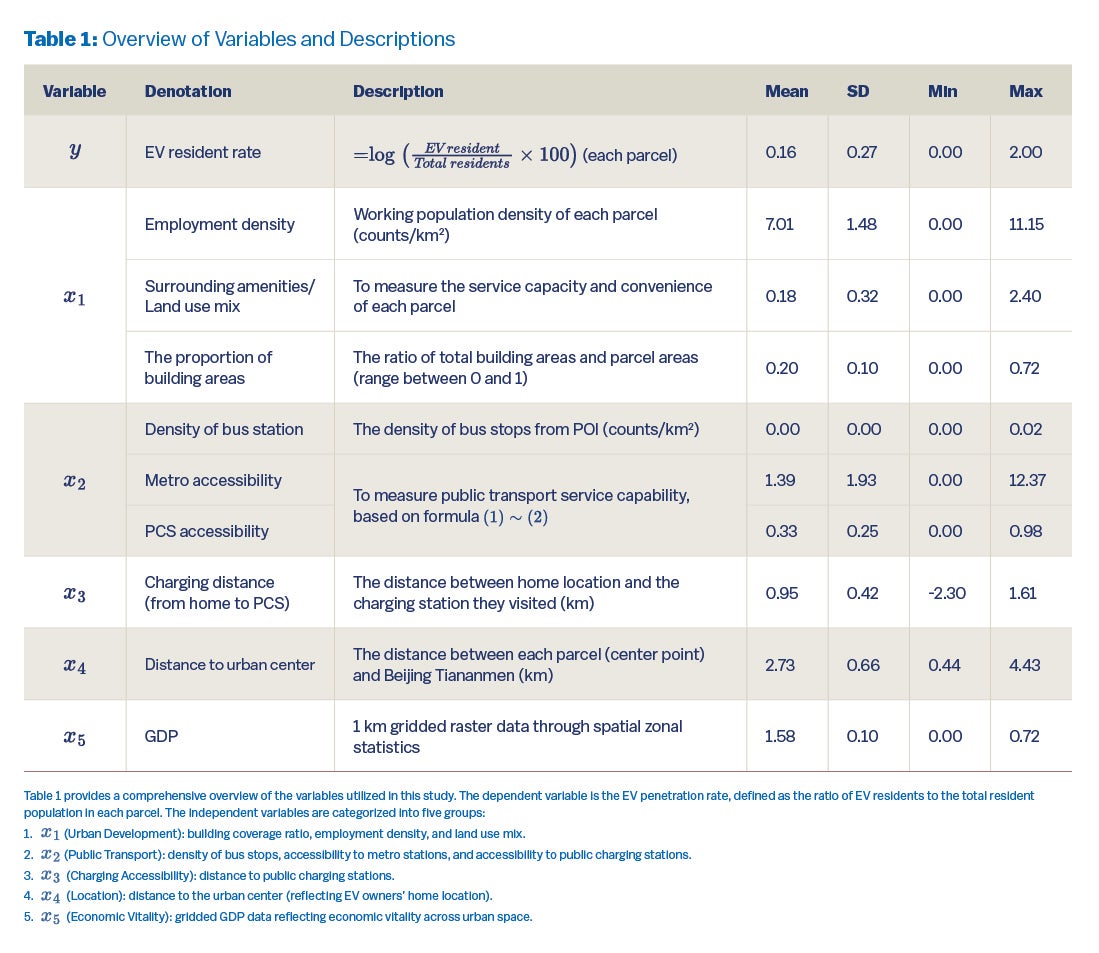
Table 1 provides a comprehensive overview of the variables utilized in this study. The dependent variable is the EV penetration rate, defined as the ratio of EV residents to the total resident population in each parcel. The independent variables are categorized into five groups:
- X1 (Urban Development): building coverage ratio, employment density, and land use mix.
- X2 (Public Transport): density of bus stops, accessibility to metro stations, and accessibility to public charging stations.
- X3 (Charging Accessibility): distance to public charging stations.
- X4 (Location): distance to the urban center (reflecting EV owners’ home location).
- X5 (Economic Vitality): gridded GDP data reflecting economic vitality across urban space.
Euclidean distance is used as the distance metric. Gridded GDP data is sourced from remote sensing-calibrated nighttime light data (Chen et al. 2022). Accessibility to metro and public charging stations is gauged by public transportation service capabilities. Population and employment densities are derived from Baidu heat map big data, a validated source (Fang et al. 2020).
Densities of public transportation services (metro stations, bus stops, public charging stations) and surrounding amenities (land use categories) are measured using point of interest (POI) data. The service capacity and convenience of these amenities are calculated using the land use mix entropy approach, considering supermarkets, commercial buildings, primary and middle schools, universities, hospitals, and entertainment venues. The formula reads:

Here, ci represents the ratio of each surrounding amenity category within each parcel, and N is the total number of amenity categories, which is six in this study.
Accessibility was calculated using the cumulative opportunity method to evaluate spatial separation effects (Xiao et al. 2017).

Here, Aij represents the accessibility index, summarizing the service capacity and convenience of surrounding amenities for residents in each parcel. The term dij denotes the Euclidean distance from the center of parcel i to amenity j. The threshold distance, R, is set at 1.5 km, a value commonly used in studies as a walkable distance for typical daily life circles.
GIS-Based Mapping and GBDT Model
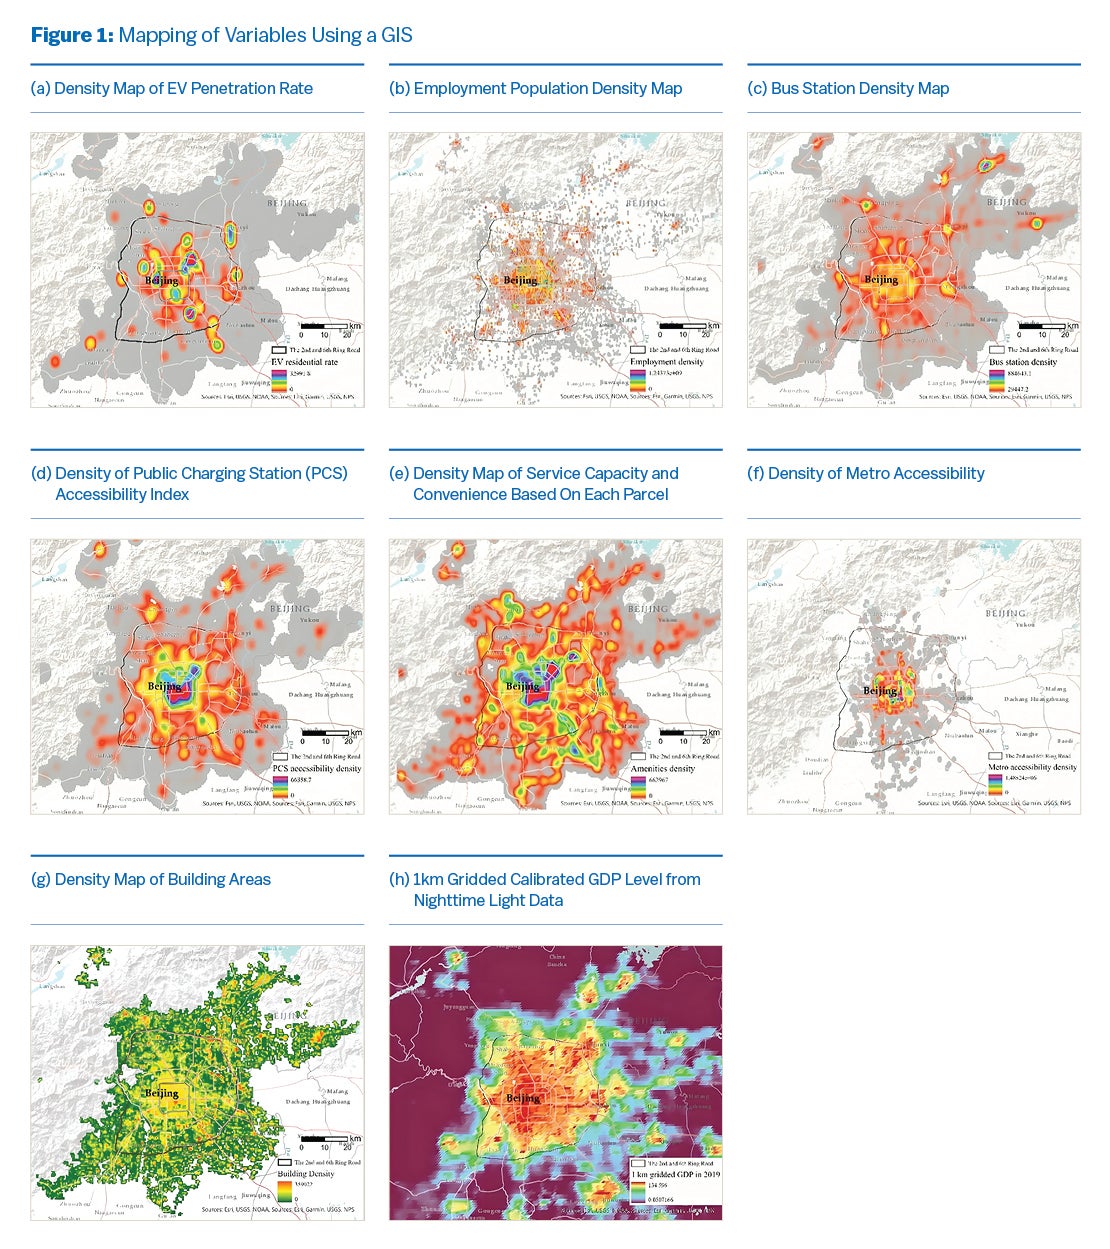
We employed the kernel density estimation (KDE) method in ArcGIS, using the parcel as the spatial analysis unit, to visualize the selected variables. KDE, a common spatial analysis technique, generates a smooth density surface from point features by estimating feature intensity as density.
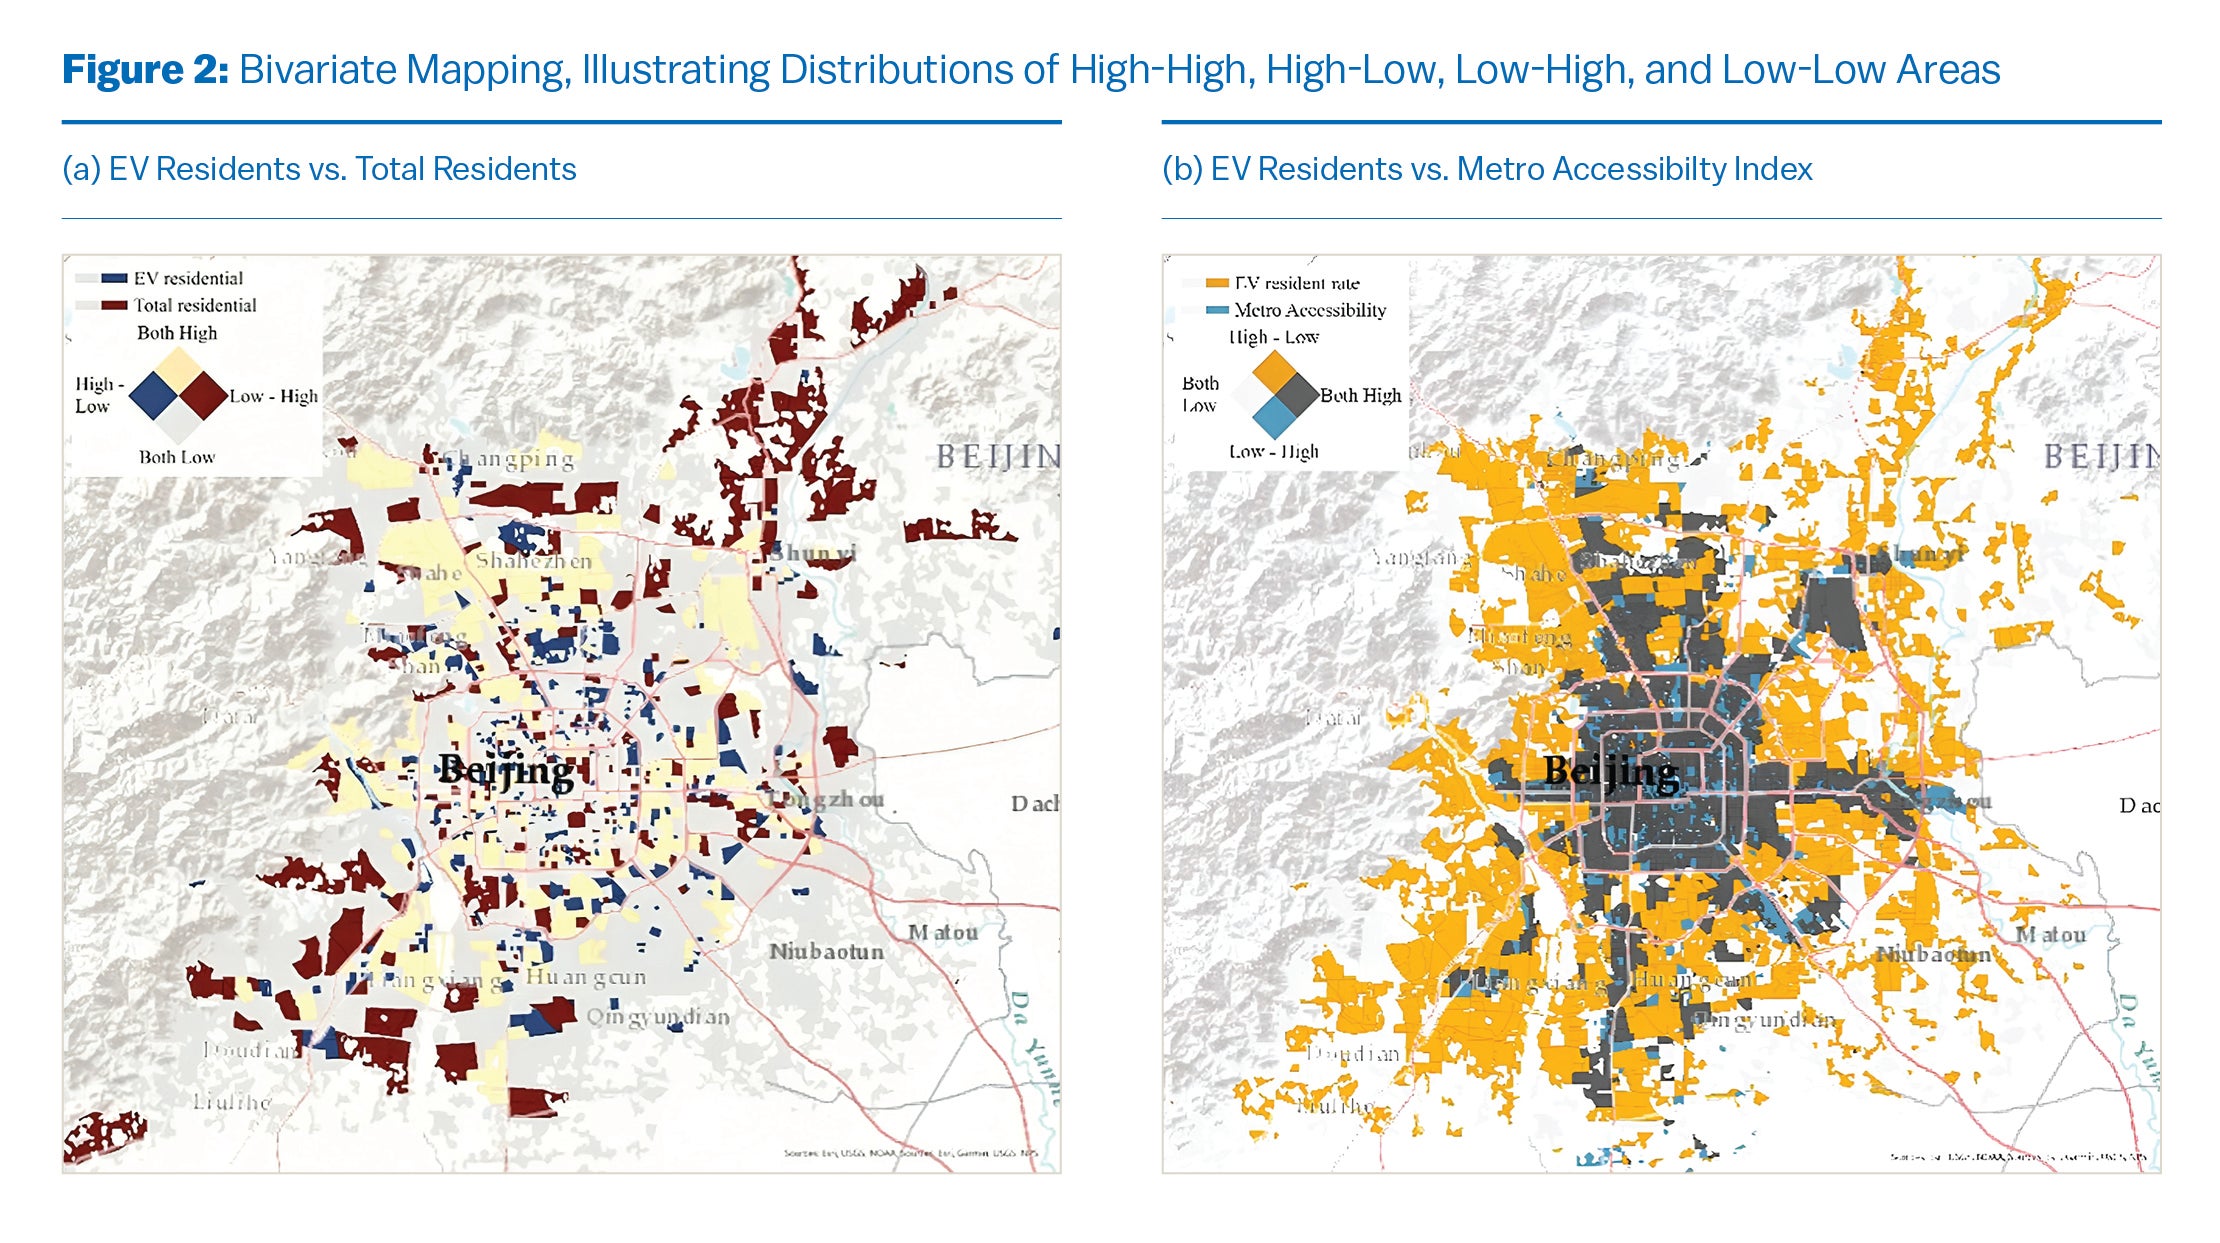
These visualizations help illustrate the spatial patterns and characteristics of different variables across urban areas, accounting for distance decay effects. Additionally, bivariate categorical mapping was used to depict the distribution of EV residents in relation to resident population and metro accessibility. Visual interpretation of these maps allows for the initial discernment of spatial associations between independent and dependent variables.
Furthermore, we employed the Gradient Boost Decision Tree (GBDT) method to analyze the nonlinear associations between EV penetration rates and built environment attributes near EV users’ home locations. GBDT is well-suited for handling heterogeneous data (e.g., features on different scales) and automatically detects nonlinear feature interactions, offering advantages over other machine learning models for diverse challenges.
In this study, the Gradient Boost Decision Tree (GBDT) model uses y as the dependent or predicted variable (EV penetration rate per urban parcel) and x as the independent variables (built environment variables x1~x9, categorized into four groups). The dataset was split into 80% for training and 20% for testing.
The algorithm aims to learn a predicted expected function f(x) as a linear combination of N additive decision trees

by minimizing a specific loss function L(y,f(x)) (in this case, a Gaussian loss function, generally used for continuous dependent variables). Here, N represents the number of trees, and αn and θn are the weight and parameter set of the n-th tree β(x,θn), respectively.
Findings from Geospatial Analysis
Figure 1 illustrates the kernel density mapping of EV penetration rates and other variables relevant to EV residential patterns. Figure 1(a) shows that high concentrations of EV residents are located in specific zones between the fourth and fifth ring roads, rather than in the urban center (within the second or third ring road) or the far suburbs (outside the sixth ring road).
Notably, EV resident density doesn’t show a clear linear correlation with distance to the urban center, suggesting a nonlinear relationship with urbanized space in these areas. The bivariate map in Figure 2 reveals a consistent distribution of EV and total residents in the yellow parcels, with high densities for both observed between the fourth and fifth ring roads, particularly in the north.
Blue parcels indicate a relatively higher EV resident density, while red parcels show a comparatively lower density. Southwestern and northeastern areas, especially beyond the sixth ring road, have a smaller proportion of EV users. This spatially adjacent but differentially distributed pattern suggests a potential relationship between EV resident locations and surrounding built environment variables, such as metro accessibility (Figure 2b).
Interestingly, high metro accessibility is concentrated within the fourth ring road, extending north and south. However, a relatively high proportion of EV residents persists in suburban areas (between the fourth and fifth ring roads) despite low metro accessibility, indicating EVs’ potential as mobility alternatives in areas with limited metro access.
Findings from the GBDT Model
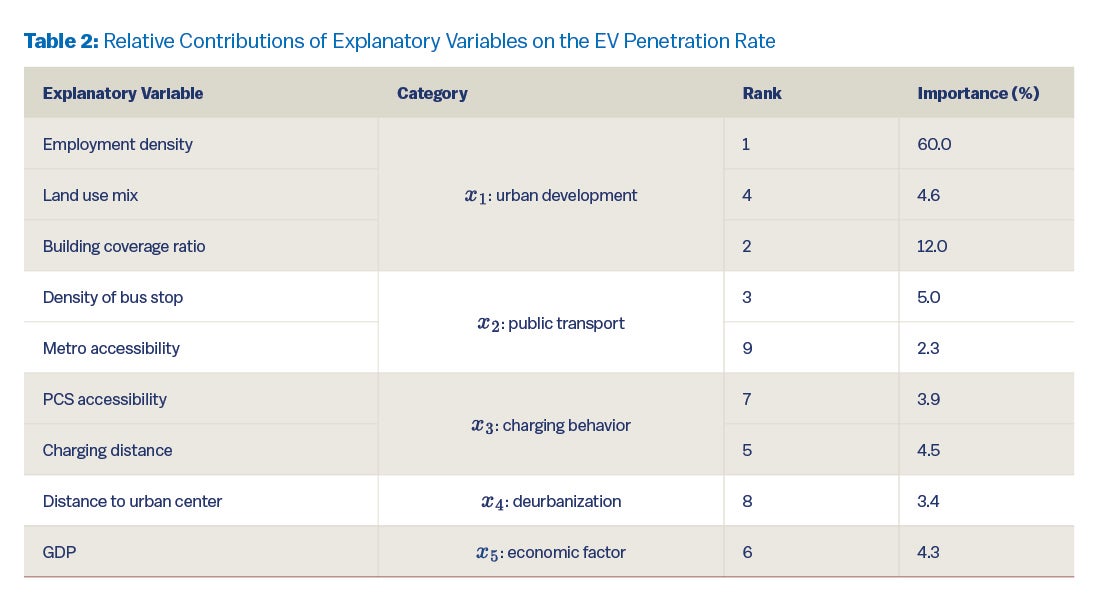
Relative Significance of Explanatory Variables
Table 2 presents the importance and ranking of selected explanatory variables for EV penetration rates. Employment density emerged as the most critical factor, accounting for nearly 65% of the explanatory power. This indicates a significant impact of employment distribution on EV adoption. The proportion of building areas was the second most important variable, with a relative contribution of 11.6%.
This influence is logical, considering the infrastructure requirements for EVs, particularly when retrofitting existing buildings. The proportion of building areas reflects both parcel development and building occupancy.
The impact of public transportation density and subway station accessibility was relatively minor, with public transportation density being more influential. This suggests that private EVs often serve as a supplement in areas with insufficient public transit. Distance to public charging stations from residences ranked fourth, indicating some individuals’ potential reliance on public charging.
While the accessibility of public charging stations also had a relatively small impact, it suggests a potential mismatch between supply and demand, as discussed in previous studies (Kang et al. 2022). These studies highlight that most charging stations in Beijing are currently located in commercial areas, with less deployment in residential areas, particularly in the suburbs.
GDP (representing economic activity), land use mix (representing surrounding convenience), and distance from the city center (representing de-urbanization) showed relatively lower effects on the EV penetration rate.
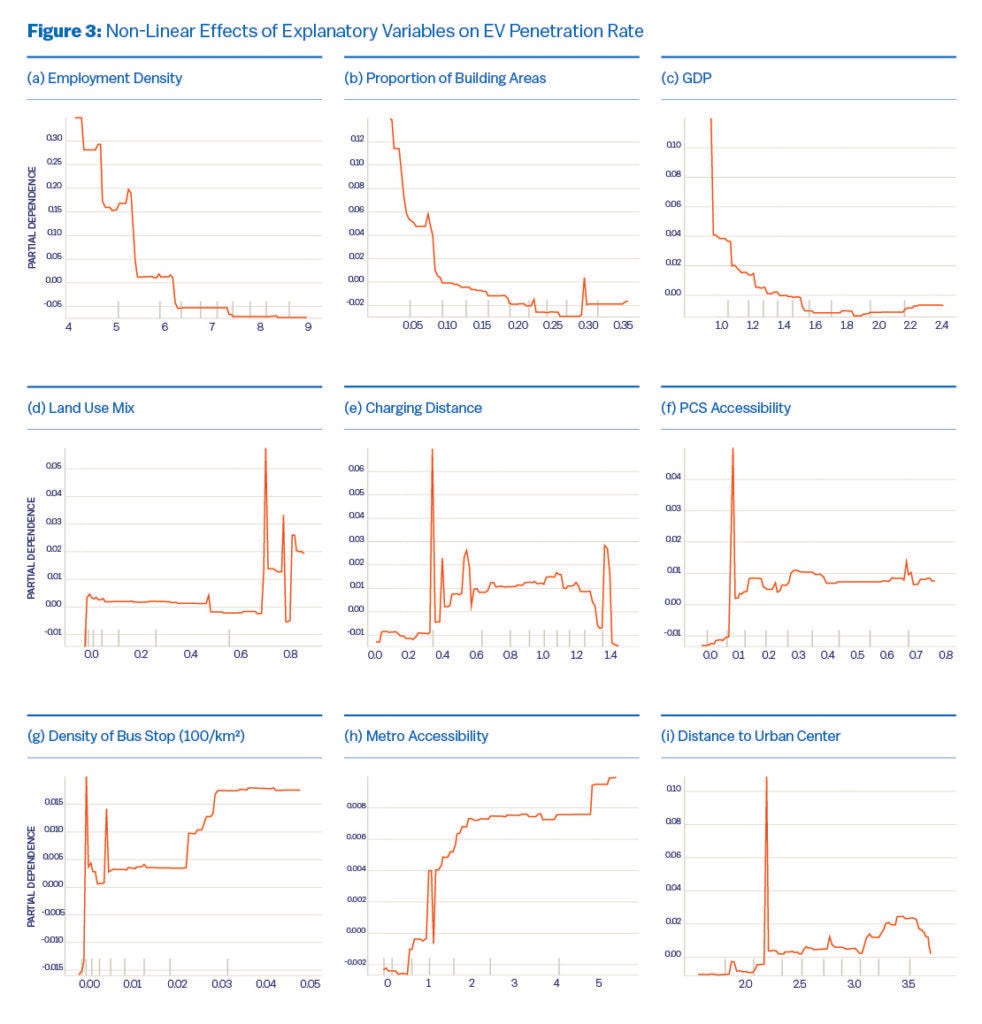
Nonlinear Impacts of Explanatory Variables
Figure 4 illustrates that most built-environment factors exhibit nonlinear and threshold effects on EV penetration rates. The interpretation of these results is presented in four aspects. Regarding the relationship between EV penetration rates and economically related variables in Figure 3(a)-(d), we examined changes in EV penetration with increasing (a) employment density, (b) proportion of built area, (c) GDP, and (d) land-use mix.
Generally, employment density, the proportion of built areas, and GDP show a negative correlation with EV penetration rates. From an economic standpoint, this suggests that developing regions within the city are more likely to favor EVs, aligning with previous studies (Chen et al. 2008; Ding and Cao 2019) indicating that employment density negatively impacts conventional vehicle ownership, a trend also observed for EVs.
Empirically, better workplace accessibility from home may reduce car dependence—while high employment density is often associated with high GDP and well-developed public transport. A high proportion of built areas suggests limited available space, indicating that EV users may be more inclined to reside in areas with lower building density, such as suburbs or new developments. Land-use mix has a positive effect on EV penetration rates, exhibiting significant threshold effects: a relatively flat trend between 0.025 and 0.71, followed by a sharp increase peaking around 0.73.
Public charging station (PCS) accessibility and charging distance exhibit significant nonlinear (generally positive) effects on EV penetration rates, as shown in Figures 3(e) and (f). The relationship varies across the entire range of these charging-related variables, displaying threshold effects.
For charging distance (logarithm), there’s almost no effect below 0.39, but it sharply increases and peaks around 0.4 (corresponding to 1.5 km). It then decreases to a short plateau before increasing again with peaks at 0.45 and 0.58. Between 0.61 and 1.3, the effect is relatively steady, followed by another peak at 1.4 (corresponding to 4.0 km). These peaks suggest EV users prefer charging within 4 km of home, and insufficient PCS deployment negatively impacts EV adoption. The threshold effects highlight the importance of appropriately deploying public charging stations around residential neighborhoods (within a 1.5 km living circle, based on the initial peak) to increase EV penetration rates.
Regarding the nonlinear and threshold effects of the public transport system—metro accessibility and bus stop density—the results generally showed positive impacts on EV penetration rates. Specifically, when bus stop density is below 0.000012 (stops/km²), the EV penetration rate increases dramatically, reaching the first peak at 0.000021 stops/km².
As bus stop density reaches 0.000063 stops/km², the EV resident rate increases significantly again and then remains steady between 0.000075 and 0.00025 stops/km². The rate continues to increase and then plateaus at 0.00032 stops/km².
These findings have two implications for the relationship between EV residential patterns and bus stop density. First, in areas with low bus stop density, residents likely rely on private vehicles, making EVs a preferred mode. Second, EV users tend to reside in areas with relatively high bus coverage (more than 0.00032 stops per square kilometer based on our results). Therefore, when implementing public charging stations to benefit EV residents, priority should be given to areas with little to no bus coverage or very high bus coverage.
Distance to the urban center was used to characterize urban decentralization and explore if EV adoption correlates with urban expansion. The nonlinear and threshold effects indicated that greater distance from the city positively impacts EV penetration rates.
However, the favored distance peaks around 10 km (log value 2.25 in Figure 3), aligning with the spatial distribution in Figures 2–3, which corresponds to the fourth ring road of Beijing. Beyond this peak, the impact sharply decreases and remains low until 30 km (log value 3.5), where another peak occurs. This suggests some EV users live near the sixth ring road but with significant spatial variation.
Notably, areas around the sixth ring road are at Beijing’s urban periphery, following the ring road’s single-center expansion, and are largely undeveloped with lower residential density. This observation suggests that the appeal of low-density housing may influence EV prevalence, potentially leading to a more dispersed settlement pattern.
Conclusion and Discussion
EV technology is driving a global transformation in energy and transportation. While this trend is strong and supported by favorable policies, EV penetration rates still depend on various external factors.
This research uses geospatial analysis via a machine learning Gradient Boost Decision Tree (GBDT) model to investigate the nonlinear impacts of distinct neighborhood built-environment variables on EV penetration rates in Beijing. By analyzing observed data from active EV users, the study establishes a substantiated link between EV ownership and the suburbanization of the city.
In Beijing, geospatial analysis indicates that EV users generally prefer residing in areas balancing proximity and density, with a notable concentration around a 10 km radius from the city center. The model reveals negative effects of employment density, building coverage ratio, and GDP on EV penetration rates, while accessibility to public transportation and public charging stations shows positive impacts. These findings provide valuable insights into the complex dynamics influencing EV adoption in urban environments.
This local context justifies these nonlinear correlations. The higher EV penetration rates observed outside urban centers could be attributed to the greater need for public charging near residents’ homes in Beijing. The increase in EV ownership presents challenges to the existing power system and requires infrastructure updates.
Beijing’s historic center, with its low-rise, high-density neighborhoods, narrow streets, and outdated electrical infrastructure, faces difficulties and high costs in retrofitting for EV facilities. Preserving historic landmarks and Hutong neighborhoods further complicates this. Even in newer high-rise residential areas, a shortage of dedicated parking spaces creates challenges, highlighting a significant reliance on public charging stations as most residents lack home charging access.
Regarding EVs’ impact on general urban structure transformation, while debate continues on whether they favor urban compaction or suburban expansion, our geospatial data analysis suggests a slight but clear advantage for electric mobility in suburban areas. This manifests as a reciprocal relationship: suburban residents tend to choose EVs for commuting, and existing EV users tend to select suburban homes.
The preference for EVs in suburbs can be attributed to lower operational costs, ideal for daily commutes and medium-distance travel. Additionally, fewer public transportation options in suburbs encourage personal vehicle use.
Since Beijing’s EV incentives apply citywide, location and amenities are key transport decision factors. For example, lower building density in suburbs allows for higher per capita charging facility capacity, and future infrastructure expansion prospects are more promising there.
Policy Implications
The study’s insights and identified thresholds for Public Charging Stations (PCS) and distance to urban centers have significant policy implications for future urban planning and sustainability efforts. The following recommendations are derived from the study’s findings:
Increase PCS density around residential areas. Given the current concentration of PCS in urban centers, we propose shifting the focus of PCS deployment toward large-scale residential areas. Charging patterns indicate that a 1.5 km (approximately 5-minutes driving distance) radius is a crucial threshold, witnessing the peak of charging activities. Applying this principle to future infrastructure planning could better serve both existing and potential EV users, therefore balancing PCS demand and supply.
Prioritize middle-class neighborhoods. In Beijing, PCS deployment should prioritize large residential neighborhoods around the Fifth Ring Road, especially focusing on areas approximately 10 km from urban centers. This targeted approach ensures strategic coverage in areas with higher concentrations of EV users, contributing to a sustainable and accessible charging infrastructure. Adding charging options closer to home for middle-class residents should also alleviate pressure on infrastructure development in high-density inner-city business zones.
Integrate EV considerations into urban planning: Understanding EV penetration rates and their correlation with urban environmental variables is crucial for informed decision-making. This information should guide coordinated efforts in infrastructure development, transit planning, community building, and street design. Incorporating EV benefits, such as energy and carbon reduction, into urban plans and design strategies can optimize resources and enhance the overall urban environment and lifestyle.
Plan flexibly with evolving thresholds: This study highlights the dynamic nature of EV penetration rates and charging demands. The recommended threshold ranges of 1.5 km and 10 m are based on current data but may need adjustment as EV adoption evolves. Planning strategies should remain flexible to accommodate changing infrastructure needs.
In summary, these policy implications underscore the importance of aligning urban planning with the evolving EV landscape to ensure sustainable infrastructure development and enhance overall urban quality of life.

Jing Kang
Assistant Professor, Waseda UniversityJing Kang is an assistant professor in the Waseda Institute for Advanced Study at Waseda University, Japan.

Zhongjie Lin
Benjamin Z. Lin Presidential Professor of Urban DesignZhongjie Lin is the Benjamin Z. Lin Presidential Professor of Urban Design at the Stuart Weitzman School of Design, where he heads the Urban Design concentration and directs the Future Cities Initiative.

Hui Kong
Associate Professor, Xiamen UniversityHui Kong is an associate professor in the Department of City Planning at Xiamen University, China.
Ahmadian, E., H. Byrd, B. Sodagar, S. Matthewman, C. Kenney, and G. Mills. 2019. “Energy and the Form of Cities: The Counterintuitive Impact of Disruptive Technologies.” Architectural Science Review, 62, 145-151
China Academy of Urban Planning and Design. 2023. Annual Report on Electric Vehicle Charging Infrastructure in Major Chinese Cities. Beijing. China.
Chen, J., M. Gao, S. Cheng, W. Hou, M. Song, X. Liu, and Y. Liu. 2022. “Global 1 km× 1 km Gridded Revised Real Gross Domestic Product and Electricity Consumption During 1992–2019 Based on Calibrated Nighttime Light Data.” Scientific Data, 9, 1-14
Ding, C., and X. Cao. 2019. “How Does the Built Environment at Residential and Work Locations Affect Car Ownership? An Application of Cross-Classified Multilevel Model.” Journal of Transport Geography, 75, 37-45
Fang, L., J. Huang, Z. Zhang, and V. Nitivattananon. 2020. “Data-Driven Framework for Delineating Urban Population Dynamic Patterns: Case study on Xiamen Island, China.” Sustainable Cities and Society, 62, 102365
Gong, P., et al. 2020. “Mapping Essential Urban Land Use Sategories in China (EULUC-China): Preliminary Results for 2018.” Science Bulletin, 65, 182-187
Kang, J., H. Kong, Z. Lin, and A. Dang. 2022. “Mapping the Dynamics of Electric Vehicle Charging Demand within Beijing’s Spatial Structure.” Sustainable Cities and Society, 76, 103507
LaMonaca, S., and L. Ryan. 2022. “The State of Play in Electric Vehicle Charging Services – A Review of Infrastructure Provision, Players, and Policies.” Renewable and Sustainable Energy Reviews, 154, 111733
Pan, S., W. Yu, L.M. Fulton, J. Jung, Y. Choi, and H.O. Gao. 2023. “Impacts of the Large-Scale use of Passenger Electric Vehicles on Public Health in 30 U.S. Metropolitan Areas.” Renewable and Sustainable Energy Reviews, 173, 113100
Xiao, Y., X. Chen, Q. Li, X. Yu, J. Chen, and J. Guo. 2017. “Exploring Determinants of Housing Prices in Beijing: An Enhanced Hedonic Regression with Open Access POI Data.” ISPRS International Journal of Geo-Information, 6, 358
