
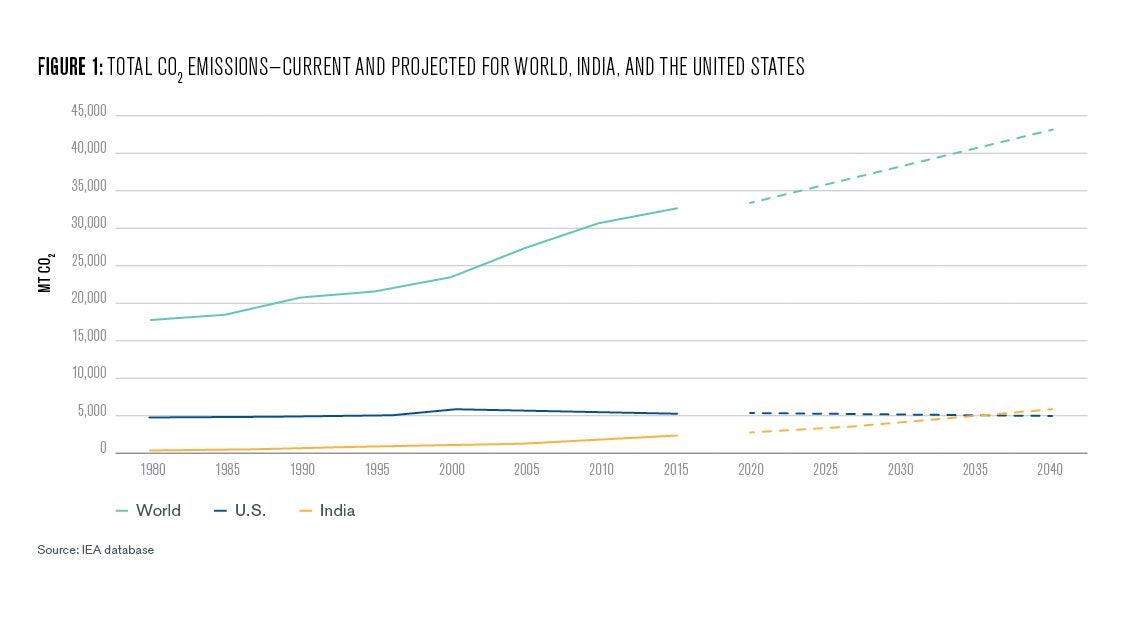
India is the third-largest emitter of carbon emissions after China and the U.S. and at its current pace is projected to overtake the U.S. by 2030.
Balancing Climate Change and Economic Development
In this world of constant change and flux, the one thing that people have markedly felt is the rising temperatures around the world. Deep-decarbonization refers to the process of reducing carbon emissions into the atmosphere to limit the global warming to below 2°C above pre-industrialized level.
India is the third largest emitter of CO2 after China and the United States, and made up around 6 to 7% of the total emissions in 2015 compared to 15% by the U.S. Given the current policies and scenarios, CO2 emissions from India are estimated to increase to 2.7 times the 2015 levels to around 5,700MT by 2040—constituting 13% of the world total. On the other hand, U.S. emissions are estimated to reduce by 7% between 2015 and 2040 to ~4700MT, lower than that of India (IEA database) 1
This puts India in the center stage for measures against global warming and towards decarbonization.
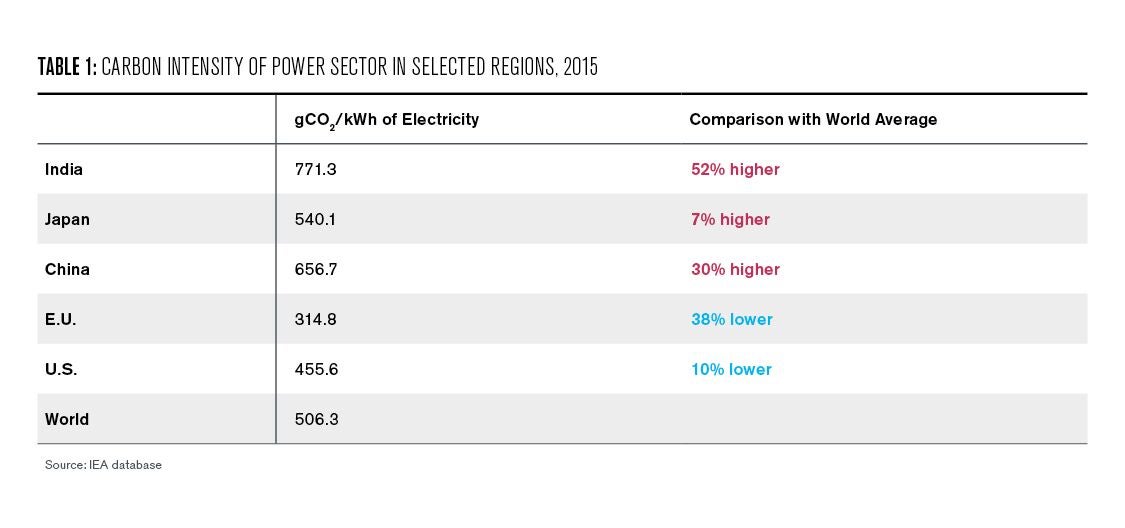
Between 2000 and 2015, CO2 emissions from India had increased by 132% compared to a global average of 40%. The emissions intensity of the power sector in India is one of the highest in the world at 770 gCO2 per kWh in 2015. It is 50% higher than the world average and over 15% higher than that of China (IEA database).
Heavy dependence on coal for power generation, use of inefficient plants to burn it, and diesel usage for captive generation2, push up the carbon intensity of India’s power sector (India Infrastructure Research 2018). With further increases in population and demand of energy anticipated over the next two to three decades, emissions from India will constitute a major portion of the rise in emissions.
Emissions from the more developed regions, like the U.S., have declined by 11% during the same time due to the expansion of natural gas and renewables in the energy mix. However, the per capita emissions of the U.S. are ten times the per capita emissions of India (United Nations 2017). The U.S. also accounts for a large share of cumulative historical greenhouse gas (GHG) emissions.

Multi-Fold Energy Demand Growth: Catalyst for Economic Development
India with its population of over 1.3 billion people, is one of the fastest growing economies of the world. Its GDP measured by purchasing power parity is currently the third largest in the world after China and the United States and has been growing at CAGR3 of 10.5% over the last fifteen years between 2000 and 2015 (World Bank 2017). The growth in GDP is accompanied by a growth in total primary energy demand (TPED) with the CAGR of 4.5%. The lower growth in energy demand compared to GDP is mainly due to growth in share of low energy intensity service sector in GDP.
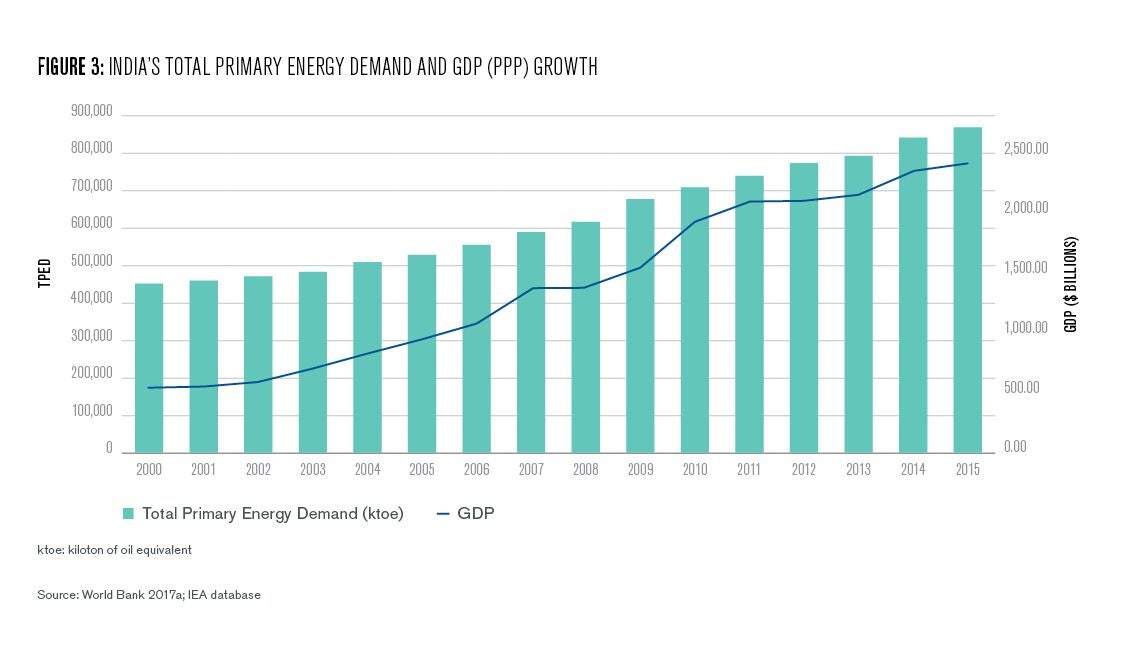
Energy demand in India is projected to continue increasing over the coming decades. The increase in Indian energy consumption is expected to account for almost a quarter of the total increase in global energy consumption over the period to 2040 (IEA database). The drivers of this sharp rise are the demographic changes with fast rising population, a growing economy, and more widespread urbanization.
Population Growth
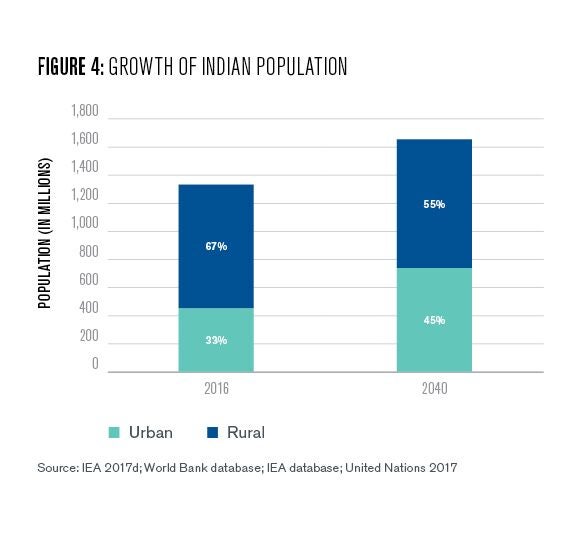
The population of India, is set to increase from approximately 1.3 billion in 2016 to 1.6 billion in 2040 (United Nations 2017). The rise in population, between 2016 and 2040, of 300 million is almost equal to the current population of the United States.
Urbanization
With the trend toward urbanization and hopes of an improved lifestyle, an increasing share of global population is living in cities and towns. For India, the urbanization rate changes from 33% in 2016 to 43% in 2040, still well below the global average (United Nations 2017). An additional 300 million people—the equivalent of a new city the size of Delhi every two years—are expected to live in India’s cities by 2040.
At 730 million, more people will be living in cities in India in 2040 than there are in the United States, Japan, and Mexico combined today (India Energy Outlook, IEA, 2015). The growth in urbanization will have the impact of accelerating the switch to modern fuels, the rise in appliance and vehicle ownership, and pushing up demand for construction materials.
Economic Growth
Just like population, India’s GDP is also set to grow significantly in the next two decades. The economy is expected to increase five times by 2040 and constitutes 7% of the total GDP of the world (measured in $ PPP). This is expected to double to over 14% by 2040 (World Bank 2017).
In addition to broader macro factors that are a determinant of growth in energy demand, factors like electricity access and clean-cooking access hold significant importance in improving lifestyle and measuring economic progress and impact energy demand.
Electricity Access
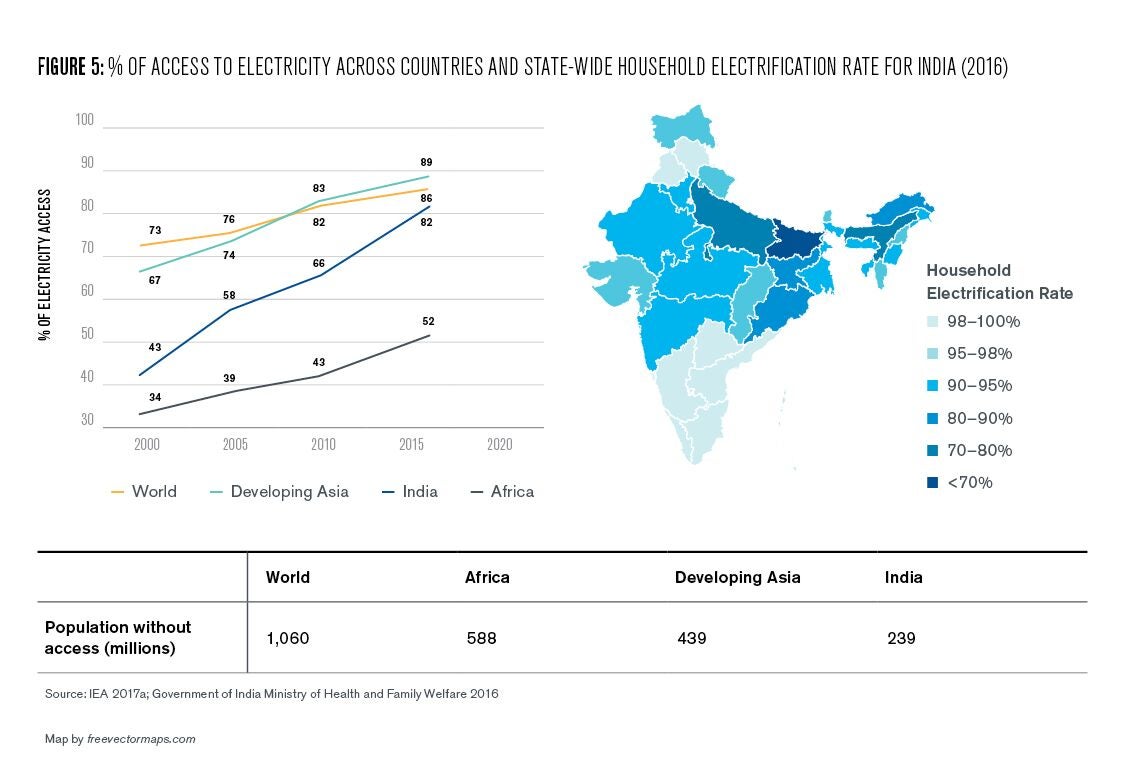
India has made great strides toward its commitments to provide access to electricity to all its citizens. Between 2000 and 2015, access to electricity has almost doubled from 43% to over 82% in India (IEA 2017a; Government of India Ministry of Health and Family Welfare 2016). All villages were declared electrified in April 2018. The government considers a village electrified if it has basic electrical infrastructure and 10% of its households and public places including schools, local administrative offices and health centres have power with a minimum of six to eight hours of electricity per day.
Oftentimes, these villages are made up of a collection of smaller hamlets, which can be several kilometres away from each other. Therefore, despite the infrastructure being built out, there are still many households within villages and even in cities that lack access to electricity. In 2016, 10% of the households still lacked electricity access. Where all states now have the necessary infrastructure, it is the last mile of electricity access that is inadequate but also the most expensive to build. Last-mile access is essential to ensure quality livelihood to the tens of millions of people still aspiring to be connected.
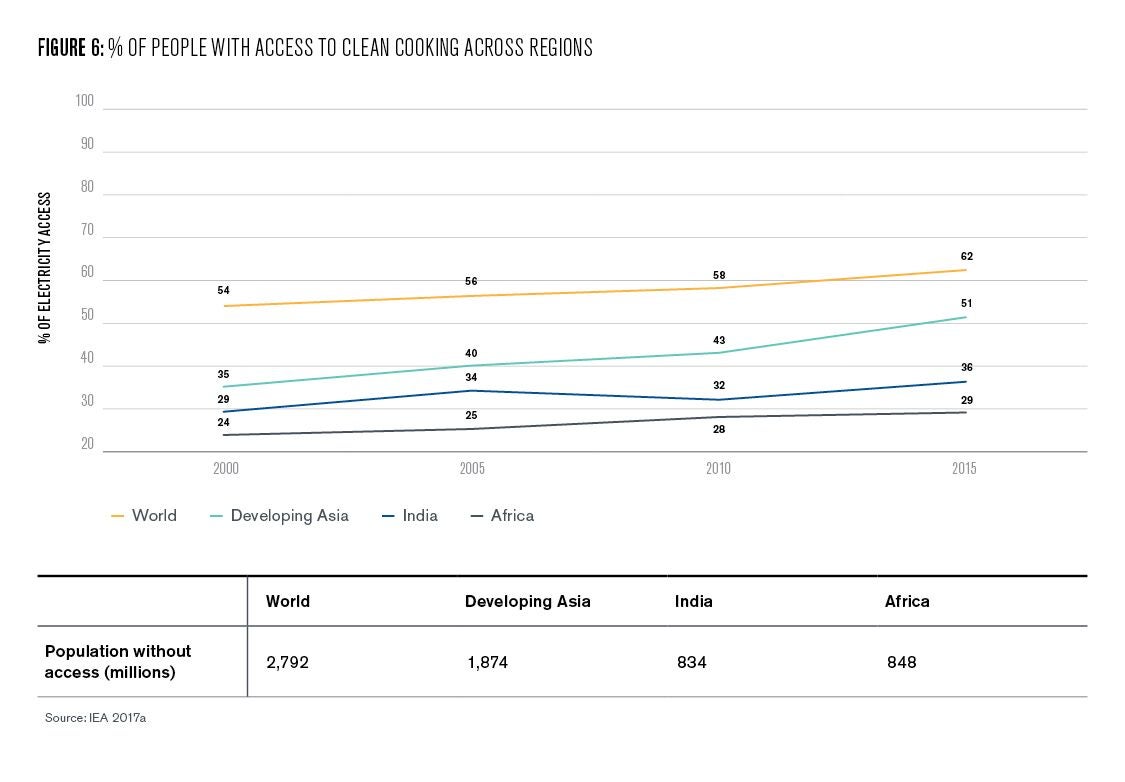
Clean Cooking Access
Globally, 2.8 billion people still rely on traditional biomass for meeting their cooking needs. This includes wood fuels, animal waste, and agricultural waste products that are used for cooking and heating in houses, mostly in developing countries where these products are available for free. Among those India is at the top, with over 0.8 billion of the population without access to clean cooking (IEA 2017a). The widespread use of traditional cookstoves poses a serious risk to the health of women and their families due to household air pollution. It causes roughly one million premature deaths in India every year (IEA 2016) and it also contributes heavily to carbon emissions due to incomplete combustion of biomass, adding to global warming and climate change.
Balancing Demand Growth and Energy Consumption Patterns for the Future
With the current government policies and commitments in place, modelled under the New Policies Scenario (NPS) by the International Energy Agency (IEA), India’s emissions will more than double the current emission levels and will eclipse those from the U.S by 2040. Energy policies in place are not enough to simultaneously meet the growing energy demand and keep emissions low. The Sustainable Development Scenario (SDS), also modelled by the IEA, highlights the 2040 targets required for achieving deep-decarbonization while meeting demand and ensuring electricity access and clean-cooking access (IEA 2017d).

Energy consumption of buildings constitutes the largest sector of energy consumption in 2015 at almost 40% of the total energy consumption share. The industrial sector is second at 35%, followed by the transport sector at 15%. By 2040, the consumption patterns for energy move drastically, signaling an evolution of new trends (IEA 2017d).
Industry
Compared to 2015, the energy consumption in industry increases by 188% under NPS 2040 and 144% under SDS 2040. Industry becomes the largest carbon emitter under SDS by 2040 with its share of total carbon emissions increasing from 26% in 2015 to almost 50% (IEA 2017d) due to the boost to industry under the government’s “Make in India” program.
- Coal dominant fuel for industrial processes results in higher emissions and the need for CCS4. Almost 60% of the total demand for coal is used in industry by 2040 under SDS against 25% in 2015. Low carbon substitutes for coal for major industrial processes like process heat and steam in industry have been very hard to find. CCS in India is still very nascent due to lack of technology, financing, carbon pricing, and a market. High upfront investments are required in risky storage site exploration. However, preliminary investments in CCS with the support of global investments and government policies are necessary to provide a well-established and functioning process for reducing carbon emissions by 2040.
- Energy efficiency measures focused on energy intensive industries, material efficiency, recycling. “Perform, Achieve and Trade” scheme, now including 11 energy-intensive sectors5, is targeted to bring efficiency standards in these industries close to global best practice levels by 2040. This was necessary as currently, the steel industry in India has average efficiency levels much lower than global standards and it is projected to account for almost 20% of industrial energy demand by 2040 (IEA 2015). Material efficiency measures such as increasing recycling, reducing the weight of consumer products, increasing fabrication yields and using energy-intensive materials more intensely along with modernization of India’s recycling industry (currently amongst lowest recycling rates) will enable huge energy savings.
Transport
Carbon emissions from the transport sector triple between 2015 and 2040 under NPS and double under SDS. The energy consumption on the other hand increases by 268% under NPS 2040 and 165% under SDS 2040 (IEA 2017d).
- Electrification of the transport sector and movement away from oil. Over 95% of the total consumption in the transport sector is met using oil in the form of diesel and gasoline primarily for road. The share of oil in total transport consumption reduces to 84% in NPS 2040 and 67% in SDS by 2040. The share of electricity is targeted to increase to 16% under SDS 2040 from almost 0% right now against 5% in NPS 2040. The government has declared its intent to move to full electrification of vehicle sales by 2030 along with faster rail electrification. Financial incentives for EVs, rapid recharge infrastructure buildout, and decarbonization of the power sector are essential to reduce resultant emissions.
- Vehicle fuel-efficiency standards and build-out of effective public mass transport infrastructure. Stringent fuel-efficiency standards for vehicles are essential to limit emissions. Bharat Stage IV air pollutant emission norms have been in force across India since April 2017 despite legal challenges. These are equivalent to EURO norms that are accepted globally for vehicular emissions. A jump to Stage VI norms has been announced by 2020 moving towards stricter and cleaner vehicular emissions, skipping Stage V. However, no progress made under HDVs (heavy duty vehicles) that account for a higher share of energy usage and carbon emissions than passenger vehicles in India. Efficient, reliable public transport infrastructure is required to minimize travel emissions and also reduce air pollution, especially in cities.
Buildings
The building sector is currently the largest energy consumption sector in India. Compared to 2015, the energy consumption in buildings increases by 40% under NPS 2040 and stays almost the same under SDS 2040 (IEA 2017d).
- Urbanization, electricity access, and clean-cooking access drive fuel change from biomass to electricity in buildings. Under SDS, traditional bioenergy moves from 65% (IEA 2017d) to approximately 11% of the energy mix by 2040. The share of electricity increases from 14% currently to 55% under SDS 2040. Per person consumption of electricity in urban India was almost three times that of rural India (25.8 kWh in urban vs 8.9 kWh in rural) in 2011 (National Sample Survey 2011). Urbanization of almost 300 million people along with increased clean cooking access and 100% electricity access will drive this change due to higher ownership of cooling appliances, refrigeration, televisions, and computers. The average share of household energy used for the above appliances increases from approximately 20% in 2013 to 45% in NPS 2040.
- Energy efficiency standards for appliances and building standards essential under SDS. The rise will be lower under SDS due to efficient energy consumption and building standards reducing the cooling requirements. For example, cooling appliances accounted for 10% of average household energy use in 2013. This will increase to 27% under NPS by 2040 (IEA 2015). Without efficiency standards, just the cooling needs of India will increase 15-fold by 2050 (IEA 2018c). Energy Efficiency Services Limited (EESL) that pioneered the successful LED bulb replacement program, where over 750 million incandescent lamps were replaced with LED bulbs, is now focusing on ceiling fans and agricultural pumps. If programs and standards are implemented with the same precision as the LED program, it would be a critical step toward meeting the SDS targets.
Key Challenges in Current Scenario
Decarbonization of the power sector along with increased electrification of energy demand hold the key to achieving deep-decarbonization for India. Currently 75% of the electricity generated is from coal and only 15% from renewables. As per SDS, the power system will need to transform to one with over 60% renewables, half of which would be solar PV by 2040. Under SDS, the share of electricity in meeting final energy consumption increases from 15% in 2015 to over 26% in 2040 with higher electricity access, electrification in the transport sector by way of electric vehicles, electric rail, and in buildings and agriculture with a higher share of appliance ownership, cooling requirements, solar pumps, etc. However, there are several challenges that need to be dealt with to achieve the desired targets and goals under SDS. Some of the key challenges are:
- Unaffordable and unreliable electric supply. India is among the most expensive countries for electricity when electricity prices are adjusted by purchasing power parity6 (IEA database). Especially for industries, since higher rates are charged for industrial use to recover the cost of subsidies provided to agricultural and residential users. In addition, the power supply is extremely intermittent (only 8-10 hours of power supply in a day in most parts of the country), even in industrial areas, so most industries resort to diesel-fired captive generation to ensure 24/7 power supply.
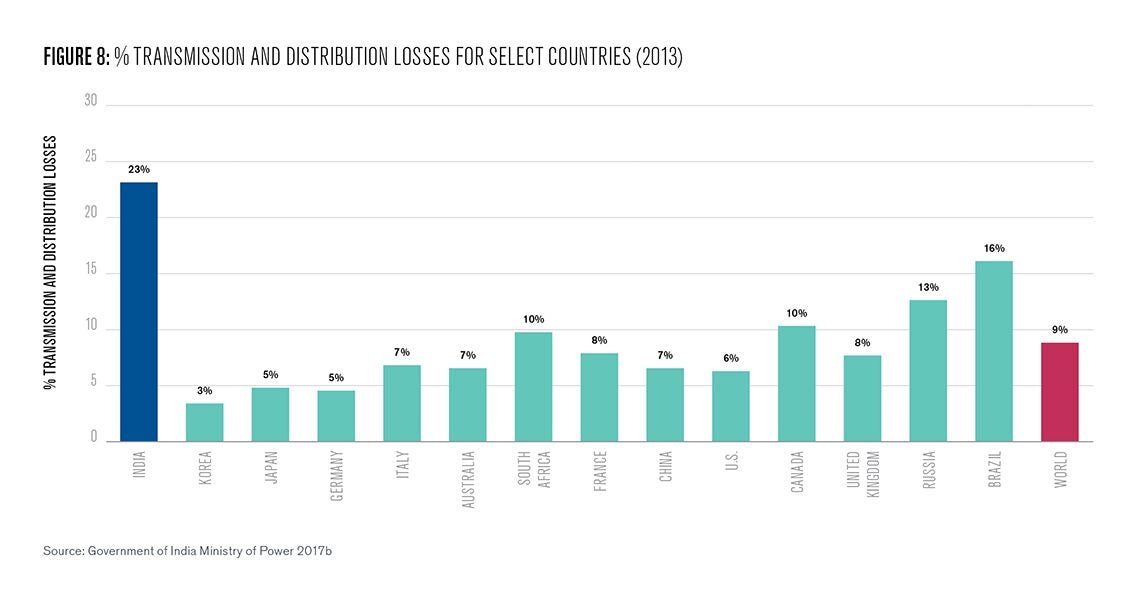
- Inefficient operations, illegal thefts, leading to financial crisis for DISCOMs. Structural weakness, high technical and non-technical losses (theft by attaching illegal wires to electricity nodes from the grid) in the distribution network (23% against world average of 8.9%) (Growth of electricity sector in India from 1947-2017, Government of India, 2018), and high levels of non-payment for electricity means that distribution company revenue often fails to cover costs. This poor financial condition combined with the rigid power purchase agreements (PPAs) at high rates with inefficient coal power plants further restricts DISCOM companies. DISCOMs are often unable to move toward purchasing from cheaper renewable power plants and meeting their renewable purchase obligations and are unable to make new investments—such as balancing gas plants—for fear of insufficient compensation.
- Technology upgrades and technology transfer agreements. Vast leaps on the technology front are expected and required to meet the SDS targets. CCS would be needed in the industry sector in order to capture 1700 Mt of annual energy and process-related CO2 emissions from industry by 2040 (compared with 1300 Mt in SDS that takes into account CCS) (IEA 2017d). R&D and investments in bioenergy and utilizing the agricultural waste and vast municipal waste in urban areas for energy production would be beneficial in not only reducing carbon emissions but also in decreasing landfill waste and pollution. Latest efficient technology in electric vehicles would help reduce oil dependence and move towards electrification.
- Extensive investment expansion needs necessitate simplifying long approval and administrative processes. India requires a cumulative $4,800 billion for energy investment between 2015 and 2040 under SDS. That’s almost double the Indian GDP. $2,000 billion in low-carbon technologies (renewables, nuclear, electric cars, CCS), $1,300 billion in energy efficiency and $900 billion in transmission and distribution (IEA 2017d). Currently 90% of external financing in this field is through corporate loans that are short-term and have high interest rates. Innovative low-cost financing is required in this field. In addition, India will need to simplify legal regulations and administrative processes in order to attract foreign investment along with the much-needed technology transfers.
- Sub-optimal subsidy structure and center-state policy misalignment. In 2015, ~45% of the energy subsidies in India were allocated to fossil fuels (coal, oil and gas) (IISD 2017). By making the concerned energy sources artificially cheaper, energy subsidies have intended and unintended impacts on the health of Indians, their energy access, consumption patterns, and emissions. In addition to that, several national ministries and other state bodies oversee different aspects of energy, complicating the task of formulating and implementing a unified strategy. For example, the Energy Conservation Building Code (ECBC) has not been made mandatory yet since buildings are governed by the state government and the ECBC has been formulated by the central government (Smita Chandiwala, Sumedha Malaviya, 2017).
Other challenges include the need for higher private participation in energy sector. 80% of India’s coal output and 65% of upstream oil sector is state-owned with inefficient infrastructure and low productivity. With an anticipated increase in the share of gas from 5% to 17% in power generation to provide the required flexibility, vastly unexplored resources like coalbed methane and shale gas need to be expanded. However, they are currently are a risky proposal. Inadequate infrastructure such as road quality, aging power plants, land and water constraints, and difficulty in getting public acceptance are a few more challenges to be overcome through strong policy support, better public awareness, and timely execution.
While the challenges for India are immense, they are not insurmountable. Through a streamlined target driven roadmap, dedicated policies, decarbonization of electricity and electrification of more end uses, India can well be on its path to deep-decarbonization.

Khushboo Goel
The Wharton SchoolKhushboo Goel is an M.B.A. graduate of the Wharton School at the University of Pennsylvania and the 2018 Kleinman Birol Fellow at the International Energy Agency.
Abhishek Jain, Sudatta Ray, Karthik Ganesan, Michaël Aklin, Chao-Yo Cheng, and Johannes Urpelainen (2015), Access to Clean Cooking Energy and Electricity- Survey of States, CEEW report, Retrieved from http://www.indiaenvironmentportal.org.in/files/file/CEEW-ACCESS-Report.pdf
Census of India (2011), Population Census 2011, Retrieved from https://www.census2011.co.in/
Center for Climate and Energy Solutions (2016), State Climate Policy Maps, Retrieved from https://www.c2es.org/content/state-climate-policy/
Climate Policy Initiative (2015), Reaching India’s Renewable Energy Targets: The Role of Institutional Investors, Retrieved from https://climatepolicyinitiative.org/wp-content/uploads/2016/11/Reaching-…
Economic Times (2018), Coal vs Renewables Finance Analysis’ by the Delhi-based Centre for Financial Accountability (CFA), Retrieved from https://economictimes.indiatimes.com/industry/indl-goods/svs/metals-mini…
Financial Express (2018), Modi Government Cuts Nuclear Power Capacity Addition Target to One-Third, Retrieved from https://www.financialexpress.com/economy/modi-government-cuts-nuclear-po…
Government of India Central Statistical Office (2018), Energy Statistics, Retrieved from http://mospi.nic.in/sites/default/files/publication_reports/Energy_Stati…
Government of India Ministry of Health and Family Welfare (2016), National Family Health Survey – 4, Retrieved from http://rchiips.org/nfhs/pdf/NFHS4/India.pdf
Government of India Ministry of Power (2017a), Implementation of PAT Scheme , Retrieved from https://beeindia.gov.in/sites/default/files/MD_PPT_Vadodara_7_July_2017.pdf
Government of India Ministry of Power (2017b), Growth of Electricity Sector In India from 1947-2017, Retrieved from http://www.cea.nic.in/reports/others/planning/pdm/growth_2017.pdf
Government of India Planning Commission (2018), Statewise Data as on 01-03-2018, Retrieved from http://www.esopb.gov.in/Static/PDF/GSDP/Statewise-Data/StateWiseData.pdf
IEA (2015), India Energy Outlook, OECD/IEA, Paris
IEA (2016), Energy and Air Pollution: World Energy Outlook Special Report 2016, OECD/IEA, Paris
IEA (2017a), Energy Access Outlook, OECD/IEA, Paris
IEA (2017b), Energy Technology Perspectives 2017, OECD/IEA, Paris
IEA (2017c), Renewables Report, OECD/IEA, Paris
IEA (2017d), World Energy Outlook, OECD/IEA, Paris
IEA (2018b), Global EV Outlook 2018, OECD/IEA, Paris
IEA (2018c), The Future of Cooling, OECD/IEA, Paris
IISD (2017), India’s Energy Transition: Mapping Subsidies to Fossil
Fuels and Clean Energy in India GSI Report, Retrieved from https://www.iisd.org/sites/default/files/publications/india-energy-trans…
India Infrastructure Research (2018), Captive Power in India, Retrieved from http://www.indiainfrastructure.com/reportpdf/report-captive-Power-in-ind…
Indian Express (2017), At 2.5 Million, India Tops List of Pollution-Linked Deaths: Study, Retrieved from, https://indianexpress.com/article/india/at-2-5-million-india-tops-list-o…
NASA GISS (2018), Long-Term Warming Trend Continued in 2017, Retrieved from https://www.giss.nasa.gov/research/news/20180118/
National Institute of Solar Energy (2015), State Wise Estimated Solar Power Potential in The Country, Retrieved from https://mnre.gov.in/file-manager/UserFiles/Statewise-Solar-Potential-NIS…
National Sample Survey (2011), Per Capita Consumption of Electricity Lowest in Bihar, Highest in Delhi, Retrieved from http://www.bihartimes.in/Newsbihar/2014/July/newsbihar15July6.html
Power Finance Corporation (2016), Report on The Performance of State Power Utilities for the Years 2013-14 to 2015-16
Sasmita Patnaik, Saurabh Tripathi (2017), Access to Clean Cooking Energy in India-State of the Sector, CEEW report
Smita Chandiwala, Sumedha Malaviya (2017), Make Green Building Code Mandatory, Retrieved from http://indiaclimatedialogue.net/2017/08/31/make-green-building-code-mand…
World Bank (2017a), GDP (current US$), World Bank National Accounts Data and OECD National Accounts Data, Retrieved from https://data.worldbank.org/indicator/NY.GDP.MKTP.CD
World Bank (2017b), GDP PPP (current international $), World Bank International Program Database, Retrieved from https://data.worldbank.org/indicator/NY.GDP.MKTP.PP.CD?end=2016&start=20…
World Bank (2018), Doing Business 2018, Retrieved from http://www.doingbusiness.org/~/media/WBG/DoingBusiness/Documents/Annual-…
United Nations DESA/Population Division (2017), World Population Prospects 2017, Retrieved from https://esa.un.org/unpd/wpp/Download/Standard/Population/
- International Energy Agency, Organization of Economic Cooperation and Development [↩]
- Captive generation plants are primarily owned by industry for self-consumption. As per the Captive Power in India 2018 report, captive generation capacity accounts for 25% of the overall installed power generation capacity in India. [↩]
- CAGR- Compound Annual Growth rate [↩]
- CCS, or Carbon Capture and Storage, is a technology that captures carbon emissions from fossil fuel power generation and industrial processes and then stores it preventing it from entering the atmosphere [↩]
- aluminium, cement, chlor-alkali, fertilizer, iron and steel, pulp and paper, textiles, thermal power plant, railways, DISCOMs, petroleum refineries [↩]
- Comparing electricity prices for select countries in USD (adjusted for PPP)/ MWh [↩]
