Renewable Auctions and Labor Considerations in Brazil

Awarding electricity generation procurement contracts through auctions has become increasingly popular over the past decade. In Brazil, the introduction of auctions marked changes in electricity worker wages during the same time period.
A recent trend in electricity generation procurement, especially for renewable energy, is to award contracts through auctions. By 2015, at least 60 countries had implemented some form of a renewable energy auction, an increase by a factor of 10 over the previous decade (IRENA and CEM 2015).
By using these auctions, the pool of firms that are selected to provide electricity are those that can commit to providing it at the lowest cost. Since many of these auctions have only begun in the past decade, there has been little empirical analysis investigating their success. Further, it is not clear what the definition of a successful auction would include.
To build popularity, the auctions are often promoted as lowering the electricity price1, with the implication that this will lead to lower electricity prices for consumers. However, a lower procurement price will have other consequences on the electricity industry, for instance on the labor force. This brief provides an analysis of the electricity production labor sector in Brazil by comparing the wage distributions in 2006 and in 2013. The first auctions took place in late 2005, and there was a lag before new construction began. By 2013 there were several years of completed auctions.
Brazil’s Energy Auctions
Brazil has an immense capacity for water storage, which has naturally led to the country being very dependent on hydroelectricity. In 2001 this dependence, in conjunction with a drought and a lack of investment in electricity generation and transmission in the 1990’s, combined to create an electricity shortage (Tolmasquim 2012). The electricity crisis forced the government to decree electricity rationing in several regions. Following this setback, the government decided to restructure the power system, and a key part of the new structure was to use auctions to award long-term electricity contracts to generators.
Since then, in order for an electricity generating firm to acquire a procurement contract, the firm must compete in an electricity auction. These auctions award contracts that are usually 15 to 20 years in length. The long length of the contract, combined with the guaranteed purchase of electricity, reduces the risk to investors. To win a contract, firms must commit to offering a specified amount of electricity at a low enough price.
Auctions are often used in procurement situations such as this, with the thought that the most efficient firms will offer the lowest prices, and therefore the most efficient firms will be procuring the goods in the end. However, there may be other reasons that a firm can offer a low price—one possibility is that they are paying their workers a lower wage than competitors.
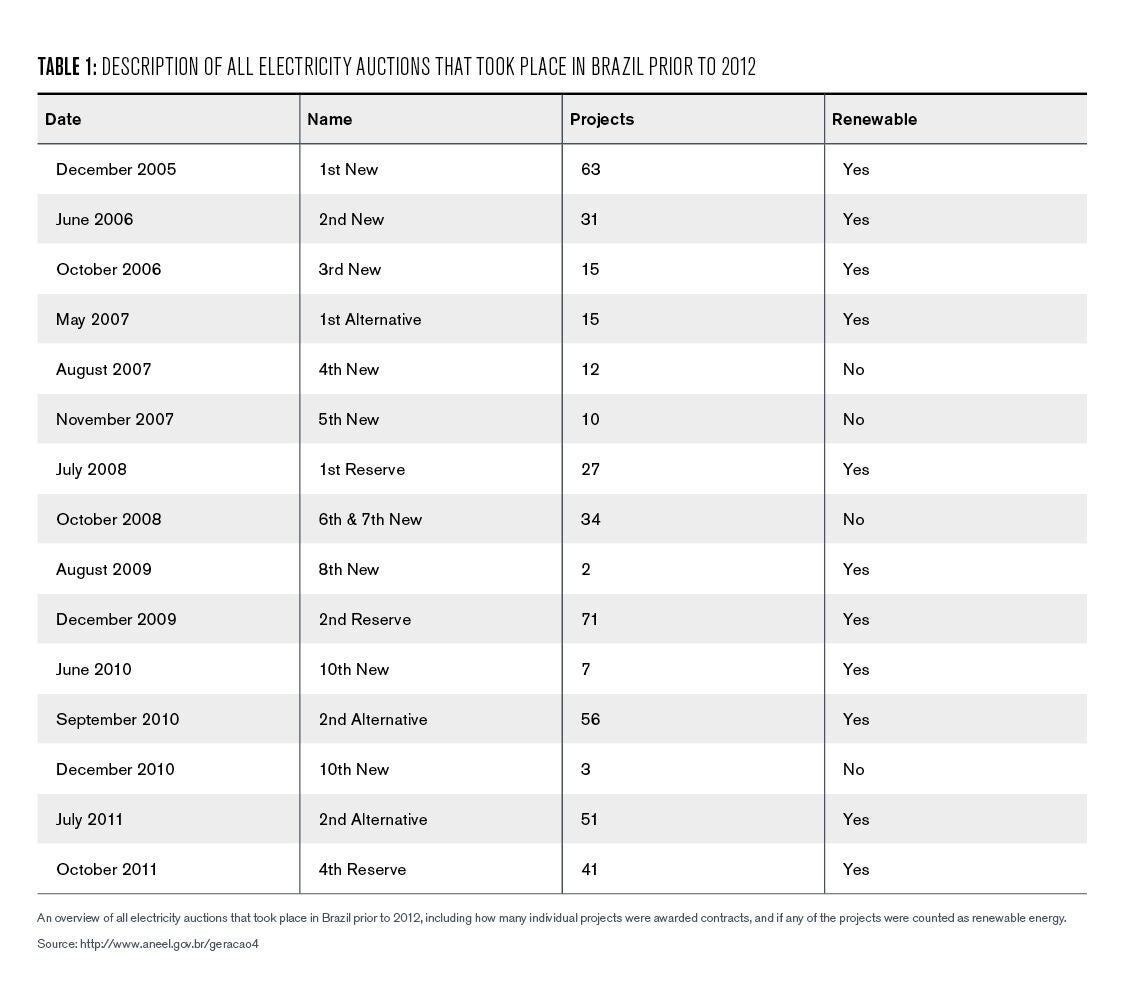

Brazil’s first auction was held at the end of 2005. Figure 1 shows a timeline of all of the auctions held up until 2012. There are three different types of electricity auctions: New Energy, Reserve Energy, and Alternative Energy. The main difference between the three is what type of energy is eligible to bid in the auction. The column titled “Projects” refers to how many projects were awarded contracts, and the column titled “Renewable” indicates if the auction awarded at least one contract to a renewable energy source.
Unfortunately, in the past few years2, there has been more inconsistency in the auction process. Several auctions have been cancelled or postponed, and some firms have failed to meet their contracted obligations. This has mainly been attributed to the economic and political turmoil in Brazil. The currency depreciated and the interest rates rose in 2015, inflating costs for developers. At the same time, power consumption fell, leading to a market over supply. These problems were exasperated by firms aggressively bidding in auctions and, at times, underbidding (BNEF).
These recent failures make understanding the power sector that is created by the auctions even more crucial. Perhaps it is not the structure of the auction which is causing the recent turbulence. Perhaps it is the fact that firms who are selected in the auctions cannot survive and thrive in the current economic and political setting in Brazil.
Brazilian Formal Sector Labor Data
To answer questions regarding electricity sector worker’s wages, data from the Relação Anual de Informações Sociais (RAIS) is used. RAIS is a matched employer-employee dataset which is compiled using data collected by the Brazilian Ministry of Labor. While the dataset does not capture workers in the informal sector, it is estimated to contain over 97% of all workers in the formal sector. Through this dataset, it is possible to identify workers who were employed in the electricity production sector and, further, it is possible to track which firms employed them.
The electricity sector is divided into five classifications, one of which is production. While the results of the auctions affect all aspects of the electricity sector, it is the firms who are producing the electricity who are bidding for contracts. Therefore, this analysis focuses on the wages of employees classified under electricity production.
To simplify interpretation, the wage data in this study is described in terms of minimum wages. The federal government of Brazil sets a monthly minimum wage that applies to all workers. Since 2003 the minimum wage has been adjusted annually in order to keep up with inflation. In addition to the federal minimum wage regulations, different regions may set their own minimum wages, usually for specific professions. Employees can then negotiate their salaries with their employers.
Wage Data: Any Change After the Auctions?
To understand the impact of the auctions on the electricity production labor market, it is informative to examine the wage distribution, in minimum wages, first in 2006 and then in 2013. In 2006, it is reasonable to assume that there was no effect of the auctions on the electricity labor market, since the first auction took place in late 2005, and there was a lag before construction began. By 2013, auctions were well-established and the government had been awarding procurement contracts for over seven years. Figure 2 shows the distribution of wages for the electricity production sector in 2006 and 2013. 3
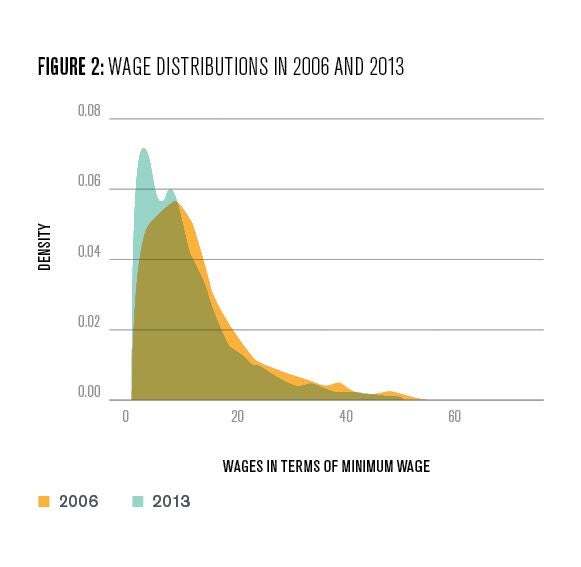
By looking at the two densities in Figure 2, it is apparent that wages (in terms of the minimum wage) have shifted to the left in the seven years between 2006 and 2013. As mentioned above, the minimum wage did increase over this time period, however the increase is intended to keep up with inflation. Alvarez et al. (2018) examine a similar time period in Brazil, looking at the difference between 2004 to 2008 and 2008 to 2012.
In levels, the mean wages found in the electricity production sector are higher than those in the entire population and in large manufacturing and mining firms. However, the decrease in wages between 2006 and 2013 in the electricity production sector is larger than the decreases found by Alvarez et al. Further, Alvarez et al. find that the variance of the earnings4 is decreasing as time goes on, and that is not the case in the electricity production sector. So relative to the rest of the labor force, the electricity production sector has higher wages on average, but faced a larger decrease in average wages and less reduction in inequality5between the years 2006 and 2013.
To quantify this change in mean wages, in 2006 the mean wage was 14.1 times the minimum wage, whereas in 2013 the mean wage was 11.8 times the minimum wage. While this is a significant decrease, I do not make the assumption that this shift, or the lack of a decrease in inequality, should be entirely attributed to the auctions. Many events occurred in Brazil between 2006 and 2013 and it would be ignorant to disregard all outside factors, and place all of the credit on the auctions. That being said, changing the structure of the industry is bound to have effects on the downstream markets. It is reasonable to believe that the auctions, and the lower procurement prices, had some influence in this shift.
What Types of Firms are Hiring?
In order to establish a stronger connection between the shift in the wages of the workers, and the auctions being implemented, it is crucial to understand what was happening to the firms. The firms must win the auctions in order to supply energy, and then they hire the workers in the production sector. They are the link between the auctions and the labor sector.
Workers may be hired at different wages because of their own observable characteristics, such as age, experience, education, and gender, among others. However, two workers with the same observable characteristics can also get different wages depending on what firm hires them. Consider the case of two firms, Firm A and Firm B, who employee two identical workers. In this example, Firm A pays their version of this worker $10 more than Firm B is paying theirs. This $10 is what I am going to call Firm A’s fixed effect. In a sense, Firm A is simply a better place to work at for an employee, since it offers a better wage than Firm B, for a given employee. Firm A could be offering this higher wage because of regional differences in supply and demand. Or perhaps Firm B is facing pressure since they are selling their energy at a very low price compared to other firms and need to cut input costs. In a world with no frictions, workers at Firm B would simply move to another higher paying firm, however, if for instance there was a lack of similar positions in the area, then a worker may get stuck at Firm B, at least for a short period of time.
John Abowd, Francis Kramarz, and David Margolis specified a model (AKM model) in their 1999 paper, which calculates the firm fixed effects using panel data similar to that which I am using here. I estimate their model and calculate the firm fixed effects, to see if there is a change in the distribution of these firm fixed effects before and after the auctions were implemented. I estimate the model twice, first using data from 2006 to 2009, and then using data from 2010 to 20136. Between the two periods, the number of employees in the electricity production sector grows by almost 18%. However, the fraction of employees that switch firms during the specified four-year periods increases from 9.6% of the workforce between 2006 and 2009 to 25.3% of the workforce between 2010 and 2013.
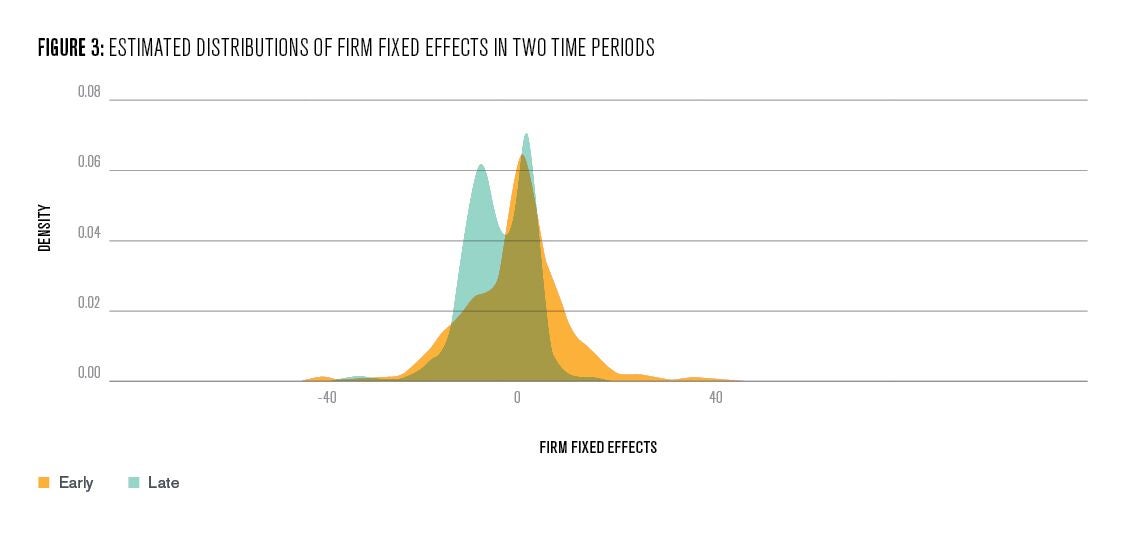
Figure 3 shows the estimated distribution of the firm effects7for the two time periods. Firm effects are identified for 661 firms in the early time period and 1105 firms in the later time period. The two distributions are estimated separately, so while they each control for time variation within the time period, they are not controlling for general changes between the two time periods. The main difference is that in the years 2006 and 2009 the distribution has one peak, whereas in the later years, between 2010 and 2013, the distribution has now become bimodal. It appears as if in the later years there are two “types” of firms, and one has significantly lower estimated firm fixed effects than the other. The effect of this change in distribution, is that the mean estimated fixed effect from the early years is 3 minimum wages higher than the mean estimated fixed effect in the later years.
Once again, the above observations are not causal evidence that the auctions are leading to firms offering lower wages. However, there is a significant change in firm behavior between the time period when auctions were first being introduced, and when they were more established. While the focus so far has been on the impact of the auctions on firms, it is also possible that the auction is not causing firms to decrease wages, but that it is merely selecting firms that were already low-cost compared to others, and allowing them to grow.
Conclusion
It is realistic to assume that one of the contributing factors for the wages of the electricity production sector workers decreasing is that firms had lower fixed effects in later years. Since auctions were implemented during this time period, they may have been instrumental to this. To establish a causal relationship, as well as quantify the magnitude of the relationship, further data work is required.
Introducing auctions to the energy procurement process in Brazil, and in other countries, is a large structural change. This change has many benefits, such as transparency and competition. A benefit that is often publicized is the lower prices for electricity that are achieved by these auctions. The goal of this brief was to look at another implication of these auctions and the lower prices: the electricity production sector wages.
The wages of those in the electricity production sector decreased on average after the auctions were introduced. While this brief does not offer causal evidence that the auctions caused this decrease, it is still reason to be concerned. Further, the scope of this project was only the electricity production sector. There are many other downstream sectors which would be affected, either directly or indirectly by the lower procurement prices, which should all be taken into account. As the auctions progress, and more data becomes available, both in Brazil and other countries, it will be important to complete rigorous empirical analysis of all of the outcomes, including those in the labor sector. The result could be that it is potentially in Brazil’s, and other country’s, interest to include more selection criteria in their auctions, in order to better maximize the welfare of not only consumers, but also electricity workers.

Gabrielle Vasey
Doctoral StudentGabrielle Vasey is a Ph.D. Candidate in the Department of Economics at The University of Pennsylvania.
Abowd, J. M., Kramarz, F., & Margolis, D. N. (1999). High wage workers and high wage firms. Econometrica, 67(2), 251-333.
Alvarez, J., Benguria, F., Engbom, N., & Moser, C. (2018). Firms and the decline in earnings inequality in Brazil. American Economic Journal: Macroeconomics, 10(1), 149-89.
Bloomberg New Energy Finance (BNEF) Analysis.
Engbom, N., & Moser, C. (2017). Earnings inequality and the minimum wage: Evidence from Brazil.
IRENA (2013). Renewable Energy Auctions in Developing Countries.
IRENA and CEM (2015). Renewable Energy Auctions – A Guide to Design.
Saltiel, F., & Urzúa, S. (2017). The Effect of the Minimum Wage on Employment in Brazil.
Tolmasquim, M. T. (2012). Power sector reform in Brazil. Synergia.
- Note that in reality auctions do not always lower prices. In Brazil, renewable energy auction prices decreased until 2013 but have remained mainly constant (with some slight increases) since then. The recent increases in price have been attributed to stricter local content rules, a shortage of turbine supply and rising BNDES interest rates (Bloomberg 2015). [↩]
- Problems began occurring in 2015 and 2016. These years are not included in the analysis because the last year of available data is 2013. [↩]
- The top 1% of wages were dropped in order to better see the important component of the graph. [↩]
- The logarithm of earnings was used in the analysis. [↩]
- Inequality is measured by the variance of the wage distribution. A large variance indicates a large spread in wages, which is interpreted as having a lot of inequality. [↩]
- For identification purposes, it is necessary to have multiple years and workers switching firms. This is why instead of simply using 2006 and 2013, I use four years of data for each estimation. Between 2006-2009, there are 1168 firms, and the median firm has 2 employees leave or join during this period (mean is 8.7). Between 2010-2013, there are 1630 firms, and the median firm has 4 employees leave or join during this period (mean is 19.4). [↩]
- Standard errors are not presented in this figure. [↩]
