Follow the Carbon: The Case for Neighborhood-Level Carbon Footprints

Typically, we measure emissions that occur within a geographic boundary. But consumption-based accounting tells a different story: that affluent communities depend heavily on polluting activity that occurs elsewhere.
Introduction
The latest report of the Intergovernmental Panel on Climate Change is clear: we need aggressive action in the next eleven years to slash carbon emissions to avoid catastrophic climate change. It is a daunting task.
Since then, a second story has made global headlines: the yellow-vest protests in France, where largely lower-income and rural residents have revolted over a planned increase in the price of diesel, an element of the country’s climate plans (Fourquet and Manternach 2018). There is no separating low-carbon policies from demography or place.
Research needs to focus on the intersections of climate, inequalities, and the built environment. The neighborhood-level household carbon footprints that we propose model the average household’s carbon footprint for each neighborhood in the United States at unprecedented geospatial resolution (below, we define how we statistically construct neighborhoods); we will layer on a range of environmental vulnerabilities, including projected climate harms.
This will allow us to examine the interplay of greenhouse gas emissions, inequality, and the built environment, producing data essential for informing fair, democratic, and rapid decarbonization. This policy brief makes the case for such research and presents some early results of our ongoing project, “Whole Community Climate Mapping,” itself part of our broader Socio-Spatial Climate Collaborative, or (SC)2.1
Neighborhood-Level Household Carbon Footprints
Prevailing representations of cause and effect in climate change are a matter of social science, not atmospheric science. There is no single, perfect way of representing causal linkages around greenhouse gas emissions, just as no single economic indicator can suffice to represent the economy.
Yes: in direct terms, fossil fuel companies and many large agricultural land-holders directly emit greenhouse gases through their operations. But it is also true that energy and food production exist to meet the demands of other firms, and ultimately consumers. Consumption-based accounting is a necessary—albeit insufficient—piece of the puzzle.
Here, we make the case that neighborhood-level household carbon footprints merit greater research and public attention. We believe this kind of research can make three distinct contributions: a) more faithfully representing how economic activity shapes the climate; b) combining spatialized household carbon footprint and climate vulnerability data—cause and effect—in a single framework; c) and, informing concrete public policies, especially fine-tuned climate investment.
Note that none of these refers to individual consumer choice. It is impossible to imagine reducing energy demand—direct and indirect—in rich countries if affluent consumers refuse any changes to their lifestyle and consumption habits (Méjean et al. 2019; Van Vuuren et al. 2018). The great upshot of a systematic carbon footprint analysis is to understand how consumption practices are socially and spatially structured. We aim to inform policy actions to reduce emissions in a way that is commensurate with greater equality, and with individuals living well.
Consumption accounting’s strengths are the method’s attention to energy demand (direct and indirect), locational specificities, and issues of equity. Its weakness is that unlike production accounting, it sheds little insight on decarbonizing the making of energy and things. Since full decarbonization will require both reducing overall energy demand (direct and embedded in goods and services) in most places and decarbonizing the production of goods and services that we do continue to consume, one ultimately needs to combine both consumption and production accounting, and the policies associated with each. Since the latter—production—gets disproportionate attention, our research and this policy brief focus on consumption. (Another concern is localized pollution—eg, a coal plant in a particular exurb. We will soon produce map layers showing data on local exposure to pollutants, and will analyze the relationship between carbon footprints and various forms of localized environmental harm.)
The Faithful Representation of Reality
The normal way of attributing carbon emissions to a population or a place is the territorial carbon footprint (Yetano Roche et al. 2013). The method is pick a jurisdictional boundary—national, regional, urban—and count up all the emissions that occur within it.
But there is a problem: this method of emissions attribution conceptualizes the global economy as a series of adjacent “snow-globes,” thus failing to consider the ways that affluence in particular places depends on polluting activity that occurs elsewhere. In fact, the economy functions as a vast, interconnected web of nodes and flows (Wachsmuth, Cohen, and Angelo 2016).
Consumption-based carbon accounting uses complex modeling to capture this node-flow relationship. Its first step is to model the lifecycle emissions of all economic activity—that is, all emissions associated with the production, transportation, and consumption of a particular good or service. For instance, many emissions are released in the production of a standard computer, including the mining of the minerals, transportation of them, the manufacturing process, the transportation of the finished product to the point of retail. Once one models these, one can attribute to the consumer (or to a population of consumers) all the emissions entailed by the computer’s production.
For example, in standard urban territorial accounting, when a person plugs a personal laptop into an outlet in Philadelphia, then Philadelphia is responsible for the carbon emitted to charge that laptop. And China is responsible for most of the emissions entailed by the production of the laptop. With urban consumption accounting, all the emissions required to produce, transport, and chargethe laptop are assigned to Philadelphia. Meanwhile, any goods and services produced in Philadelphia but consumed elsewhere would be attributed to those places, and not to Philadelphia. In household carbon footprinting, all emissions are ultimately assigned to households.
Only a few cities have conducted rigorous consumption-based carbon emissions audits. Reflecting the fact that most of these are prosperous, post-industrial cities, the exercises found that a consumption tally increases their carbon responsibility by two to four times over territorial counts (Small World Consulting Ltd 2011; Stanton 2011; British Standards Institution 2014; Stockholm Environment Institute – U.S. 2012). Another study by the C40 Cities group, looking at the organization’s 79 member cities, finds that on average cities’ consumption emissions are 50% higher than their territorial emissions; this sample, however, includes several manufacturing centers (C40 2018). The highest levels of per capita, consumption-based emissions, unsurprisingly, are found in Europe, followed by North America, followed by Oceania.
Disproportionately high consumption emissions (relative to territorial) are found in wealthy (and usually politically liberal) post-industrial cities, whose affluence—and attendant consumption—depend to an extraordinary extent on polluting activity that occurs in distant cities, suburbs and rural areas (C40 2018; Ummel 2014, 2016; Heinonen, Kyrö, and Junnila 2011; Rice et al. 2019; Stanton, Bueno, and Munitz 2011; Stockholm Environment Institute – U.S. 2012; British Standards Institution 2014).
Consumption-based carbon accounting undermines the widespread claims that raw urban residential density is intrinsically good for the climate (cf Owen 2009; Barber 2017), a misleading accounting identity that makes affluent liberal city-dwellers look low-carbon by default (Rice et al. 2019). But even consumption counts of cities as a whole are too rough an approximation, blotting out important social and spatial differences within cities.
For instance, early zip code-level consumption accounting by Kevin Ummel found that households in a residentially dense neighborhood in New York’s midtown had three times the carbon footprint of households in a neighborhood of the same density in the Bronx (Ummel 2014; Cohen 2016; see also Chancel and Piketty 2015).
We are now conducting analysis at a finer spatial grain than the zip code level. To create statistically meaningful neighborhoods, we intelligently aggregate American Community Survey data at the census block level to create “neighborhoods.” These are agglomerations of several census blocks that together have enough survey responses to ensure data quality, and that share basic characteristics like income level and education. Although imperfect, these are more meaningful aggregations than census tracts or zip codes, which are data artifacts rather than representations of substantively coherent places.
Consumption accounting at this neighborhood level, which measures the consumption behavior of a neighborhood’s residents, provides a more fine-grained understanding of how economic activity causes climate change than either territorial accounting, or consumption accounting at low levels of spatial resolution. Consumption accounting conducted with the best possible statistical precision—including tracing statistical error throughout the modelling, using the broadest range of datasets—should help us understand the intersections of demographic factors and the built environment in causing carbon emissions. For instance, Where specifically are the homes that are small and yet use a lot of energy (and thus emit carbon) because occupants cannot afford retrofits?
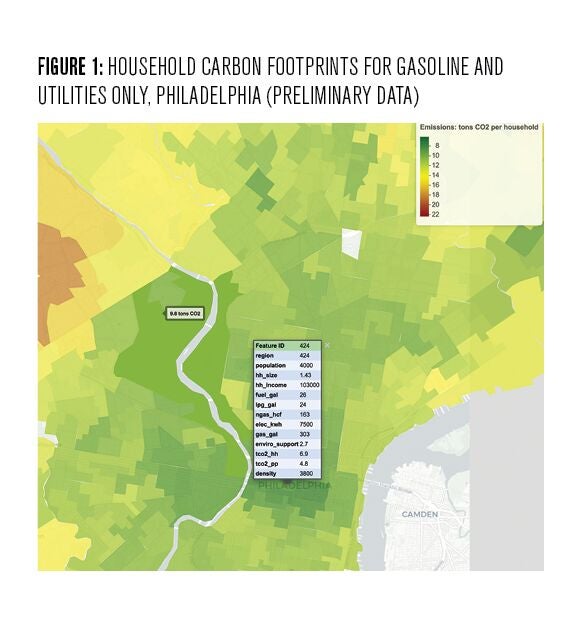
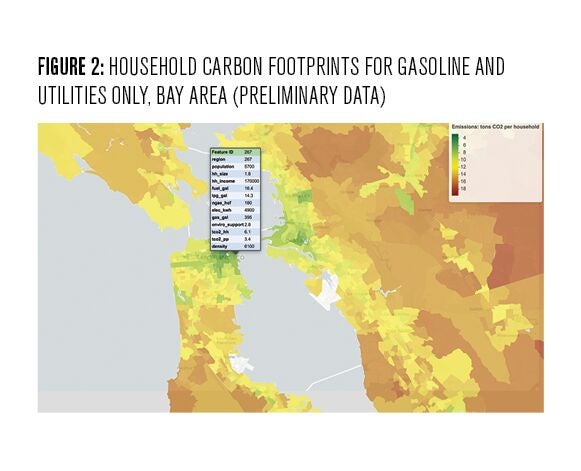
Figures 1 and 2 illustrate the geo-spatial resolution of preliminary research into household gasoline and utility emissions in Philadelphia and the Bay Area, with a sample readout of some neighborhood characteristics found in our model, like income, household size, and neighborhood population size. (Note: this measure of direct emissions does not include emissions from consumption of goods and services, air travel, or food. These preliminary maps thus have data similar to territorial counts, albeit at far higher spatial resolution).
Telling a Consistent, Holistic Story
Neighborhood-level household carbon footprints have another important upshot. By combining sophisticated accounts of inequality, place, and carbon with mappable data, it becomes possible to combine in one visual analytic the two halves of the climate story: cause and effect.
Normally, these two stories are separate. The causal analysis of carbon emissions can be a) highly individualized (in the case of personal carbon footprints); b) superficially tied to political jurisdictions (via territorial footprints); or c) linked to the energy and agricultural sectors, normally the most rigorous method. In each case, the causes are wholly separate from any analysis of vulnerability to climate harms. Cause and effect are in separate analytic silos; normally only effect is spatialized.
After all, climate impacts can easily be placed on a map. For instance, FEMA flood maps demarcate flood risk down to the city block level. The analysis of climate (and other environmental) inequalities is likewise often rendered in geographical terms. Models of temperature change and sea level rise, or data on where there is tree cover, are easily spatialized. From there it is straightforward to explore the unequal social and spatial exposures to environmental harm. The result of all this is a disjuncture in climate narratives and analysis between cause and effect.2
With neighborhood-level household carbon footprints, it is also possible to map carbon footprints and to decompose their drivers—like neighborhood walkability, home size, vehicle type, amount of consumption of particular goods and foods. We can then explore how these relate to social inequalities—eg, do only the affluent tend to live in highly walkable neighborhoods? (The urban literature on gentrification suggests that this is happening.) And we can analyze intersections between social and demographic factors, emissions drivers, and exposure to environmental harms from present pollution to projected flood risk. In this way, cause and effect can be combined into a single, visual tool that we will build: an interactive map aimed at policy-makers and the public.
Concrete Applicability in Policy
Of the many potential policy applications of this research, three stand out immediately: a) carbon tax policy; b) urban climate policies; and, c) targeted, justice-oriented investment policies.
Carbon Pricing and Fuel Taxes. The most straightforward use of carbon footprint analysis is to use it to estimate the impacts of a carbon price. Carbon pricing can take many forms. A simple and widely supported version is to tax carbon at the point of production; most of the cost increases associated with the tax would be passed on down through the supply chain to shape the price of goods at the point of consumption.
In order to avoid leakage of carbon-intensive productive activity to other countries, one can levy a carbon fee on goods imported from places that do not have their own carbon taxes (or have lower carbon taxes), based on estimated emissions required to produce that good. To understand how a carbon tax would affect different consumers in different regions, one can impute from a carbon footprint analysis of households at the neighborhood level what their exposure to a carbon tax would be; by decomposing the footprint into its constituent parts, one can disaggregate the impacts of increased gas prices, utility costs, food costs, good costs, et cetera (see Ummel 2016). With this knowledge, one can then design compensatory measures (such as a dividend, funded by carbon tax revenues) to ensure that lower-income consumers are compensated, or even better, come out ahead. Because of the inherent uncertainty in projecting which costs are passed on, there is a strong case for prioritizing equity and over-correcting through generous compensation payments to low-income households.
Targeted, Justice-Oriented Investments. In the U.S., there is increasing interest in using revenues from carbon pricing (or simply, from general revenues) to specifically target climate investments to disadvantaged communities. These would both accelerate decarbonization and improve ruggedization against already-inevitable climate impacts. For instance, California is targeting climate investment to low-income and racialized communities thanks to legislation passed in 2012, leading to the creation of local jobs, increased energy security, and decreased vulnerability to climate hazards (Aguilar 2018). Proposals to emulate this kind of targeted, justice-oriented investment were defeated by a modest margin in Washington State in a ballot measure in November 2018. In New York State, a climate policy being finalized in June 2019 will invest 35% of clean energy revenues in disadvantaged communities.3 The federal Green New Deal resolution proposed by Congressperson Alexandria Ocasio-Cortez also calls for targeted investments of this type.
But how will policymakers decide where to invest? So far, there is no standard criteria. And different programs should be targeted precisely to where they’re most needed. At present, data on health inequalities is largely available at the county level. Important data on energy insecurity—namely, households’ inability to pay utility bills—is only publicly available at the regional level. And there is no consolidated mapping that connects carbon footprints to vulnerability. Our “Whole Community Climate Mapping” tools, which will include data on exposure to environmental harms, will give policymakers a simple tool to assess investment needs based on a wide range of factors, all at the neighborhood level. This could massively increase the efficiency of public investment.
Much of the political momentum in climate policy is now at the city level. However, cities rarely have good data on how their consumption-based emissions are distributed across the population—if they even know the total local emissions—which is information that would ideally inform local policy design (C40 2018). A few cities have hired consultants to estimate information on this front, but that is the exception rather than the rule.
Our data would provide a nationwide, free, standardized database for understanding local drivers of direct and indirect energy demand, and comparing consumption-based emissions between communities. (We know that showing people how they compare to neighbors motivates behavioral change, and this would likely be true if cities and communities could also compare with high accuracy.)
We can also estimate emissions (or any other quantity measured in surveys) across population subgroup. For example, we can estimate impacts specifically on minority or single mother households (i.e. vulnerable population groups) as they intersect with specific places at any scale—neighborhood, city, congressional district, county, state, and so on. While place-based policymaking is increasingly important, we can also help target people with certain characteristics with considerable resolution.
Early Findings
Core Takeaways from Early Research
Our “Whole Community Climate Mapping” project will be much more statistically intensive than earlier, place-based, consumption carbon footprint analysis. And our spatial resolution will be higher than earlier work, which goes to the zip code level.
Ummel’s (2014) first carbon footprint analysis showed that no single factor shapes carbon footprints more than income: wealthier households consume more; they are responsible for more emissions. An upshot of this analysis is the finding that urban density’s carbon impacts are intensely moderated by income. Carbon taxes would hit the wealthiest hardest. But it is also reasonable to assume that any kinds of taxes that curb wealth at the top, like “millionaire taxes” or “mansion taxes” of the kind proposed by New York mayor Bill De Blasio would have positive climate benefits, especially if the revenues are invested—again, as proposed by De Blasio—in shared public goods, like pre-school or public transit. More research of the kind that we are pursuing now is needed to confirm, further specify, and better understand this rather rough finding of income’s relationship to emissions. For example, just how much, and in what circumstances, do different kinds of residential density shape consumption? While income explains more than any other factor, it does not explain everything. Overall, Ummel’s earlier research finds that income alone explains roughly just 50% of the variation in households’ carbon footprints.
Density and Emissions
It is widely believed that urban density reduces carbon emissions by virtue of piling more people into more energy-efficient buildings (often efficient by default—party walls mean that warmed and cooled air is shared between units), and nearer jobs and services, yields less energy use and car travel per resident. How strong is this effect? What level of density is it reasonable to target?
It is clear, as already indicated, from Ummel’s research, that despite the marginal benefit of density on emissions, wealth still countermands much of the density effect because the wealthy consume many goods and services, even if they live in apartments and walk to work. Compared to their suburban counterparts, wealthy households appear to spend utility and gasoline savings on other carbon-rich goods (see also Heinonen, Kyrö, and Junnila 2011).
To be clear, the argument is not that density causes wealth and consumption. Rather, it is that territorial emissions accounting fails to capture many of the emissions caused by affluent residents of dense areas. In contrast, the kind of consumption accounting that we are developing should help clarify what is really going on, and to develop finer-tuned policies (including fairer taxation and spending).
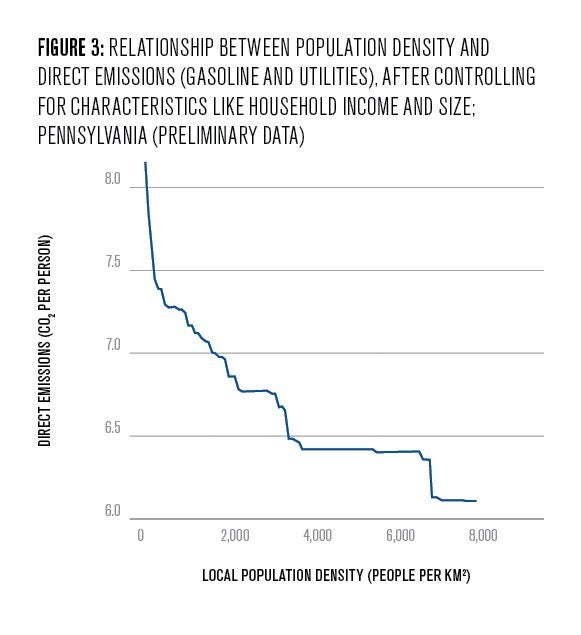
What about simple, direct emissions—car and utility use? Here too, more careful analysis tells a complex story. We examined the relationship between density and emissions. What we find is that a shift from rural and sprawl-levels of density to conventional urban levels is associated with a huge reduction in emissions from car travel and utilities. This is consistent with the classic literature on density and carbon emissions (cf Calthorpe 2011; Jones and Kammen 2014).
However, the emissions savings from moving from a moderate urban level to the very highest densities (of the sort associated with central Manhattan, or a few parts of central Philadelphia) are very modest—especially since we know that the highest levels of density are associated with levels of wealth that yield high overall footprints. See figure 4.
This suggests that the debate about urban density, which always seeks more density in even the most built-up urban areas, as if density and reduced direct emissions had a linear relationship, is wrong-headed. The New Yorker writer David Owen, for instance, has popularized the view that “sustainability, if it can be achieved, will look a lot more like midtown Manhattan than like rural Vermont” (Owen 2009″ 58). But the biggest emissions reduction potential occurs well before midtown Manhattan density levels; Manhattan is a poor representation of what a low-carbon American city should aspire to.
Even net of the massive consumption emissions of affluent midtown Manhattan residents, the benefit in terms of direct emissions from that level of density are minor. Our data suggest that it would make far more sense to pursue the so-called “missing middle” of moderate urban density, which is far closer than Manhattan to the ideals that most Americans already seem to have, and which reflects levels that already exist in neighborhoods like Greenpoint or Crown Heights in New York, or much of South and West Philly in Philadelphia. Protecting those neighborhoods that do have medium density from gentrification, and increasing density in areas that are less dense, would reduce emissions and provide fair, broad access to low-carbon, energy-efficient urban living. That implies a regional focus on both affordable housing and densification, rather than endless battles over zoning already dense, central areas. That focus on regionalism and equity is compatible with a broader economic shift away from material production and towards public services, human connection, and leisure—the social and economic vision that urbanist and environmental thinkers have long proposed.
As we improve and expand our data, we expect to offer a series of more precise, contextually specific stylized findings to help develop better-supported policy priorities.
Conclusion
Climate policy advocates tend to pride themselves on their fidelity to data. After all, the entire basis of climate politics is climate science. But the natural science of climate change offers only limited guidance to policymakers: reduce greenhouse gas emissions. The social science of carbon emissions is thin when it comes to understanding the intersections of social inequalities and the built environment. Compared to the enormous statistical efforts underway to support economic analysis, or even the significant efforts developed by public health researchers, the social science of greenhouse gas emissions drivers is in its infancy.
In the project outlined in this policy brief, we demonstrate the utility of a consumption-based approach that, by tracing emissions to the neighborhood level, can profoundly improve our understanding of the relationships between carbon emissions, inequality, and the built environment—three of the core concerns of policymakers.
There are significant policy upshots here. Perhaps the most important contribution of the project will be democratizing information on climate change and place in the United States. The creation of interactive maps linking cause and effect—footprints and vulnerability—will allow policymakers and members of the public to develop data-rich stories about our relationship to climate change. This will enrich public debate, increasing the chances that we make good decisions that will keep communities safe for decades to come.

Daniel Cohen
Assistant Professor of SociologyDaniel Aldana Cohen is an assistant professor of sociology at the School of Social Policy & Practice and directs the Socio-Spatial Climate Collaborative (SC)2.

Kevin Ummel
Research Affiliate, Population Studies CenterKevin Ummel is a research affiliate at the Population Studies Center at the University of Pennsylvania. He is also president of Greenspace Analytics.
Aguilar, Orson. 2018. “How Money from Polluters Helps Californians.” San Francisco Chronicle, February 13, 2018. https://www.sfchronicle.com/opinion/openforum/article/How-money-from-pol….
Barber, Benjamin. 2017. Cool Cities: Urban Sovereignty and the Fix for Global Warming. New Haven: Yale University Press.
British Standards Institution. 2014. “Application of PAS 2070 – London , United Kingdom. An Assessment of Greenhouse Gas Emissions of a City.” London: BSI Standards Limited.
C40. 2018. “Consumption-Based GHG Emissions of C40 Cities,” no. March: 17. https://c40-production-images.s3.amazonaws.com/researches/images/68_C40_….
Calthorpe, Peter. 2011. Urbanism in the Age of Climate Change. Washington, DC: Island Press.
Chancel, Lucas, and Thomas Piketty. 2015. “Carbon and Inequality: From Kyoto to Paris. Trends in the Global Inequality of Carbon Emissions (1998-2013) & Prospects for an Equitable Adaptation Fund.” Paris. http://piketty.pse.ens.fr/files/ChancelPiketty2015.pdf.
Cohen, Daniel Aldana. 2016. “Petro Gotham, People’s Gotham.” In Nonstop Metropolis: A New York City Atlas, edited by Rebecca Solnit and Joshua Jelly-Shapiro, 47–54. Berkeley: University of California Press.
Fourquet, Jérôme, and Sylvain Manternach. 2018. “Les ‘Gilets Jaunes’: Révélateur Fluorescent Des Fractures Françaises.” Paris.
Heinonen, Jukka, Riikka Kyrö, and Seppo Junnila. 2011. “Dense Downtown Living More Carbon Intense Due to Higher Consumption: A Case Study of Helsinki.” Environmental Research Letters 6 (3): 034034. https://doi.org/10.1088/1748-9326/6/3/034034.
Jones, Christopher, and Daniel M. Kammen. 2014. “Spatial Distribution of U.S. Household Carbon Footprints Reveals Suburbanization Undermines Greenhouse Gas Benefits of Urban Population Density.” Environmental Science and Technology 48 (2): 895–902. https://doi.org/10.1021/es4034364.
Méjean, Aurélie, Céline Guivarch, Julien Lefèvre, and Meriem Hamdi-Cherif. 2019. “The Transition in Energy Demand Sectors to Limit Global Warming to 1.5 °C.” Energy Efficiency 12 (2): 441–62. https://doi.org/10.1007/s12053-018-9682-0.
Owen, David. 2009. Green Metropolis: Why Living Smaller, Living Closer, and Driving Less Are the Keys to Sustainability. New York: Riverhead. http://www.amazon.com/Green-Metropolis-Smaller-Driving-Sustainability/dp….
Rice, Jennifer L., Daniel Aldana Cohen, Joshua Long, and Jason R. Jurjevich. 2019. “Contradictions of the Climate-Friendly City: New Perspectives on Eco-Gentrification and Housing Justice.” International Journal of Urban and Regional Research, March. https://doi.org/10.1111/1468-2427.12740.
Small World Consulting Ltd. 2011. “The Total Carbon Footprint of Greater Manchester: Estimates of Greenhouse Gas Emissions from Consumption by Greater Manchester Residents and Industries.” Vol. 510272.
Stanton, Elizabeth A. 2011. “Consumption-Based Emissions Inventory For San Francisco Consumption-Based Emissions Inventory For San Francisco,” no. May.
Stanton, Elizabeth A, R Bueno, and C Munitz. 2011. “Consumption-Based Emissions Inventory For San Francisco Consumption-Based Emissions Inventory For San Francisco.” Somerville, MA: Stockholm Environment Institute-U.S. Center.
Stockholm Environment Institute – U.S. 2012. “Greenhouse Gas Emissions in King County: An Updated Geographic-plus Inventory, a Consumption-Based Inventory, and an Ongoing Tracking Framework.” Seattle.
Ummel, Kevin. 2014. “Who Pollutes? A Household-Level Database of America’s Greenhouse Gas Footprint.” CGD Working Paper 381. Working Paper 381. Washington, DC: Center for Global Development.
———. 2016. “Impact of CCL’s Proposed Carbon Fee and Dividend Policy: A High-Resolution Analysis of the Financial Effect on U.S. Households.” v1.4.
Vuuren, Detlef P. Van, Elke Stehfest, David E.H.J. Gernaat, Maarten Van Den Berg, David L. Bijl, Harmen Sytze De Boer, Vassilis Daioglou, et al. 2018. “Alternative Pathways to the 1.5 °c Target Reduce the Need for Negative Emission Technologies.” Nature Climate Change 8 (5): 391–97. https://doi.org/10.1038/s41558-018-0119-8.
Wachsmuth, David, Daniel Aldana Cohen, and Hillary Angelo. 2016. “Expand the Frontiers of Urban Sustainability.” Nature 536 (7618): 391–93. https://doi.org/doi:10.1038/536391a.
Yetano Roche, María, Stefan Lechtenböhmer, Manfred Fischedick, Marie-Christine Gröne, Chun Xia, and Carmen Dienst. 2013. “Concepts and Methodologies for Measuring the Sustainability of Cities.” Annual Review of Environment and Resources 39 (1): 519–47. https://doi.org/10.1146/annurev-environ-012913-101223.
- http://web.sas.upenn.edu/sociospatialclimate/ [↩]
- An exception is Berkeley’s Cool Climate map. This tool is an inspiration for our work. However, by going beyond the zip code to neighborhood level footprints, and by integrating richer data into our back end, we expect to produce a much richer and more interactive tool. See: https://coolclimate.berkeley.edu/maps. [↩]
- https://www.eenews.net/stories/1060616261 [↩]
