Energy Production and the Potential for Electric Motorcycles in Solo and Central Java, Indonesia
Introduction
A number of cities, particularly in Southeast Asia, have adopted the motorcycle as the primary means of urban transportation. Relatively high but flatly distributed population and job densities, narrow streets, and a uniformly distributed road network make the motorcycle a convenient choice for point-to-point travel in many cities. Low-cost Chinese motorcycles, credit, and inexpensive fuel make it an affordable choice as well. While motorcycling is perceived as a high-risk activity in the US and Europe, low speeds and great numbers of motorcyclists and bicyclists in motorcycle cities combine to produce fairly low collision-related fatality rates, when compared to cities of similar size and wealth that rely more on private cars and informal transit.
Motorcycles also use space efficiently due to their size and maneuverability. Narrow arterial roads often carry as many people per lane in motorcycle cities as American superhighways. Even in highly congested conditions, streets filled with motorcycles tend to maintain vehicle flow instead of experiencing the bumper-to-bumper halt common on streets filled with cars and buses.
Despite these advantages, a heavy reliance on motorcycles has several disadvantages. Most notably, inexpensive motorcycles operating on adulterated gasoline produce high levels of concentrated local pollution. This pollution reduces life expectancy and causes harmful respiratory diseases—particularly for the young and elderly. Shifting from gas-powered motorcycles to electric motorcycles could help improve air quality and reduce the harmful impacts associated with motorcycles (Cherry, Weinert, and Xinmiao 2009). However, for electric motorcycles to be a viable replacement, consumers would need to be willing to purchase them, and the energy grid would require increased capacity to support the demand. This policy report is a companion to a consumer choice experiment conducted in Solo, Indonesia in the summer of 2015. The choice experiment, which presented five choices to 1,300 respondents, evaluates the extent to which electric motorcycles are a potential replacement for gasoline-powered motorcycles in Solo, Indonesia, as a function of price and electric motorcycle range, speed, and charge times.
This report examines the extent to which the current and forecast energy production could handle the increased electricity demand, based on several scenarios about adoption rates, motorcycle use, and energy consumption. We find that the substantial penetration of high performance electric motorcycles would require significant increases in local energy production. An overnight 100% percent shift to high powered electric motorcycles would require 63% of current energy consumption to maintain average daily travel of 30km per motorcycle. This suggests that electric motorcycles need to be part of a larger set of policies to target local and global emissions from the transportation sector.
The remainder of this document describes recent trends and current conditions in Solo, summarizes current and forecast energy demand and production in the region, matches forecast capacity to three scenarios of future demand for electric motorcycles, and concludes with a brief discussion of the limits of electric motorcycles as a strategy for reducing pollution in Solo.
Solo, City of Motorcycles
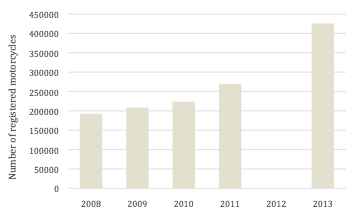
Solo (also known as Surakarta) is home to 500,000 to 600,000 inhabitants and is at the center of a metropolitan area of 3 million in the populous province of Central Java. A long-time walking and biking city, Solo has rapidly transformed into a city dominated by motorcycles and motorcyclists with nearly one motorcycle per man, woman, and child. Between 2009 and 2013, the motorcycle fleet more than doubled from 208,000 to 424,000 (Figure 1). Motorcycles dominate traffic and account for around two-thirds of the peak-hour, peak-direction trips on major arterials. In surveys for the choice experiment, 81% of 1,288 respondents indicated that the motorcycle was their primary mode of transportation.
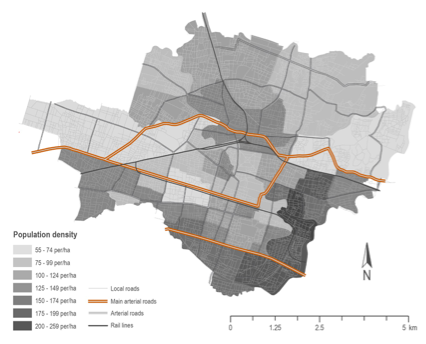
Motorcycles have several notable advantages. As in other Indonesian cities, rising incomes, inexpensive motorcycles, easy credit, and low (and until 2015 subsidized) fuel prices have helped to encourage this rapid increase in motorcycle ownership. A liter of gasoline, which currently costs around fifty cents (6,700 rupiah) supports 30 to 40 kilometers of travel on an average motorcycle, enough for a day’s travel. The motorcycles themselves require a $40 (500,000 rupiah) down-payment, and $40 monthly payments for three years. Solo’s urban form also makes it particularly well suited to motorcycle travel. Fairly uniform population densities, dispersed employment centers, and a gridded road network of two-to-four-lane, two-way arterial roads connected to narrow residential side streets create a flat distribution of traffic patterns well-suited to private forms of transportation (Figure 2). High densities keep trip distances short, while narrow rights of way and limited parking make the size and maneuverability of motorcycles particularly attractive. In terms of safety, Solo had an average annual traffic fatality rate of 6.1 per 100,000 residents between 2008 and 20121. That is half of Pennsylvania’s traffic fatality rate, roughly equivalent to Philadelphia’s traffic fatality rate, and well below most national rates in the developing world (Pennsylvania Department of Transportation 2015; World Health Organization 2014).
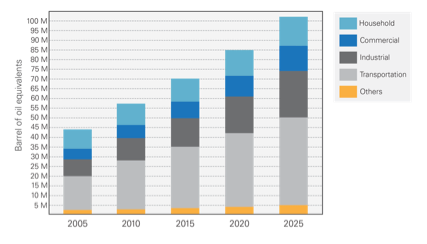
However, the dependence on motorcycles presents several substantial challenges. Motorcycles, particularly low-quality ones, generate high levels of local pollution. A 2008 study cited in Nijenhuis (2012) found that Solo was regularly out of compliance with international air quality standards, particularly for nitrogen oxides, hydrocarbons, volatile organize compounds, and ozone. Motorcycles also consume substantial amounts of fossil fuels. In Central Java, the transportation sector consumes and is predicted to continue to consume roughly 40% of all energy (Figure 3). As part of a broader national energy policy to move away from fossil fuels, the Ministry of Energy and Mineral Resources and Energy Conservation has set a 2025 target to reduce the share of oil-based transportation energy by 20% (Ministry of Energy and Mineral Resources and Energy Conservation 2012). On the first day of 2015, the newly elected President Joko Widodo ended longstanding public fuel subsidies.
Finally, motorcycles tend to degrade public space and make bicycling and walking more difficult. Switching more of the local motorcycle fleet to electric vehicles would help reduce local emissions and potentially help reduce dependence on fossil fuels, but would not prevent the physical degradation of public space due to motorcycles.
Energy Consumption and Production in Solo and Central Java
To better understand the potential effects of a switch to electric motorcycles on energy production and consumption, this section summarizes Solo and Central Java’s current energy production, national policies, and initiatives to expand the region’s energy production and distribution capacity. Indonesia’s past 20 years of economic and population growth have challenged the national energy sector and contributed to power outages and low electrification rates (The World Bank 2010). The World Bank assessment goes on to report that insufficient infrastructure investment, subsidized tariffs, and an uncertain regulatory environment have prevented the country from producing enough energy. The government, in partnership with private energy producers, has responded to these challenges by increasing energy production substantially. Despite a 25 percent increase in production over the past ten years, however, Indonesia continues to have low electrification rates relative to peer countries. The U.S. Energy Information Administration (2014) lists inadequate infrastructure, difficulty obtaining land-use permits, subsidized tariffs, and an uncertain regulatory environment as the main impediments to increased electricity production.
Regional energy production faces similar challenges, with energy supply currently too low to meet Central Java’s growing demand, despite importing electricity from other regions (Universitas Muhammadiyah Yogyakarta & Departemen energi dan Sumber Daya Mineral (Provinsi Jawa Tengah) 2009). In Solo, local employees of the government-owned national energy distribution company indicated that distribution capacity may be a more substantial problem than production capacity2. Power blackouts primarily occur during the rainy season due to damage caused by storms and floods and many small enterprises and even households use fuel-powered generators to offset uncertainties in electricity supply.
Unfortunately, we are unable to match reliable production forecasts to local or even regional geographies. Instead, we rely on local energy consumption estimates and match these to regional forecasts to estimate average energy consumption and production in Solo and Central Java. In 2013, Solonese residents consumed approximately 1,600 MWh per day (Badan Pusat Statistik Kota Surakarta 2014). This represents an average annual increase of approximately 8.5% since 2010. Our 2020 estimate extrapolates from this trend, and closely mirrors official regional estimates (Perusahaan Listrik Negara 2012), which predict that the demand for energy in Java and Bali will grow at an average annual rate of 7.6% from 144 terawatt hours in 2013 to 275 terawatt hours in 2022. Normalizing by population, the average Solonese resident consumed about as much electricity—1 MWh per year—as one of the 145 million residents of Java and Bali in 2013.
Matching Supply to Electric Motorcycle Adoption Scenarios
Despite the potential benefits of reducing local pollution and the reliance on fossil fuels, the shift from fuel-powered to electric-powered motorcycles may challenge Solo and Indonesia’s energy grid. To estimate the potential scale of this challenge, we develop nine electric-motorcycle scenarios and compare their energy needs to the total estimates of energy consumption in 2020. The scenarios vary in terms of the energy consumption per kilometer of electric motorcycle travel, the number of motorcycles on the road, and the share of motorcycles that are electric. While an overnight shift from gas-powered to equivalent-performance electric motorcycles would put tremendous pressure on the energy grid, electric motorcycles will take a long time to penetrate the market, even with aggressive subsidies and strict air quality regulations.
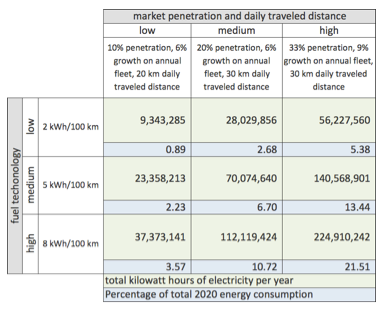
The nine scenarios present a wide of range of potential energy outcomes (Table 1). At the upper end of the scale, the combination of high market penetration (33%) and high energy consumption per motorbike (8kwH/100 km) would require a fifth of forecast energy consumption and necessitate substantial improvements in energy production and distribution. Given the aggressive market penetration and the high energy requirements, this estimate provides an upper bound on possible energy demand for electric motorcycles. At the lower end, 10% market penetration of less energy intensive e-bikes would require less than 1% of forecast energy consumption. Lower energy consumption motorcycles are unlikely to be available and with less than 10% market share, the shift to electric motorcycles may be too small to have much of an influence on air quality. Appendix A provides additional details on the assumptions built into each scenario.
Conclusion
Electric motorcycles have the potential to reduce pollution and dependence on fossil fuels in Solo and throughout Indonesia. However, the more successful the transition from gas-powered to electric-powered motorcycles is, the higher the pressure on the energy grid will be. Our forecasts indicate that a substantial shift to high-performance electric motorcycles could require a fifth of total predicted energy consumption. Without high performance, however, Indonesian consumers are unlikely to shift at all. This suggests that national policies to reduce the consumption of fossil fuels from the transport sector will need to be matched by substantial increases in the capacity of electricity production and distribution. This increased production will, in turn, make the shift in electricity production from high-pollution sources, like coal and oil, even more difficult. An overnight 100% percent shift to high-powered electric motorcycles would require 63% of current energy consumption to maintain average daily travel of 30km per motorcycle.
This suggests that even with consumer buy-in, electric motorcycles are unlikely to be a short-term or sole solution to Solo and Indonesia’s local pollution and fossil-fuel dependency problems. Additional measures to reduce the amount of daily travel—such as taxing gas consumption, improving public transportation, and restricting the use of high-pollution vehicles—are likely also required. Without consumer buy-in, additional policies are even more necessary. This buy-in will require low-cost motorcycles that have substantially higher performance than existing electric scooters and bikes. If these consume less energy than existing high-performance models, this would also go a long way to reducing the burden that a rapid adoption of electric motorcycles would put on the energy sector. Increased consumption would also encourage increased private-sector production. Nevertheless, given the current state of technology and the low market penetration of low-performance models, electrification will likely only play a small role in improving air quality in Indonesia in the near future.

Erick Guerra
Associate Dean for Research, Weitzman SchoolErick Guerra is Associate Dean for Research and Associate Professor in City and Regional Planning in the Weitzman School of Design.

Lucia Artavia
Weitzman School of DesignLucia Artavia is a graduate student at the University of Pennsylvania, where she is pursuing a master’s degree in city and regional planning.
Electric Motorcycle Use Scenarios
Three factors contribute to the estimates of future electric motorcycle use:
- The size of the motorcycle fleet. In 2013, there were 425,000 motorcycles registered in Solo (see Figure 1). This is more than double the number registered in 2008. Given Solo’s population and current vehicle saturation, however, this 20% average annual growth rate will not be sustained in the long run—a 20% growth rate would result in more than two motorcycles per capita in 2020. We opt for two more modest growth rates that are closer to the long-term average growth: 6% and 9%. These are still quite rapid and indicate a doubling of the fleet in 10 to 15 years. An even lower growth rate may be appropriate, despite recent growth trends. Our 2015 survey found a stable average of just over two motorcycles per household across income quintiles. This stability suggests that the city may already be approaching motorcycle saturation.
- Daily kilometers traveled per motorcycle. There are no available estimates of total daily motorcycle travel in Solo. We estimate two scenarios of average daily travel per motorcycle, based on interviews with employees of Kota Kita, a Solo-based NGO that has partnered on several professional and research projects and provided support for the electric motorcycle survey. These employees estimate that they travel from 30km to 35km per day, with more limited travel on weekends and holidays. We took 30km as the high motorcycle use rate and 20km as the lower use rate. Not all residents travel every day—our survey indicated that most motorcycle users also rely on other modes like walking and transit—and not all registered motorcycles are operational.
- Electric motorcycle market share. The penetration of electric motorcycles depends substantially on the quality and price of electric motorcycles relative to the quality and price of gas-powered motorcycles. The average motorcyclist pays just $35 per month for a motorcycle that can attain speeds of 100 kilometers per hour and costs just 50 cents to fuel for an average day of travel. Electric bikes and scooters, popular in China and Taiwan, have barely penetrated the market in Indonesia. They have much lower maximum speeds and have primarily been a substitute for bicycle and bus trips (Cherry and Cervero 2007; Fishman and Cherry 2015). At the other end of the quality spectrum, high-performance electric motorcycles are expensive. For example, a lower-end Zero Motorcycle costs around $10,000 (Zero Motorcycles 2015).
In our preference survey, which gave consumers the option of choosing an equivalent performance and price electric alternative with a realistic home-based charging system, respondents only chose electric motorcycles 25% of the time. For these scenarios, we chose 10%, 25%, and 33% market penetration. Below 10% market share, electric motorcycles will not have notable impacts on local or global emissions. At the high end, 33% market penetration is fairly unrealistic but provides a ceiling in terms of possible energy consumption due to electric motorcycles in the near-term.
Electric Motorcycle Fuel Technologies
We provide three scenarios of electric motorcycle energy consumption per kilometer of travel. At the low end, electric scooters consume approximately 2 kWh/100km (Cherry, Weinert, and Xinmiao 2009). At the high end, motorcycles with long ranges and speeds ranging from 90 to 180 kilometers per hour consume as much as 8 kWh/100km (Zero Motorcycles 2015). Since electric motorcycles in Solo will not need to go quite this fast, but will need to be substantially less expensive, we took the average of the low and high performance vehicles to arrive at a moderate estimate of average energy consumption per kilometer of travel. Without dramatic changes in electric vehicle technology, it is unlikely that an electric motorcycle in Solo will consume electricity outside of the range of 2 to 8 kWh/100km.
Badan Pusat Statistik Kota Surakarta. 2014. “Statistik Daerah Kota Surakarta 2014.” Badan Pusat Statistik Kota Surakarta. http://surakartakota.bps.go.id.
Cherry, Christopher, and Robert Cervero. 2007. “Use Characteristics and Mode Choice Behavior of Electric Bike Users in China.” Transport Policy 14 (3): 247–57. doi:10.1016/j.tranpol.2007.02.005.
Cherry, Christopher, Jonathan Weinert, and Yang Xinmiao. 2009. “Comparative Environmental Impacts of Electric Bikes in China.” Transportation Research Part D: Transport and Environment 14 (5): 281–90. doi:10.1016/j.trd.2008.11.003.
“Dinas Pendapatan Dan Pengelolaan Aset Daerah Provinsi Jawa Tengah.” 2015. http://dppad.jatengprov.go.id.
Employees of PT PLN. 2015. Interview with PT PLN employees.
Fishman, Elliot, and Christopher Cherry. 2015. “E-Bikes in the Mainstream: Reviewing a Decade of Research.” Transport Reviews 0 (0): 1–20. doi:10.1080/01441647.2015.1069907.
Kota Kita. 2012. “Solo Kota Kita Population Estimates.” http://solokotakita.org/.
Ministry of Energy and Mineral Resources and Energy Conservation. 2012. “Development of New and Renewable Energy and Energy Conservation in Indonesia.” Ministry of Energy and Mineral Resources and Energy Conservation. http://www.usea.org/sites/default/files/event-/Indonesia%20Country%20Pre….
OpenStreetMap Wiki contributors. 2015. “OpenStreetMap Wiki.” Main Page. http://wiki.openstreetmap.org/wiki/Main_Page.
Pennsylvania Department of Transportation. 2015. “Pennsylvania Crash Information Tool.” https://www.dotcrashinfo.pa.gov/PCIT/welcome.html.
Perusahaan Listrik Negara. 2012. “Electricity Supply Business Plan.” Perusahaan Listrik Negara. http://www.pln.co.id/dataweb/RUPTL/RUPTL%202013-2022%20Eng.pdf.
The World Bank. 2010. “Project Appraisal Document on a Proposed Loan in the Amount of U.S.$225 Million to the Republic of Indonesia for the Power Transmission Development Process.” The World Bank. http://www-wds.worldbank.org/external/default/WDSContentServer/WDSP/IB/2….
Universitas Muhammadiyah Yogyakarta & Departemen energi dan Sumber Daya Mineral (Provinsi Jawa Tengah). 2009. “Regional Energy Base Line Central Java Province.” Universitas Muhammadiyah Yogyakarta & Departemen energi dan Sumber Daya Mineral (Provinsi Jawa Tengah). https://ec.europa.eu/energy/intelligent/projects/sites/iee-projects/file….
U.S. Energy Information Administration. 2014. “Indonesia – International Energy Data and Analysis.” U.S. Energy Information Administration. http://www.eia.gov/beta/international/analysis_includes/countries_long/I….
World Health Organization. 2014. “WHO Mortality Database.” WHO. http://www.who.int/healthinfo/mortality_data/en/.
Zero Motorcycles. 2015. “Zero Motorcycles – The Electric Motorcycle Company.” http://www.zeromotorcycles.com/.
- Surakarta in Figures (data from Badan Pusat Statistik, 2013) http://surakartakota.bps.go.id/index.php?hal=publikasi_detil&id=1 [↩]
- Lucia Artavia (University of Pennsylvania) and Ahmad Rifai (Kota Kita) conducted interviews with four local terminal operators at a local power station on 3 July 2015 [↩]
