
Tax breaks for domestic oil and gas production cost taxpayers nearly $3 billion a year and provide little if any benefit in the form of oil patch jobs, lower prices at the pump, or increased energy security for the country. It's time for them to go.
Tax Preferences for Oil & Gas Production
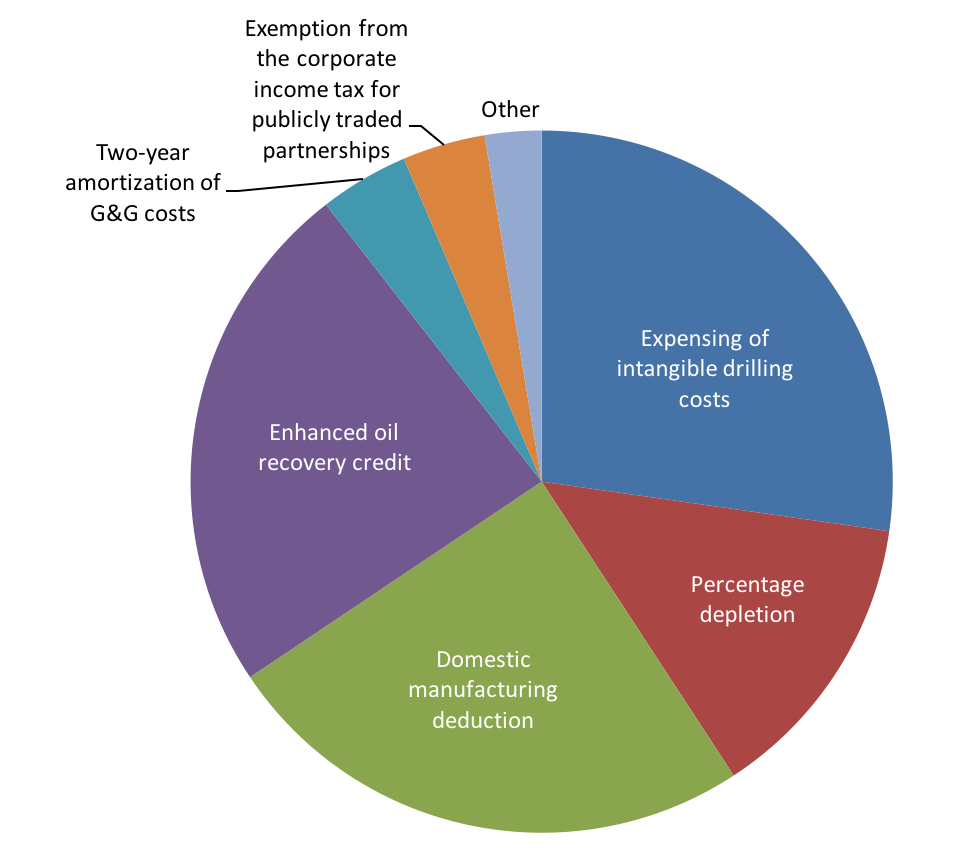
Oil and natural gas production benefit from a number of preferential tax breaks that exceed $36 billion over the 2017-2026 budget window.1 Three tax breaks for the oil and gas sector historically have been the most significant fossil fuel tax breaks: percentage depletion, expensing of intangible drilling costs, and the domestic manufacturing deduction for oil and gas production. See Figure 1 for the breakdown of the oil and gas-related tax preferences for fiscal years 2017 to 2026 from the U.S. Department of the Treasury.
The oldest of these preferences dates back a century and the newest is just thirteen years old—but they have in common the effect of reducing a firm’s tax burden, compared with the standard tax treatment of U.S. firms. This policy digest argues that it is time to remove these tax breaks and free up nearly $3 billion a year for other uses in the federal budget.
Fossil Fuel Tax Breaks: A Quick History
From the tax code’s beginning, the federal government aimed to promote increased oil and gas production through tax preferences. Over time, Congress has scaled back preferences for the industry to reduce dependence on oil, address public environmental concerns, and limit tax policy interventions in the market.
In 2009, world leaders at the Group of Twenty (G20) summit in Pittsburgh pledged to phase out fossil fuel subsidies to help mitigate climate change. This added an international dimension to the heretofore domestic debate over oil and gas tax preferences. Many scholars (e.g. Aldy 2013) have argued that maintaining tax preferences to oil and gas producers undermines the ability of the United States to persuade developing countries to reduce fossil fuel consumption subsidies that engender wasteful energy use. With tax reform discussions underway in Washington, it is time once again to revisit this topic and make the case for removing wasteful subsidies in the tax code.
Oil & Gas Tax Preferences in Detail
The big three tax preferences for domestic oil and gas drilling are percentage depletion, expensing of intangible drilling costs, and the domestic manufacturing deduction. Let’s take a closer look at each one.
Percentage Depletion: The tax code permits most expenses to be deducted as the expenses are incurred. But certain investment expenses are instead “capitalized,” and the costs deducted over a stretch of time rather than right away. One such category of costs are the costs related to purchasing a lease to drill a site expected to contain natural resources. The firm records those costs on its balance sheet as the value of the asset—proven reserves—the firm now owns. Because the value of the reserves diminishes as the firm extracts natural resources, the firm records a depletion expense on its income statement as a proxy for the reduction in value of the asset.
Standard tax treatment would stipulate cost depletion, under which the firm gets to deduct the cost of the reserve in proportion to the quantity of natural resources extracted. If ten percent of the reserve’s value was extracted in a year, then cost depletion says to take a deduction equal to ten percent of the reserve’s value. Cost depletion is akin to deductions for drawing down inventory in a store or taking an expense for depreciation of a piece of equipment. Percentage depletion, in contrast, allows the firm to deduct 15 percent of the revenue from each site as the depletion expense—up to 1,000 barrels of oil or 6,000 million cubic feet (mmcf) of natural gas. Moreover, only independent firms—firms that participate in “upstream” exploration and production but not in petroleum refining or other “downstream” activities—are eligible for percentage depletion; integrated firms—firms that vertically integrate production with refining or retailing—must use cost depletion.
Although its size and scope has been curtailed, the percentage depletion deduction is still a substantial tax preference, costing the federal government $500 million annually on average according to the latest U.S. Department of Treasury estimates.2 This estimate is at the low end of recent estimates given recent declines in production due to low oil and gas prices. Looking back over the past six years, the average annual cost is closer to $1.2 billion annually.
Intangible Drilling Costs. When extracting natural resources, firms can immediately deduct intangible drilling costs (IDCs). These costs relate to site improvement, construction costs, wages, drilling mud, fuel, and other expenses but exclude the cost of all drilling equipment that would retain salvage or resale value after use. Intangible drilling costs are the lion’s share of a well project’s costs. According to Wood Mackenzie Consulting (2013), IDCs account for between 70 and 85 percent of the well costs.
Under standard tax accounting and the uniform capitalization rules, IDCs would be capitalized as assets and written off over the life of the well in proportion to the quantity of resources extracted from a well.3 Current tax treatment of IDCs instead permits immediate expensing—that is, the entire value of the IDCs can be written off as an expense to offset taxable income in the year that the costs are incurred. This provision dates back to 1916, making it the oldest oil and gas industry tax preference. Today, the provision covers 100 percent of IDCs incurred by independent producers of oil and gas and 70 percent of IDCs incurred by integrated producers. The remaining 30 percent of an integrated producer’s IDCs can be depreciated over five years. Given that firms can immediately expense either all or the large majority of their IDCs, which are the largest component of production costs, the IDC tax preference is the most expensive, costing the federal government over $1 billion annually.4
Domestic Manufacturing Deduction. In addition to the depletion and IDC deductions, firms can apply the third major tax preference—the domestic production manufacturing deduction—to further reduce their taxable income. This preference, enacted in 2004, allows oil and gas firms to reduce their taxable income by up to 6 percent, limited to 50 percent of the firm’s wages that it pays employees.5 This is lower than the 9 percent deduction allowed other domestic manufacturing. This deduction costs the federal government nearly $1 billion annually according to the most recent Treasury estimate. As with percentage depletion, this estimate is at the low end of recent Treasury estimates that over the past seven years put this cost closer to $1.5 billion annually.
How to Measure the Impact on Production
How would domestic production of oil and natural gas be impacted if these tax preferences were removed? Despite the policy interest in this issue, there is surprisingly little research on this question. Reports sponsored by the industry forecast major cuts to domestic production should these tax preferences be eliminated. A study undertaken by Wood Mackenzie Consulting (2013) for the American Petroleum Institute, for example, estimates a 14 percent reduction in oil and gas production if expensing of IDCs is eliminated. It is difficult to assess the methodology in these reports as they rely on proprietary models and data that are not described in any detail in the reports.
Evaluating the implications of tax reform requires understanding how firms and markets would behave if oil and gas tax preferences were eliminated. Ideally, we’d use changes over time in tax provisions to measure how oil and gas drilling respond to changes in tax law. Unfortunately, we have very limited changes in the tax treatment of oil and gas that we can use to see how drilling changes as tax code provisions change.
While there is little in the way of good data on tax code changes and their impact on the oil and gas industry, there is a treasure trove of studies focused on how firms react to changes in oil and gas prices and how markets adjust as a consequence. In a research paper I recently completed (Metcalf 2016), I show how to translate changes in tax code provisions into price changes that have the same impact on drilling incentives. Using this Equivalent Price Impact, I can then use the results from existing research to forecast how firms and markets respond to a change in the tax law. This approach entails a three-step process:
- Translate tax reform into an equivalent drop in the price of oil or gas that firms receive. The equivalent price impact is the price change that answers the question, “If preferences had not been repealed, what decline in the price of oil or gas would have reduced the expected profitability of drilling the next well as much as the loss of tax preferences?”
- Estimate the drop in drilling rates. Because losing tax preferences makes firms behave as if the price of oil or gas has fallen, firms will no longer drill marginally profitable (in expectation) wells that become unprofitable with the loss in tax preferences. I can use existing estimates of the responsiveness of drilling to price changes to measure this.
- Project where the market will settle in the long run. If firms drill fewer wells in the short run, then they will produce less oil or gas in the long run. This will increase prices and decrease demand, driving the market toward a new equilibrium. I use a simple energy market model to show how prices and quantities change as the tax treatment of oil and gas is changed.
As shown in Metcalf (2016), removing these tax breaks is equivalent in impact to an oil price decline of 13.6 percent. Based on estimates of the price elasticity of drilling from the literature and adjusting for changes in initial well productivity, I estimate that the loss of these tax preferences should shift the domestic supply curve for oil leftward by 4 percent for oil and 10 percent for natural gas. This shift will leave the oil and gas markets out of equilibrium unless prices adjust to bring supply and demand back into balance. I explain that next.
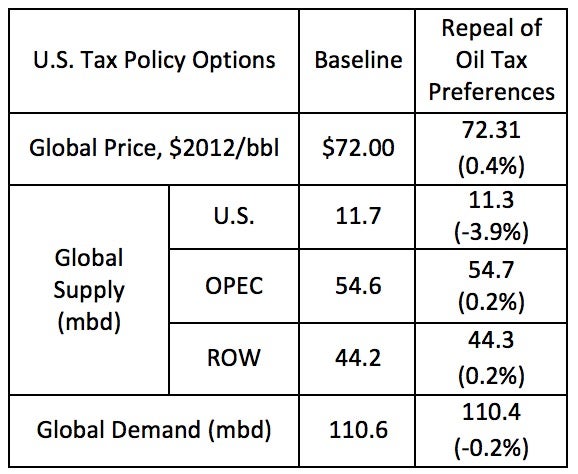
Table 1 shows the oil market response to the removal of the tax preferences. The model assumes that oil is produced by the United States, OPEC countries, and by a group comprising the rest of the world (ROW). I calibrate the model to one of the Energy Information Administration’s scenarios for oil markets in 2030 where oil prices are assumed to equal $72 a barrel in that year. (As a point of comparison, the current world oil price is $54 a barrel.) The EIA scenario forecasts global oil demand at 110.6 million barrels per day (mbd) with the United States producing just under 12 mbd, OPEC 55 mpd, and all other producers 44 mbd. When the tax preferences for oil production are removed, the domestic oil supply curve shifts by 4 percent and prices rise by 31¢ per barrel or less than one-half of one percent. In the new equilibrium, domestic production falls by just under 4 percent and production elsewhere increases by 0.2 percent. Global demand falls by 200,000 barrels per day or 0.2 percent.
Regardless of assumptions I make about the baseline scenario or how OPEC responds to changes in U.S. tax policy, cuts in domestic production never exceed 4 percent and the price increase is on the order of $0.50 to $1.00 a barrel—or one to two cents per gallon of gasoline.6
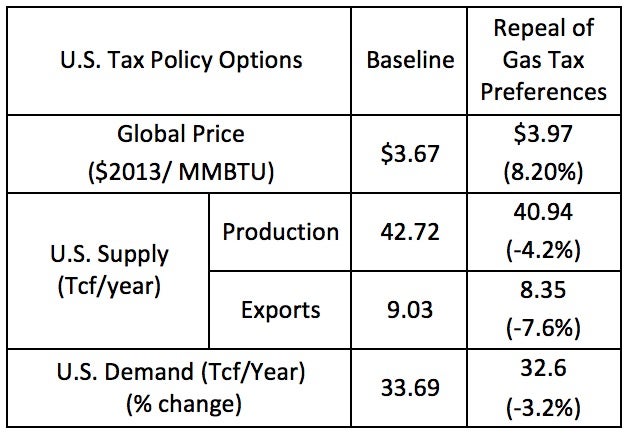
Results are similar for natural gas markets (see Table 2). Domestic supply falls by 3 to 4 percent. Price rises more than in oil markets with the price increase ranging from 8 to 10 percent depending on model assumptions. That’s a price increase of 30¢ to 35¢ per thousand cubic feet of gas—roughly the average monthly deviation in wellhead natural gas prices over the past decade.
Assessing Subsidy Impact
My research shows that tax preferences for domestic oil and gas production have very modestly increased domestic oil and gas production. In contrast to industry estimates that changing the tax treatment of intangible drilling costs alone would reduce domestic production by 15 percent, I find that removing the tax preferences for IDCs, percentage depletion and the domestic manufacturing deduction would reduce production by less than 4 percent. Similarly for natural gas. With just over 180,000 workers employed in U.S. oil and gas extraction, removing these tax breaks could lead to a loss of less than 20,000 jobs as drilling is cut back. This is less than one-tenth the typical monthly job creation in the United States since the end of 2010 and the emergence from the Great Recession.7
Any increase in consumer prices from eliminating these tax breaks would be so small as to be barely noticeable given the typical weekly or monthly variation in prices. Meanwhile, the removal of these tax breaks would help move the taxation of oil and gas investments in the direction of standard taxation of economic income. This moves us more in the direction of steering investment dollars to projects based on their fundamental productivity rather than tax advantages and so contributes to the greater overall efficiency of the U.S. economy. In the end, tax breaks for domestic oil and gas production cost taxpayers around $3 billion a year and provide little if any benefit in the form of oil patch jobs, lower prices at the pump, or increased energy security for the country. It’s time for them to go.
The author wishes to acknowledge the helpful comments of Angela Pachon and Jim Hines and seminar participants at the University of Pennsylvania. Funding for this research was provided by the Council on Foreign Relations.

Gilbert Metcalf
Professor of Economics, Tufts UniversityGilbert Metcalf is a professor of economics at Tufts University and was a 2016-2017 visiting scholar at the Kleinman Center.
Aldy, Joseph, 2013. “Proposal 5. Eliminating Fossil Fuel Subsidies.” In Michael Greenstone, Max Harris, Karen Li, Adam Looney and Jeremy Patashnik (eds), 15 Ways to Rethink the Federal Budget, 31-35. Brookings Institution, Washington, DC.
Metcalf, Gilbert E., 2016. “The Impact of Removing Tax Preferences for U.S. Oil and Natural Gas Production: Measuring Tax Subsidies by an Equivalent Price Impact Approach.” WP No. 22537, National Bureau of Economic Research, Cambridge, MA.
U.S. Department of the Treasury, 2016. General Explanations of the Administration’s Fiscal Year Revenue Proposals. Department of the Treasury, Washington, DC.
Wood Mackenzie Consulting, 2013. “Impacts of Delaying IDC Deductibility (2014 – 2025).” API, Washington, DC.
- U.S. Department of the Treasury, General Explanations of the Administration’s Fiscal Year 2017 Revenue Proposals, February 2016, otherwise known as the Treasury Greenbook. Since the research reported here was done, oil prices have fallen to the point that a 15 percent tax credit for enhanced oil recovery costs has become available once again. This accounts for $8.8 billion of the $36 billion tax break for oil and gas production. From 2006 through 2015 oil prices were sufficiently high that this tax credit had phased out. Whether it is available over the entire ten-year budgeting window as assumed in the Treasury Greenbook depends on oil prices during this coming decade. [↩]
- These and subsequent revenue losses are for fiscal year 2017 and are taken from U.S. Department of the Treasury (2016), otherwise known as the “Greenbook.” [↩]
- Even this tax treatment is overly generous as it ignores the fact that the leaseholder does not have to pay capital gains taxes on a successful well’s capital gains (the difference between the cost of acquiring the property and the value of the property once oil has been discovered). [↩]
- To be clear, the subsidy is the deferral of taxes to a later date by the ability to write off IDC’s immediately. In effect, firms are getting an interest-free loan from the government. If interest rates rise from their current historically low levels, the value of this tax subsidy will rise dramatically. [↩]
- The domestic production manufacturing deduction was introduced to replace the exclusion of income from foreign sales from taxation that the European Union successfully challenged as an export subsidy before the World Trade Organization. Ironically, the new deduction was extended to domestic oil and gas production despite the fact that domestic firms were not allowed to export oil (and very little natural gas was exported). [↩]
- It is worth nothing that the consumer price reduction arising from the tax subsidy to domestic production benefits consumers worldwide and not just U.S. consumers. The United States consumes one-fifth of global oil and so enjoys one-fifth of the benefits of lower prices from these tax breaks. [↩]
- Additional jobs could be lost in upstream (e.g. drill rig manufacturer) but other jobs could be gained as savings from loss of tax break are redirected to other uses. Oil and gas employment data found here. Monthly net job change found here. Both sites accessed on April 19, 2017. [↩]
