Digest

Electric Utility Trends in Pennsylvania (2005-2014)

This policy digest examines historic trends over a ten-year period (2005-2014) related to basic activity metrics of Pennsylvania electric distribution companies (EDCs). The Pennsylvania Public Utility Commission (PUC) annually publishes its Electric Power Outlook (EPO) for Pennsylvania Report.1  The EPO report compiles information submitted by PA EDCs and includes information about plans and projections for meeting future demand.  This digest also relies on additional data from the U.S. Energy Information Administration.

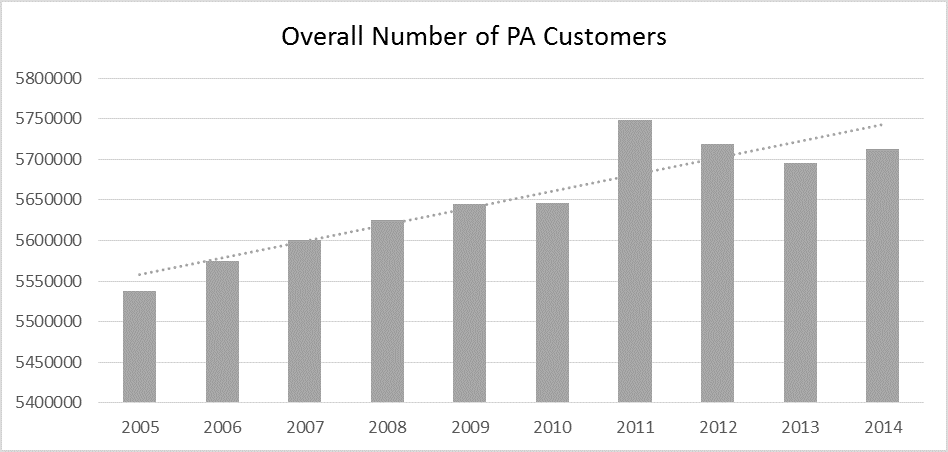
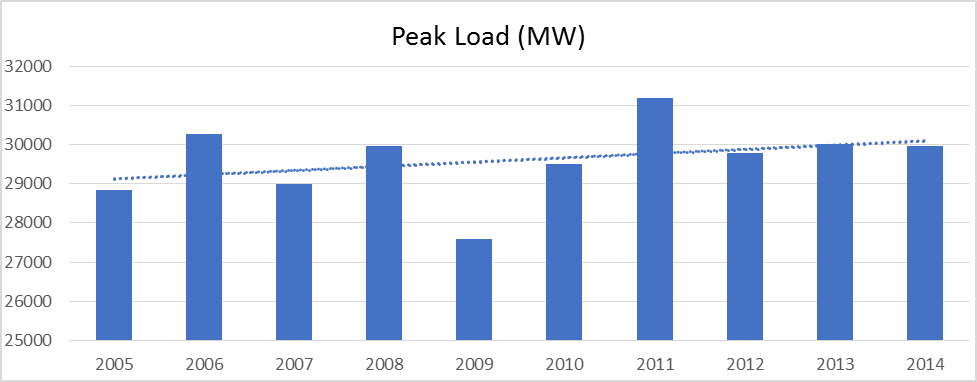
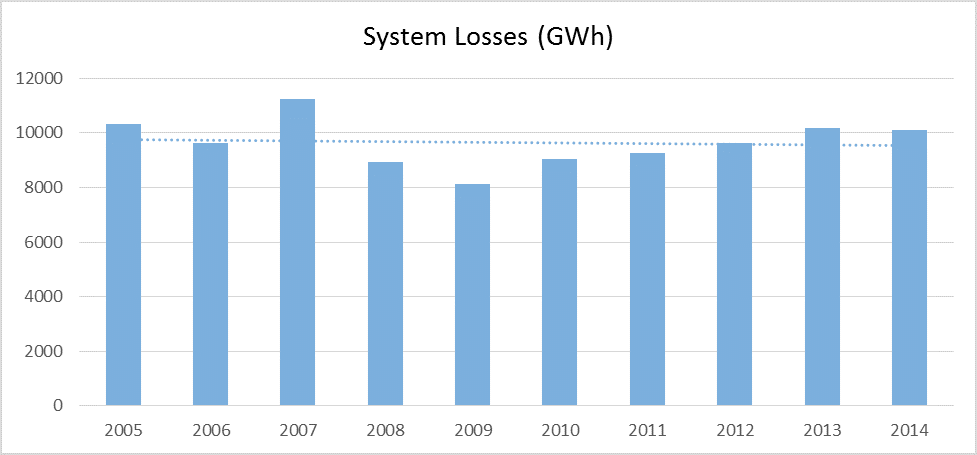
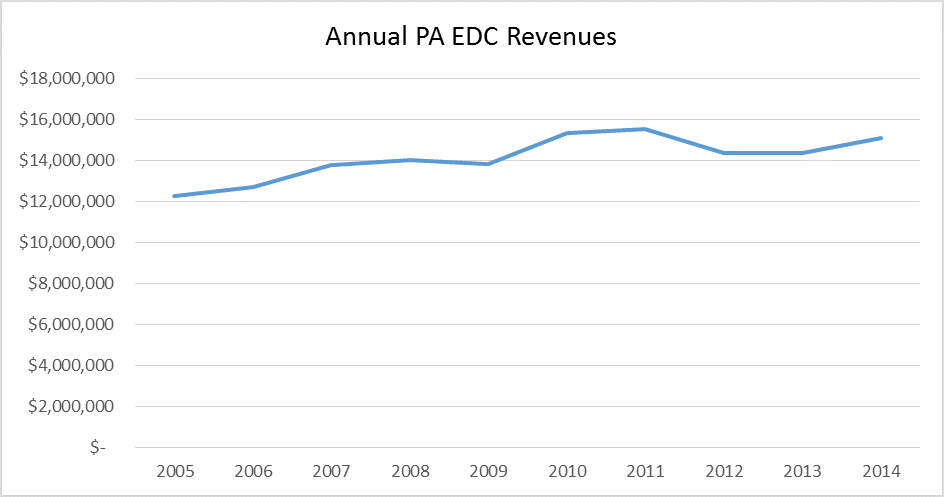
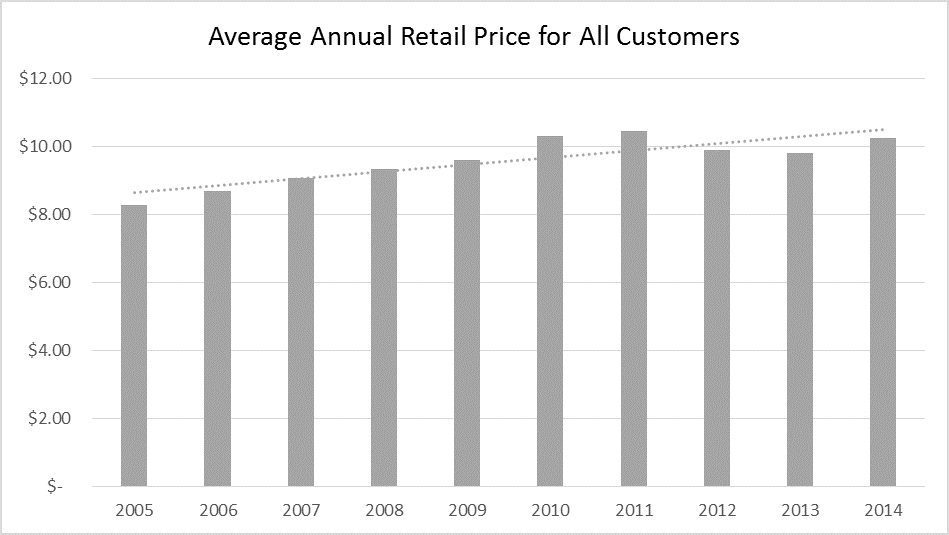
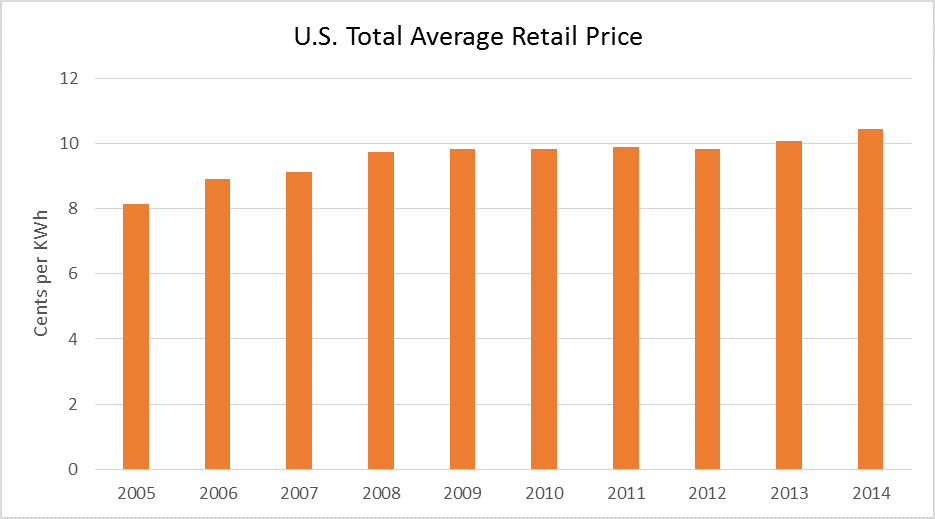
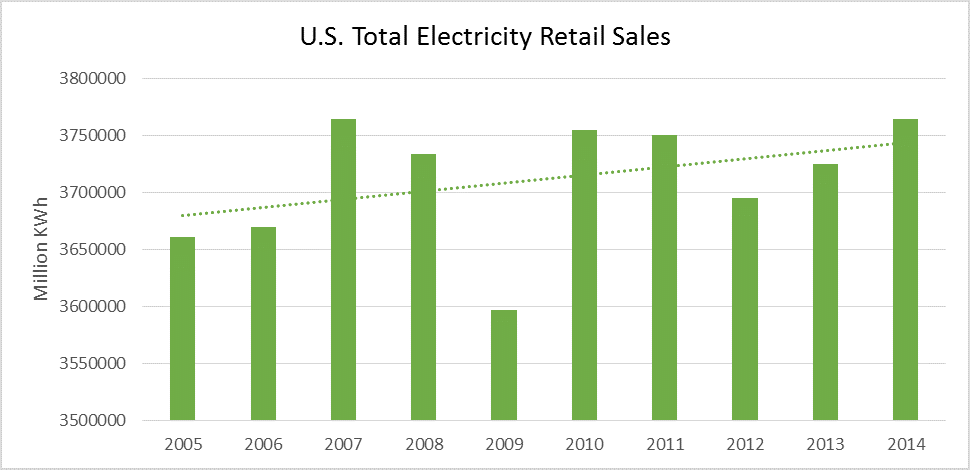
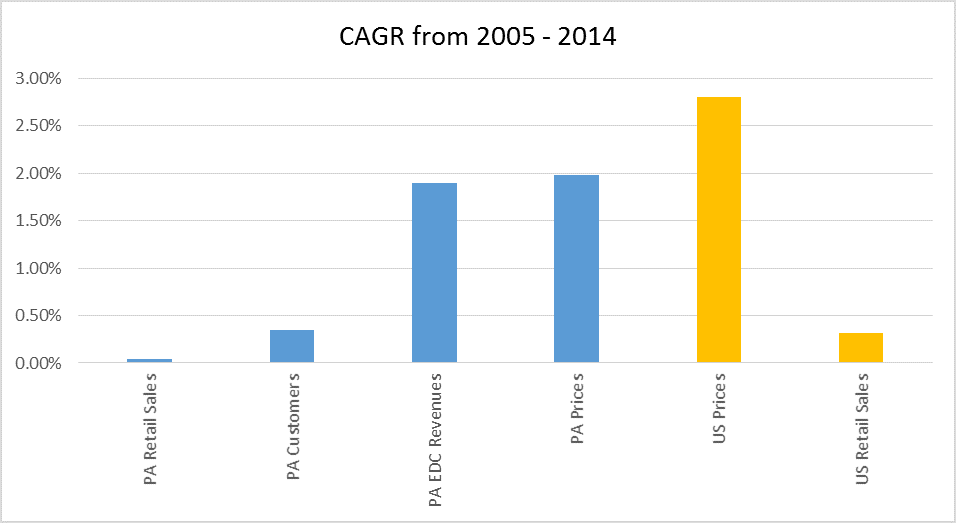
These data show that over the 2005-2014 period, Pennsylvania retail electricity sales and total consumers are growing at slower rates than Pennsylvania electricity prices and EDC revenues.  However, Pennsylvania retail sales and prices are growing at a slower rate than U.S. retail sales and prices.  Pennsylvania has experienced average annual customer growth rates of 0.35% and average annual increases in peak loads of 0.42%.  Pennsylvania’s system losses have decreased over the period by an average of 0.24% per year.

Figure 1: From 2005 to 2014, total electricity consumption by the 11 PA EDCs
Figure 1: From 2005 to 2014, total electricity consumption by the 11 PA EDCs2 was relatively flat with a compound annual growth rate3 of 0.04%. Beginning with the 2011 EPO (reporting 2010 data), the PUC noted that “several EDCs have redefined their commercial and industrial (C&I) customers into small C&I and large C&I. Thus comparisons with historical data are not valid for these sectors.”4 Notwithstanding the preceding disclaimer, the following compounded annual growth rates (CAGR) are provided, including 0.12% for the residential sector, -0.64% for the commercial sector, and 0.085% for the industrial sector. 

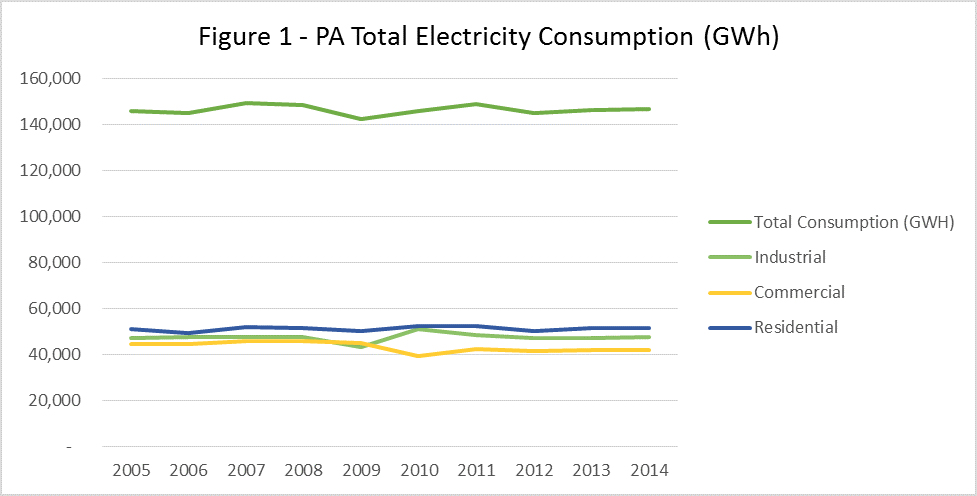
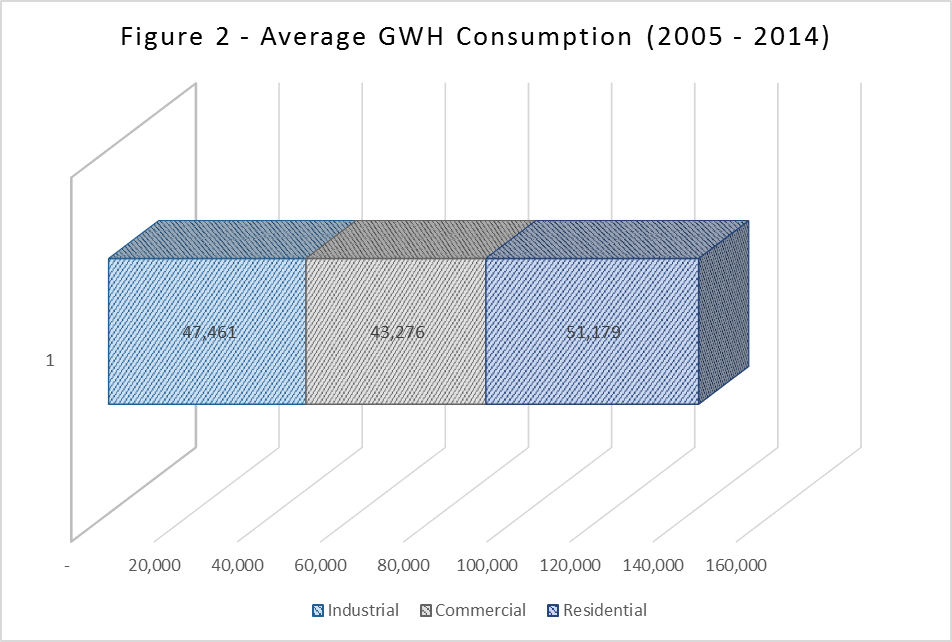
Customer and Usage Trends

Figure 2: The ten-year period averages indicate the residential sector was consistently the largest-consuming sector, followed by the industrial and commercial sectors.
 Figure 3: Overall, customer growth was observed. The CAGR of total number of EDC customers was 0.35% from 2005 to 2014. Comparing 2005 to 2014, total customer growth was about 3.16%.
Figure 3: Overall, customer growth was observed. The CAGR of total number of EDC customers was 0.35% from 2005 to 2014. Comparing 2005 to 2014, total customer growth was about 3.16%.

System Peak and Losses

 Figure 4: Peak load tended to increase over the period.  Compared to 2005, an increase of 3.82% was observed in 2014 and the CAGR over the 2005-2014 period was 0.42%.
Figure 4: Peak load tended to increase over the period.  Compared to 2005, an increase of 3.82% was observed in 2014 and the CAGR over the 2005-2014 period was 0.42%.
 Figure 5: System losses tended to decrease over the period. Compared to 2005, losses in 2014 decreased by 2.15% and the CAGR for the 2005 – 2014 period was -0.24%.
Figure 5: System losses tended to decrease over the period. Compared to 2005, losses in 2014 decreased by 2.15% and the CAGR for the 2005 – 2014 period was -0.24%.

Revenues and Prices

 Figure 6:  Figures 6 & 7 use data compiled by the U.S. Energy Information Administration (EIA) for the 11 PA EDCs examined throughout this analysis.
Figure 6: Figures 6 & 7 use data compiled by the U.S. Energy Information Administration (EIA) for the 11 PA EDCs examined throughout this analysis.5 Data accounts for residential, commercial and industrial sectors (as well as the transportation sector which adds a comparatively de minimus contribution to totals). The CAGR for EDC revenues was 1.9% over the period.
Figure 7: The price data supplied by the EIA are simple averages determined by dividing revenues by sales.  These data may not capture sectoral (residential, commercial, and industrial) trends.  For example, price in the residential sector could be increasing while the total number of residential customers is declining.  At the same time, industrial prices could be falling while the total number of industrial customers is increasing. EIA’s methodology for the data used would not capture these nuances. However, these data may still be useful and are presented for both PA (figure 7) and the U.S. (figure 8) as an apples to apples comparison. The CAGR for retail prices for all PA customers was 1.98%.
Figure 7: The price data supplied by the EIA are simple averages determined by dividing revenues by sales.  These data may not capture sectoral (residential, commercial, and industrial) trends.  For example, price in the residential sector could be increasing while the total number of residential customers is declining.  At the same time, industrial prices could be falling while the total number of industrial customers is increasing. EIA’s methodology for the data used would not capture these nuances. However, these data may still be useful and are presented for both PA (figure 7) and the U.S. (figure 8) as an apples to apples comparison. The CAGR for retail prices for all PA customers was 1.98%.
Figure 8: Annual data for figures 8 & 9 were taken from U.S. EIA
Figure 8: Annual data for figures 8 & 9 were taken from U.S. EIA6 7 The CAGR for total U.S. average retail prices of electricity from 2005 to 2014 was 2.8%.
 Figure 9: Total U.S. retail electricity sales trended upward over the period examined, with a CAGR of 0.31%.
Figure 9: Total U.S. retail electricity sales trended upward over the period examined, with a CAGR of 0.31%.

CAGR Comparisons

Figure 10: A basic comparison of CAGRs for the metrics examined indicates that PA EDC revenues (1.9%) and retail prices (1.98%) have higher growth rates compared to overall PA retail sales (0.04%), sector specific consumption (0.12% residential, -0.64% commercial, 0.085% industrial), and total customer growth (0.35%). These data merely indicate that over the 2005-2014 period, EDC revenues and retail prices grew at a greater rate than customers or retail sales.  However, over the same period, PA retail prices grew at a slower rate than U.S. prices (2.8%).  Similarly, total PA retail sales grew at a slower rate than U.S. retail sales (0.31%). Due to lack of data, this analysis does not examine growth rates in utility costs.
Figure 10: A basic comparison of CAGRs for the metrics examined indicates that PA EDC revenues (1.9%) and retail prices (1.98%) have higher growth rates compared to overall PA retail sales (0.04%), sector specific consumption (0.12% residential, -0.64% commercial, 0.085% industrial), and total customer growth (0.35%). These data merely indicate that over the 2005-2014 period, EDC revenues and retail prices grew at a greater rate than customers or retail sales.  However, over the same period, PA retail prices grew at a slower rate than U.S. prices (2.8%).  Similarly, total PA retail sales grew at a slower rate than U.S. retail sales (0.31%). Due to lack of data, this analysis does not examine growth rates in utility costs.

Christina Simeone

Kleinman Center Senior Fellow
Christina Simeone is a senior fellow at the Kleinman Center for Energy Policy and a doctoral student in advanced energy systems at the Colorado School of Mines and the National Renewable Energy Laboratory, a joint program. 
  1. PA PUC Electric Power Outlook for Pennsylvania Report can be found at http://www.puc.state.pa.us/utility_industry/electricity/electric_reports.aspx  []
  2. Includes Duquesne Light, Met-Ed, Penelec, Penn Power, PPL, PECO, West Penn, UGI, Citizens’, Pike County and Wellsboro. []
  3. Compound Annual Growth Rate (CAGR) is the mean annual growth rate of a series of values over a specific period of time longer than one year. Said another way, this calculation measures the annual rate to grow the beginning value to achieve the ending value over a period of time. Fluctuations in the values between time periods are not accounted for []
  4. Electric Power Outlook for Pennsylvania 2010-2015, page 21, http://www.puc.state.pa.us/general/publications_reports/pdf/EPO_2011.pdf []
  5. Form EIA-826 aggregated data on sales and revenues, available at http://www.eia.gov/electricity/data/eia826/ []
  6. U.S. EIA’s Table 9.8 Average Retail Prices of Electricity from the January 2016 Monthly Energy Review released January 27, 2016 and available at http://www.eia.gov/totalenergy/data/annual/index.cfm#electricity []
  7. U.S. EIA’s Table 7.6 Electricity End Use from the January 2016 Monthly Energy Review released January 27, 2016, available at http://www.eia.gov/totalenergy/data/annual/index.cfm#electricity []