Understanding the Challenges of Integrating Seasonal Resources into PJM’s Wholesale Capacity Market

While grid operators like PJM prioritize predictability, renewables like wind and solar are being left in the cold. Will seasonal resources be able to participate in PJM’s capacity market? Explore the issues.
Introduction
Electricity grid operators—like those at the PJM Interconnection (PJM)—are tasked with keeping the lights on. They do this by balancing demand for electricity with available electricity supplies on a real-time basis. Due to the changing mix of electricity supply resources powering the grid, operators are assigning greater value to resources that can predictably deliver power, such as traditional gas, coal, and nuclear generation. However, at the same time, policymakers have been promoting expanded development of wind, solar, energy efficiency (EE), demand response (DR), and energy storage. These resources have certain limitations on their ability to provide service to the grid, due to seasonal fluctuations in performance. For example, wind and solar can only provide power when it is windy or the sun is shining, and the wind tends to be stronger in the winter and the sun stronger in the summer. Some forms of EE and DR are only available in the summer, such as activities to reduce air conditioner energy consumption.
Early efforts to allow seasonal resources to pair up to offer steadier grid performance have yet to be successful. As such, PJM’s leaders have identified the problem and have launched an effort to engage stakeholders to develop an agreeable solution.
This digest provides background information on PJM’s various markets, recent operational challenges posed by a rapidly changing electric generation fuel supply mix, and an introduction to the seasonal resources problem statement. The goal of the digest is to explain the seasonal resources issue in terms understandable to a non-expert audience.
About PJM’s Markets
PJM operates the electric grid covering portions of 13 Mid-Atlantic States and the District of Columbia. It is the largest regional transmission operator (RTO) in the country. PJM has three core priorities: maintain power availability (i.e. operating the grid), oversee the buying and selling of electricity in the wholesale power market (i.e. operating the markets), and plan for future electricity system needs. These three functions are interrelated as functioning markets are needed to send accurate price signals to market participants (e.g. power generators and consumers), and these market signals and grid operations must reflect both current realities and reasonably anticipated future needs.
For purposes of understanding the seasonal resources issue, there are three PJM markets that require explanation; 1) energy, 2) capacity, and 3) ancillary services markets.
The Energy Market—The energy market coordinates the demand for electricity (from electricity users, usually represented by resellers, such as utility companies) with the supply of electricity (e.g. from generators) by setting prices similar to a stock exchange. It is the most fundamental way PJM keeps the light on.
PJM runs these markets through auctions where generators bid a price (that reflects certain costs, such as fuel, operations, and maintenance) in which they can supply a specific amount of power. PJM accepts (or clears) individual bids on a least-cost basis—meaning they will pick the lowest cost bid first, then the second lowest, etc.—until they have secured sufficient supply to meet demand. When supply equals demand, the market is “cleared” and the wholesale price of power is established. All resources that clear the market are paid the wholesale clearing price, as opposed to the price they bid into the market.
The energy market has to factor in important geographic differences that impact electricity costs, as well as how costs change at different times of the day. PJM uses locational marginal pricing (LMP) to reflect the value of electricity in a given location at a given time. For example, electricity delivered to an area with high transmission congestion (e.g. a highly populated area with infrastructure constraints) will be more expensive than electricity delivered to an area were energy can flow freely through the wires.
In order to ensure resources are available from day-to-day, PJM’s energy market has to think about both today and tomorrow’s demand. To do this, PJM has two primary energy markets, the Real-Time and Day-Ahead markets. The Day-Ahead market is a forward market, meaning it contracts for future delivery of electricity. PJM forecasts the amount of electricity it expects will be needed for the next day on an hourly basis and calculates prices based on this demand, generator supply bids, and previously contracted power (i.e. preexisting agreements for power supply between generators and consumers). The Real-Time market functions like a spot market where electricity is purchased for immediate use. The Real-Time market balances energy demand with energy supply in five-minute intervals, deriving an LMP for each delivery area with market settlement happening on an hourly basis.*
*As part of the Energy Market, PJM also runs a Day-Ahead Scheduling Reserve Market to secure short term reserves to deal with unanticipated system needs during the subsequent operating day.
The Capacity Market— The capacity market aims to ensure long-term reliability by securing future availability of resources (e.g. construction of new generation, or DR) to meet forecasted demand needs, plus an extra margin of reserve. The capacity market overcomes the “missing money” problem created when certain important resources don’t operate frequently enough in the energy market to economically justify continued operation. These resources may still be very important to keeping the lights on, especially during times of the year when power demand is very high. The capacity market creates an additional revenue stream intended to keep these extra resources available. In addition, capacity prices from the market are meant to incent maintenance of existing resources and send price signals to investors indicating when new resources are needed.
PJM developed its Reliability Pricing Model (RPM) in 2007, establishing fundamental methods to secure capacity using a market-based system. Under the RPM, PJM runs competitive forward auctions—called Base Residual Auctions or BRAs—to secure electric capacity for delivery three years in the future. For example, the BRA held in May 2016 will contract for capacity to be delivered in 2019/2020.** Capacity can come from generators or from demand reduction (like EE and DR). Among other things, the auctions factor locational capacity pricing to reflect the geographic value of the resource and also factor in the work of PJM’s Regional Transmission Expansion Planning process, for example to consider potential new areas of transmission constraint.
**PJM operates in “delivery years”, similar to the concept of fiscal years, which run from June 1 through May 31
Once the annual BRA capacity auction clears, PJM runs at least three “incremental auctions” to allow resources to be substituted (e.g. if a contracted generator needs to leave the market) or to secure additional resources to meet changing demand needs.
The Ancillary Services Markets—PJM runs several markets for ancillary services, including Regulation, Synchronized Reserve, Non-Synchronized Reserve, Day-Ahead Scheduling, and Black Start Service. These all support the operation and flexibility of the transmission grid system. The Regulation Services market helps maintain the desired electrical grid frequency of 60 hertz—almost like the speed of the electricity moving through the wires—providing system stability by adjusting generation output to correct for short-term changes in electricity demand. Typical PJM Regulation market resources include energy storage (e.g. battery, flywheel), renewables, and fossil-fuel fired plants.
Whereas the Regulation services market helps to fine tune the system, the Synchronized Reserve market serves as a sort of emergency backup mechanism. The Synchronized Reserve market secures resources that can be available to deliver power supply on short notice (i.e. 10 minutes), for example, if a power plant unexpectedly has to shut down or if weather events cause a spike in demand. Synchronized Reserve resources need to be able to quickly deliver and can include, for example, generation resources (such as diesel generators or combustion turbines) and DR. The Non-Synchronized Reserve market basically delivers the same services as the Synchronized Reserve market, except the Non-Synchronized Reserve resources are offline until called upon. There is also a Day-Ahead Scheduling Reserve market where supplemental 30-minute reserves can be procured.
The Black Start Service market consists of generators that can supply power to restore the electrical system in the unlikely case there is an event causing the entire grid to lose power.
Polar Vortex, Natural Gas, and Capacity Market Reforms
In calendar year 2008, PJM’s system generation mix was comprised of approximately 56 percent coal, 35 percent nuclear, and 7 percent natural gas, with the remainder coming from hydro, municipal waste, wind, oil and other resources. In calendar year 2013, the PJM system mix had changed considerably, with coal only supplying about 44 percent, nuclear remaining unchanged at 35 percent and natural gas’s share climbing to over 16 percent. Though this seems like an incremental change in fuel mix, the increasing role of natural gas as a resource in PJM had profound, and somewhat unanticipated operational impacts.
The Polar Vortex that blanketed the PJM region in extreme and prolonged cold temperatures from January 6 through January 8 of 2014 highlighted the changing system needs that came along with increased reliance on natural gas.1 PJM reached eight of the top 10 winter peak demands in all of its history in the month of January 2014, setting a new record wintertime peak electricity demand of 141,846 reached on January 7.
During these cold temperatures, demand for gas was extremely high for both space heating (e.g. homes, businesses) and for power generation (as more electricity was used for space heating). This competing heat versus power demand created significant problems for the electricity system, as gas supply was diverted (per the terms of the interruptible gas supply contracts predominately used by gas-fired generators) from power generators to heating customers, causing many gas-fired power generators to unexpectedly shut down (i.e. forced outage). The extreme cold also caused mechanical problems with coal, nuclear, gas and other supply resources. In total, PJM experienced a staggering 22 percent forced outage rate, significantly higher than the typical winter peak outage rate of 7-10 percent. Equipment failure caused 42 percent of the outages, with 24 percent of the outages attributable to lack of fuel (mostly at gas plants) to start or power the units. Gas-fired generators accounted for 42 percent of the unavailable megawatts with coal-fired generators accounting for 34 percent and nuclear generation accounting for about 3 percent.
In spite of these challenges, PJM was able to implement emergency provisions and kept the lights on. However, the price impacts were significant. LMP prices in the energy market exceeded $1,800 per megawatt hour (exceeding the $1,000/MWh price cap), the Regulation market cleared at $3,296 per megawatt hour, and the Synchronized and Non-Synchronized Reserve markets hit their maximum prices of $800 and $400, respectively. To put this in context, total net billings to PJM members for the single month of January 2014 (which included a second series of winter storms from January 17-29) were one-third of the entire year’s total net billings in 2013.2
Looking forward, PJM’s analysis found that a similar forced outage rate, coupled with extreme cold temperatures and further coal plant retirements would likely result in reliability issues.3 With these issues in mind, PJM sought reforms to its capacity market in order to provide greater incentives for performance and greater resource availability during peak power conditions.
PJM’s Capacity Performance Proposal was the package of changes to the RPM model proposed to deliver the needed capacity market reforms. Developed under an expedited stakeholder process and eventually approved by FERC on August 10, 2015, the final Capacity Performance Requirement (CPR) made significant changes to what resources would qualify for capacity payments in the future. The CPR is intended to increase capacity payments, which PJM expects generators to use to invest in modernizing equipment, firming fuel supplies, and diversifying fuel resources. The end result is expected to improve generator performance during system emergencies, enhance reliability, and reduce customer costs during extreme weather situations. In addition, due to the inverse relationship between capacity and energy markets, increased capacity prices may lead to lower clearing prices in energy markets, all things being equal. For example, analysis of PJM’s initial Capacity Performance Proposal pegged the incremental cost increase in the capacity market for the transitional 2017-2018 year at $3.1 ($4.2 billion with a $2.2 billion energy market cost reduction) for a net incremental cost impact of $0.9 to $2 billion.4
The CPR “pay-for-performance” model is intended to help shift some of the risk of non-performance away from system operators and consumers and towards capacity resources. It is expected that the system will incent generators to secure fuel supplies, add dual-fuel capabilities, help protect operations in extreme weather events, and will largely provide economic benefits to resources that are available year round.
In general terms, CPR eligible resources can enjoy higher capacity prices but will have greater performance obligations, and penalties for failure to perform. CPR eligible resources will:
- Have increased performance expectations that include being able to perform during emergencies and must be capable of delivering sustained, predictable operations.
- Assume all financial risks if unable to perform. The non-performance charge may be higher than the capacity market revenues received.
- Reap increased revenues from higher capacity payments and potential bonus payments (funded from penalties on underperforming generators) if performance expectations are exceeded.
PJM’s developed a transition plan from the existing capacity market to the CPR. For the 2016-2017 and 2017-2018 delivery years—for which BRAs have already taken place—PJM will hold voluntary transition auctions to provide additional revenues for any generation capacity that can meet the CPR criteria, even if that capacity is already committed for the relevant delivery year. This is meant to create a “glide path” for certain CPR resources and enhance resource performance in delivery years where BRA’s have already cleared. For the 2018-2019 and 2019-2020 delivery year BRA’s, only 80 percent of the market resources will need to be CPR eligible with the remainder of the market being open to “Base Capacity” such as wind, solar, EE, permit-constrained fossil generation, or other traditional resources that can’t commit to the higher CPR level of performance.
Base Capacity (BC) resources may not be capable of delivering sustained, predictable operations and/or may not be able to provide energy outside of the summer season. The BC product clearing price would be lower than the CPR clearing price, reflecting the differences in delivery requirements. In addition to the overall 20 percent BC limit, PJM has also established BC Resource Constraints for the entire RTO and individual geographic delivery zones (local deliverability areas or LDAs) that place maximum limits on the amounts of BC DR, EE and generation resources that are allowed in certain areas. For the 2020-2021 delivery year, 100 percent of the capacity market must meet the CPR criteria.
The 2018-2019 BRA was conducted under the new RPM design with an 80 percent CPR requirement and 20 percent BC requirement. The RTO-wide resource clearing price (RCP) for the CPR capacity resources was $164.77/megawatt day, which as expected, was significantly higher than the $120/MW day in the 2017-2018 BRA under the previous RPM construct.5 Also as expected, the RTO-wide 2018-2019 BC product cleared at $149.98, lower than the CPR clearing price.
The 2019-2020 BRA was also conducted under the new RPM design with an 80 percent CPR requirement and 20 percent BC requirement that represents the final transition year with the BC offering.6 The RTO-wide clearing price for the CPR product was $100/MW day and $80/MW day for the RTO-wide BC product.
Seasonal Resources Problem Statement
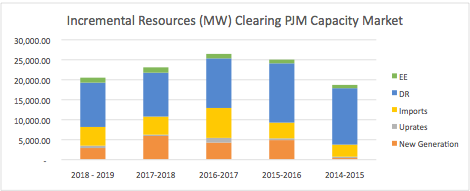
The majority, typically around 85 percent, of megawatts clearing capacity markets come from existing generation resources located within PJM. The remaining 15 percent of megawatts come from new generation, generation uprates, imports from other RTO/ISOs, DR, and EE. Chart 1 shows the breakdown of these incremental resources as a percent of total capacity procured. Seasonal resources could clear the market as existing or new generation, for example existing or new wind or solar farms. Many forms of DR and EE may also be seasonal in nature.
For intermittent generation, like wind and solar, PJM assigns capacity factor— a measure of actual output versus potential output—that helps determine how many megawatts can qualify for capacity payments. For wind, PJM uses a capacity factor of 13 percent, meaning that for every 100 MW of wind energy installed, 13 MW are eligible to be offered into capacity markets. For delivery year 2017-2018, approximately 803 MW of wind cleared the capacity market, meaning that 6,182 MW of nameplate7 wind capacity is needed to support that commitment. For solar, the capacity factor is 38 percent, so about 306 MW of nameplate solar capacity would be needed to support the 116 MW of solar that cleared for delivery year 2017-2018.
Once the capacity market transitions to 100 percent CPR and the BC option is eliminated, many resources may not be able to qualify for capacity payments due to operational limitations. Many of the impacted resources are seasonal (e.g. certain types of DR or EE), intermittent (e.g. wind or solar), or are run-time constrained (for example, generators with air quality permit limitations or energy storage). These resources would bear too much financial risk if they couldn’t perform in response to emergency events. Nonetheless, these resources can still contribute value to PJM, especially in certain peak periods.
Envisioning these issues, PJM developed Aggregation Rules meant to allow complementary seasonal resources to join together to offer into the CPR capacity market. For example, wind turbines that typically have strong winter output could combine with summer EE and DR to potentially offer a resource that would meet the CPR annual operational requirements. However, in the 2018-2019 BRA, there were no aggregated offers submitted.
As a result, in January 2016, a PJM governance committee and interested stakeholders moved forward with a Seasonal Resources Problem Statement and associated Task Force to investigate the issue.8 PJM task forces are temporary groups made up of interested stakeholders charged with addressing a specific, unique issue defined by the group’s charter.
The March 15, 2016 problem statement recognizes that:9
- There are concerns about the ability of certain resources with different seasonal availabilities to participate at meaningful levels as capacity resources.
- These resources have reliability value during varying peak periods, and inability to use them may impact least-cost procurement.
- The elimination of the Base Capacity product in the 2020-2021 delivery year and the changes to measurement and verification of non-summer CPR DR resources are creating significant barriers for resources with seasonal differences.
- No aggregated offers were submitted in the first BRA with CPR.
- Federal and state policies are increasingly promoting DR, EE, and renewable resources, warranting exploration of how to more meaningfully incorporate these resources into capacity markets.
- Rule changes needed to facilitate seasonal resource participation in the capacity market would need to happen before the 2020-2021 delivery year BRA in May 2017.
- The problem statement outlined certain actions for the Task Force to consider, for example:
- Evaluate the CPR rules and experiences to date to assess the terms under which seasonal resources can participate as capacity resources in the 2020-2021 BRA.
- Analyze alternatives to requiring the 100% annual CPR requirement, including but not limited to aggregation strategies, measurement and verification, etc.
- When considering various alternatives, evaluate potential impacts on operational flexibility, reliability, and economic impact on capacity and energy markets.
- Determine if there are barriers to entry for seasonal resources in the 2020-2021 delivery year and beyond, and identify whether these barriers can be removed while maintaining the 100% CPR commitment.
The Task Force’s work plan (as of March 2016) identified November 2016 as the target date for PJM to file a proposed rule change with the Federal Energy Regulatory Commission (FERC). The Task Force uses a consensus based resolution process to develop solutions based on collaborative stakeholder input. As such, solutions need to achieve a certain degree of broad stakeholder support (via voting) in order to move to the FERC filing process.
The importance of the seasonal resources dilemma was reinforced with the May 2016 results of the 2019-2020 BRA, where the majority of seasonal resources cleared as BC and no aggregated offers were tendered. Of the 10,248 MW of DR that cleared the market, 94% cleared as BC and 6% cleared as CRP. Of the over 1,515 MW of EE that cleared, about 70% was CRP and 30% BC. For the 969 MW of wind capacity value cleared, 9.2% was CRP and 90.8% was BC. For the 335 MW of solar capacity value cleared, 0.1 % was CRP and 99% was BC.
This raises significant questions about next year’s BRA and the ability of these important seasonal resources to participate in PJM’s capacity market.

Christina Simeone
Kleinman Center Senior FellowChristina Simeone is a senior fellow at the Kleinman Center for Energy Policy and a doctoral student in advanced energy systems at the Colorado School of Mines and the National Renewable Energy Laboratory, a joint program.
Featured Graphic: USDA Photo by Lance Cheung via Creative Commons
- More information on the impacts of the 2014 Polar Vortex on PJM’s system can be found in PJM’s “Analysis of Operational Events and Market Impacts During the January 2014 Cold Weather Events,” May 8, 2014 available at http://pjm.com/~/media/documents/reports/20140509-analysis-of-operational-events-and-market-impacts-during-the-jan-2014-cold-weather-events.ashx [↩]
- IBID, PJM’s “Analysis of Operational Events and Market Impacts During the January 2014 Cold Weather Events,” [↩]
- PJM“ Problem Statementon PJM Capacity Performance Definition,” August 1, 2014, available at http://www.pjm.com/~/media/documents/reports/20140801-problem-statement-on-pjm-capacity-performance-definition.ashx [↩]
- PJMand Monitoring Analytics, “Capacity Performance Initiative, cost benefit analysis,” October 23, 2014, https://www.pjm.com/~/media/committees-groups/committees/elc/postings/capacity-performance-cost-benefit-analysis.ashx [↩]
- Data on PJM’s Base Residual Auctions is available at http://www.pjm.com/markets-and-operations/rpm.aspx [↩]
- Results of PJM’s BRA for delivery year June 1, 2019 through May 31, 2020 can be found at http://www.pjm.com/~/media/markets-ops/rpm/rpm-auction-info/2019-2020-base-residual-auction-report.ashx
[↩] - Nameplate capacity, also referred to as installed or rated capacity, is the maximum potential power generation output of a piece of generation equipment.aspx [↩]
- The Seasonal Resources Problem Statement and Task Force information can be found on PJM’s website at http://www.pjm.com/committees-and-groups/task-forces/scrstf.aspx [↩]
- PJM,“Seasonal Resource Problem Statement,” March 15, 2016, http://www.pjm.com/~/media/committees-groups/task-forces/scrstf/postings/scrstf-problem-statement.ashx [↩]
