Tilting at Windmills: The Emerging U.S. Offshore Wind Energy Industry
America’s first offshore wind farm came online in 2016. Is this the dawn of a new domestic industry?
The First of Many Turbines
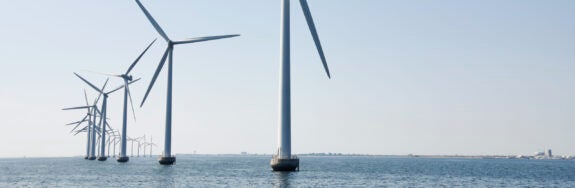
In the early morning hours of May 1, 2017, the tiny maritime hamlet of Block Island, Rhode Island experienced a complete loss of electrical power, accompanied by an unfamiliar silence. Roughly equidistant from mainland Rhode Island and Montauk, New York, Block Island had, for 80 years, exclusively relied upon diesel generators for electricity, burning nearly one million gallons of fuel annually (Dennis 2016). But this outage was different; it was a retirement. When power was restored, Block Island was, for the first time, connected to the mainland grid, and was the first location in the United States to have an operational offshore wind (“OSW”) farm (Shuman 2017).
Northern Europe: Turning Sea Breezes Into Sparks for Over Two Decades
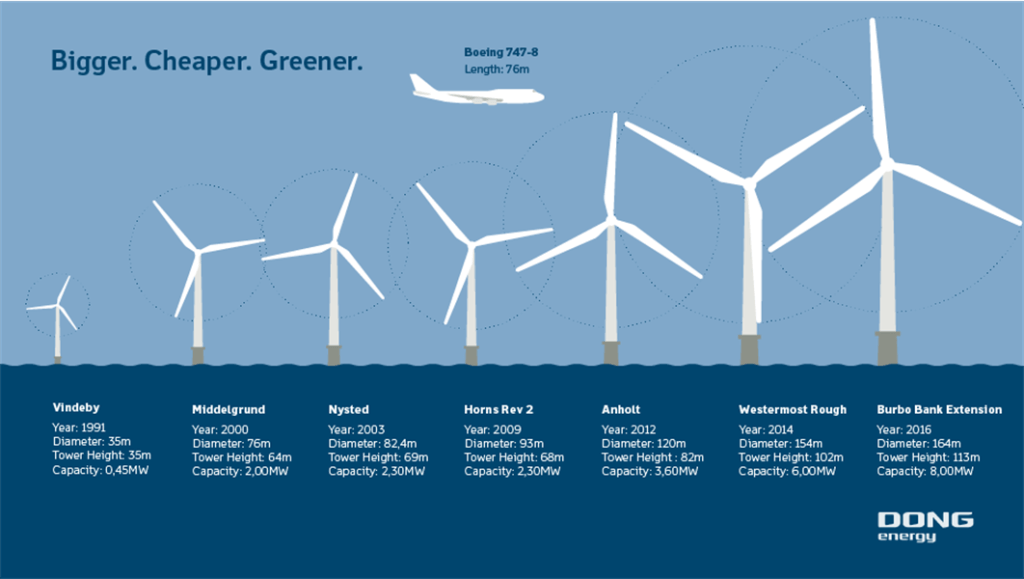
Electricity was first generated by wind in 1887 (Price 2005). Just over 100 years later, in 1991, the world’s first offshore wind turbines were deployed off Denmark’s coast. This Danish installation, an eleven-turbine array called the Vindeby Offshore Wind Farm, had a potential total capacity of 5 MW (powering approximately 2,200 homes), and produced 243 GWh of electricity over its 25-year lifetime (DONG Energy 2017c). By comparison, individual modern OSW turbines have capacities approaching 8 MW, and Figure 1 illustrates the substantial increase in turbine size over the past two decades. Hornsea Project One, under construction nearly 75 miles off of Yorkshire, United Kingdom, is slated for commissioning in 2020 and will have a potential total capacity of 1.2 GW (powering approximately one million U.K. homes) (DONG Energy 2017b and c). In 2016, the top three European OSW developers were Northland Power, DONG Energy, and Global Infrastructure Partners (Ho et al. 2017). Twelve countries1 now possess fully commissioned OSW capacity, while approximately 30 other countries have OSW projects in different phases of development (Kaldellis et al. 2016).
2015 was a particularly auspicious year for OSW in Europe, and saw the net addition of 3.0 GW of capacity generated by 754 individual turbines (Ho et al. 2016). This one-year OSW expansion represented 0.3% of the net generating capacity (1,030 GW) present in Europe at the end of 2015 (ENTSO-E 2016). Although overall worldwide investment in renewable energy projects declined by 18% in 2016, Bloomberg New Energy Finance identified OSW as the “brightest spot in the global clean energy investment picture in 2016,” with $30 billion in capital expenditures, a 41% increase relative to 2015 (Henze and Thomas 2017). As a result, by the end of 2016, 3,589 commissioned OSW turbines, with a total potential capacity of 12.6 GW, were operating in European waters (Ho et al. 2017). Recent successful zero-subsidy bids for two large projects in German waters, totaling 0.5 GW, imply a promising future for the European OSW industry (Reed 2017).
America’s Offshore Opportunity
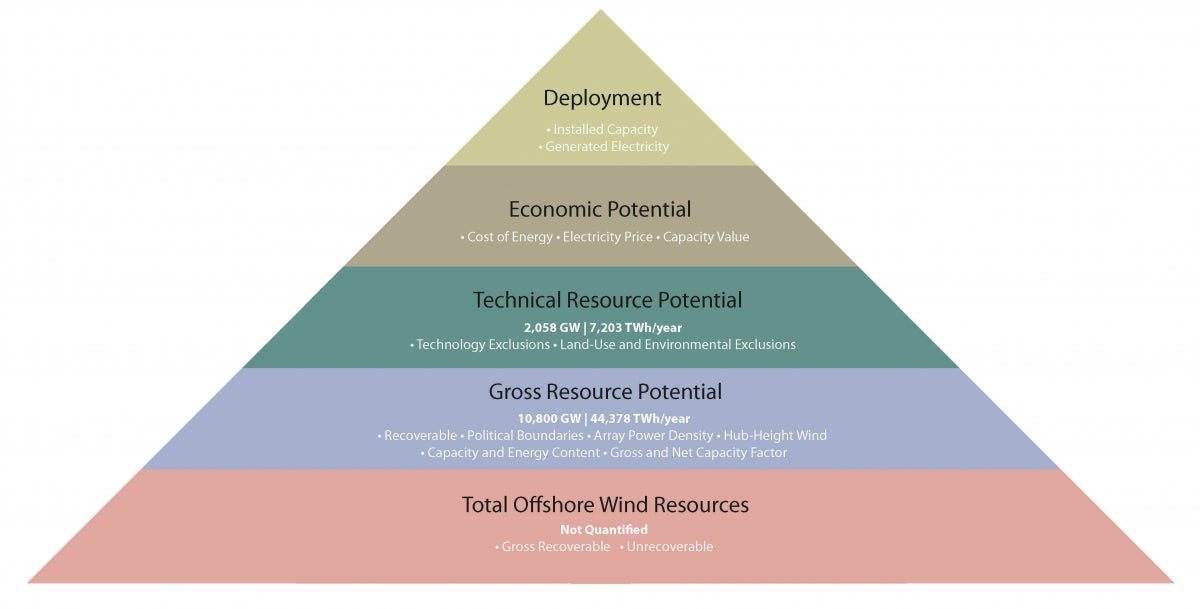
In 2016, the U.S. Department of Energy and U.S. Department of the Interior collaboratively produced the National Offshore Wind Strategy report. Figure 2 below, adapted from a similar diagram found in the DOE/DOI report, utilizes the nomenclature and classification system set forth in a 2016 technical report by the National Renewable Energy Laboratory (“NREL”) (Beiter and Musial 2016). The criteria employed in classifying the OSW resource are: geographic area, technology exclusions, array power density, environmental exclusions/competing use, turbine performance and losses, and economic viability.
The base of the Figure 2 pyramid represents OSW total resource potential, meaning the United States’ entire set of OSW resources (both recoverable and unrecoverable2 ). Moving from the base towards the peak of the pyramid, additional constraints are imposed, and the tiers of OSW resource classification progressively narrow in scope. OSW resources classified in tiers closer to the peak of the pyramid are subjected to all constraints identified in lower tiers. For example, OSW “economic potential” is the economically viable subset of the OSW “technical resource potential.” In turn, “technical resource potential” is the OSW recoverable with available technology after accounting for land-use and environmental siting exclusions, but this tier does not factor in economic limitations. The pyramid’s peak represents actual market deployment of OSW assets, and is determined by a commissioned OSW installation’s nameplate capacity and the quantum of electricity delivered by the array (Beiter and Musial 2016).
The 2016 National Offshore Wind Strategy report estimates the OSW gross resource potential (i.e. the tier just above the base of the Figure 2 pyramid) within the nation’s 200 nautical mile (“nm”) Exclusive Economic Zone boundary3 to be approximately 10,800 GW, which would generate 44,378,000 GWh per year, approximately eleven times the net electricity generated by all energy sources in the United States in 2015 (DOE/DOI 2016). This report assesses OSW technical resource potential as approximately 2,058 GW (generating 7,203,000 GWh per year) (DOE/DOI 2016).
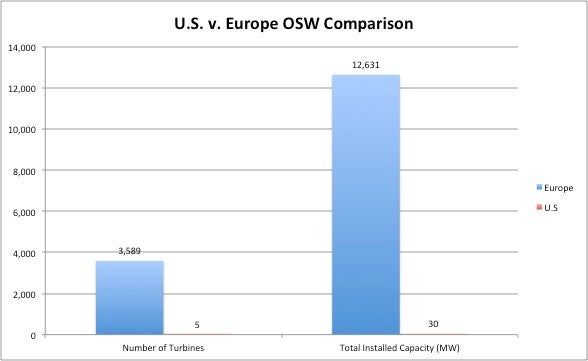
The American OSW industry remains in its infancy. As of 2016, the United States had 82.2 GW of total installed wind capacity nationwide, with only 0.03 GW contributed by OSW (i.e. Deepwater Wind’s Block Island Wind Farm) (AWEA 2017). Fourteen other states4 have OSW projects in various stages of the development process (BOEM 2017b). Figure 3 demonstrates the pronounced variance between the European and American OSW industries. One must acknowledge, however, that all European OSW installations reflected in Figure 3 received subsidies. As referenced previously, it was not until 2017 that successful bids were made for subsidy-free European OSW projects (Fairley 2017). A 2016 study observed that favorable regulatory environments, exemplified by the German OSW scheme5 , have aided EU expansion of offshore wind (Gonzalez and Lacal-Arantegui 2016).
The Cape Wind project, a 0.5 GW OSW array planned off of Cape Cod, encountered significant opposition (more than 20 lawsuits were filed) and remains unfinished (Bragg 2017). Though states exert considerable control over OSW development, the U.S. Bureau of Ocean Energy Management retains final approval of any energy installations beyond three nautical miles offshore (BOEM 2017a). Nonetheless, it appears that several East Coast states are now competing to lead the emerging domestic OSW industry.
Despite the challenges to Cape Wind, the state of Massachusetts seeks to add 1.6 GW of OSW capacity by 2027 (Cusick 2017). In New York, the Long Island Power Authority has granted preliminary approval to Deepwater Wind to build a 0.1 GW OSW farm (NYSERDA 2017). Maryland endeavors to become “a national leader in the burgeoning [U.S.] offshore wind industry,” by developing a robust supply chain employing small and minority-owned businesses, and by revitalizing and re-purposing existing port infrastructure (Maryland Public Service Commission 2017). Dominion Energy plans to construct two turbines off of Virginia Beach (Associated Press 2017). But the benefits of OSW are not exclusive to coastal areas. Cleveland, Ohio is betting on the growth of OSW in Lake Erie (Wagner 2017).
Further development of the U.S. OSW industry has the potential to:
- significantly advance domestic production of renewable energy
- support energy independence
- revitalize port cities, and
- create jobs in the construction, operations and maintenance, professional, and scientific sectors.
Cost: The Bottom Line
Historically, cost has been one of the principal objections to OSW. Though completed on time and within budget, the Block Island Wind Farm has been criticized as prohibitively expensive, with a starting electricity price of approximately $240/MWh ($0.24/kWh) (Dennis 2016). By comparison, the U.S. Energy Information Administration (“EIA”) calculated that, due to sustained low natural gas prices, nationwide wholesale electricity prices averaged $20 to $45 per MWh for much of 2016 (Hodge 2017). These low energy prices (relative to European prices) can be a roadblock to American OSW expansion (Shankleman and Parkin 2017).
Because wind energy arrays do not require continual fuel inputs, upfront expenditures for turbines, foundations, and electrical infrastructure constitute nearly 75% of total project costs (WindEurope 2016). For that reason, driving down construction costs is of paramount importance to improving OSW project economics (Delony 2016). OSW construction costs in Europe have fallen 46% over the last five years, with a 22% decline during 2016 alone (Shankleman and Parkin 2017). By mobilizing economies of scale, streamlining permitting processes, and through advanced engineering – such as caisson or “suction bucket”6 foundations – OSW project development timelines could be accelerated, ideally resulting in diminished overall costs. Like construction costs, European OSW operating costs are projected to decrease, and Figure 4 depicts this downward trend.
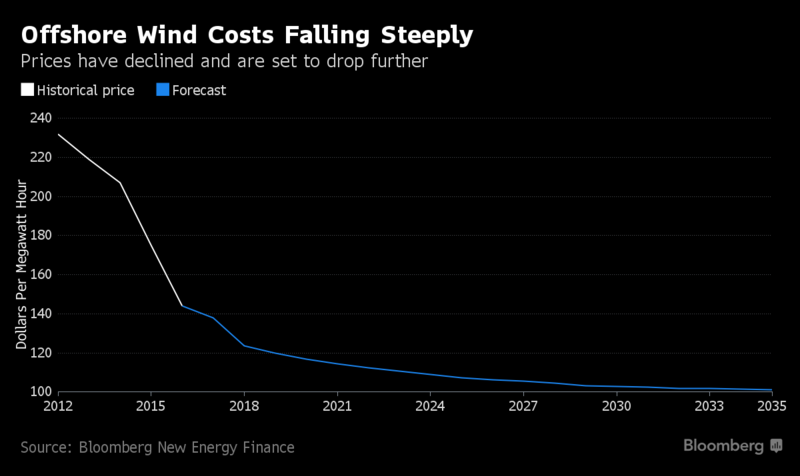
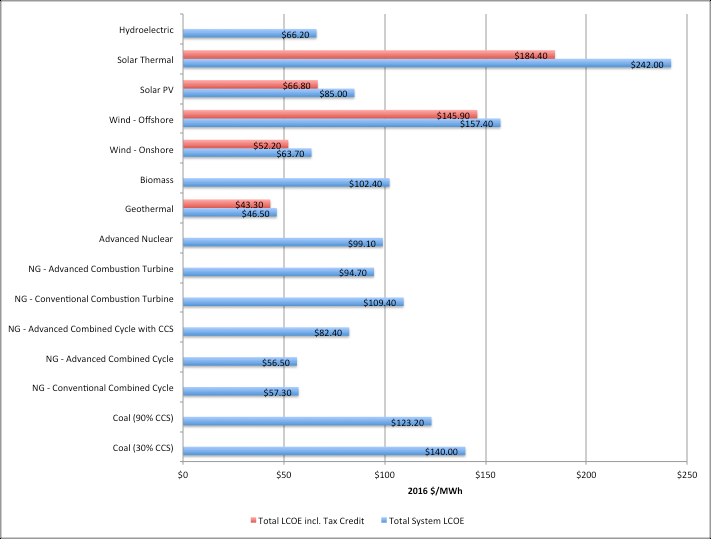
Figure 5 reflects the subsidized (red bars) and unsubsidized (blue bars) levelized cost of electricity (“LCOE”) for prevalent generation technologies, including OSW, as calculated by the EIA. OSW LCOE values are only slightly higher than coal-fired power plants utilizing 30% carbon capture and sequestration, but are markedly (i.e. two-thirds) higher than LCOE values for onshore wind installations (whether subsidized or not) and advanced and conventional natural gas combined cycle plants. Note that LCOE does not factor in transmission considerations or dispatchability (i.e. unlike unpredictable winds, the energy production of fossil fuel and nuclear plants can be controlled).
OSW resources are found in close proximity to many U.S. load centers. At present, more than 50% of Americans live within 50 miles of coastlines (DOE 2016). The 28 coastal states constitute nearly 80 percent of the U.S. total national electricity demand, and the load centers found in these regions pay some of highest electricity rates in the nation. The Atlantic, Gulf, and Pacific Coasts, as well as the Great Lakes and Hawaii, have all been identified as areas with OSW potential (DOE/DOI 2016).
By investing in OSW projects, coastal states can potentially circumvent a perennial dilemma: how to cost-effectively construct new onshore electricity transmission infrastructure to serve growing demand in densely populated urban areas and sprawling suburbs. Although electricity transmission infrastructure spending has seen a recent reversal of a decades-long downward trend7 , construction of onshore transmission remains costly, logistically challenging, and legally complex. Crowded load centers, like Southern California and the corridor between New York and Washington, D.C., often experience significant transmission congestion (DOE 2009). For load centers proximal to coasts, OSW could be one option for alleviating transmission constraints.
OSW development also presents other distinct advantages. First, relative to onshore wind, OSW is significantly stronger and more consistent, resulting in higher capacity factors8 (Small 2016). Turbine manufacturer Siemens estimates that the average European onshore wind turbine has a capacity factor of 24%, while the average European offshore turbine has a capacity factor of 41% (Siemens). Another case study from Denmark reached a similar conclusion (onshore: 24%; offshore: 42.6%) (Chabot).
From a temporal perspective, OSW is typically strongest during daylight hours (when electricity demand peaks), while onshore wind tends to be strongest at night (when demand is lower) (Hartman 2014). Thus, OSW generation could help offset the exceptionally high demand peaks experienced around 6:00 p.m. during summer months, which require grid operators to dispatch costly (and often inefficient) generation assets. This cyclical daily demand spike can be visualized using the EIA’s Electric System Operating Data tool (EIA 2017b).
Environmental Impacts
Wind turbine installations (both onshore and offshore) are frequently maligned for their adverse impact upon wildlife. The U.S. Fish and Wildlife Service estimates that collisions with wind turbines, unfortunately, cause approximately 174,000 bird deaths annually (FWS 2016). In comparison, each year domestic cats kill 2.4 billion birds; tall building collisions kill 303 million birds; and automobiles kill 200 million birds (FWS 2016). Innovative technologies, intended to reduce turbine-related avian mortality, are currently in development (Bryce 2016).
The overall potential impact of OSW turbines upon subsurface marine life, including fish, marine mammals, sharks, turtles, and crustaceans, is less well understood (Gill and Thomsen). Identified adverse effects of OSW include elevated noise and vibration levels, collision risk, habitat and food chain alteration, modification of natural sediment transport and deposition processes, and pollution generated by OSW construction, operations, maintenance, or decommissioning (Kaldellis et al. 2016).
However, any pollution attributable to OSW installations pales in comparison to pollution caused by incidents like the Exxon Valdez and Deepwater Horizon spills. To wit, according to NOAA’s Office of Response and Restoration, at least 44 oil spills exceeding 10,000 barrels (420,000 gallons) have occurred in U.S. waters since 1969 (NOAA 2017). Moreover, it has been observed that OSW turbine foundations can establish new marine habitats, and, although OSW installations can impact marine shipping and radar operation, the fishing exclusion zones around OSW farms can result in expanding marine populations (Rawson and Rogers 2015).
Opposition
American OSW installations, like other power plants, have been the target of localized NIMBYism9 concerns (Schlossberg 2016). Opponents typically contend that OSW turbines visible from shore impede seaside views, diminish property values, and may adversely impact tourism, a major revenue source for many coastal communities (Siegel 2017). The Cape Wind project experienced particularly fierce opposition from Cape Cod and Nantucket merchants and residents, including Mitt Romney and the late Senator Ted Kennedy (Neal 2003). In 2017, Rep. Andy Harris (R-Md.) pushed through an amendment denying federal funding to any Maryland OSW installations less than 24 nautical miles from shore, effectively killing one of two projects already approved by the Maryland Public Service Commission (Siegel 2017).
Jobs, Jobs, and More Jobs
Expanding OSW development has the potential to create American jobs. The U.S. Department of Energy reported that the wind energy sector employed 101,738 people in 2016, a 32% increase relative to 2015 (DOE 2017). In fact, the U.S. Department of Labor forecasts that employment of wind turbine service technicians will grow “108 percent from 2014 to 2024, much faster than the average for all [U.S.] occupations” (DOL 2015). Note that these statistics do not distinguish between onshore and offshore wind jobs.
In a June 12, 2017 statement, Secretary of Labor R. Alexander Acosta extolled the virtues of expanding apprenticeship programs (The White House 2017). The apprenticeship model could be well suited to the creation of a new domestic OSW industry comprised of highly specialized construction, operations, and maintenance jobs. Perhaps as a sign of things to come, wind companies in Wyoming recently offered free training to fossil fuel workers interested in becoming turbine technicians (Richards 2017).
In light of the Wyoming example, OSW expansion could reduce employment in other energy sectors. Thus, OSW’s net employment impact depends on the degree to which OSW is more or less labor-intensive than alternatives. For instance, the turbine manufacturing and installation phases of OSW projects tend to be considerably more labor-intensive than the operations and maintenance phase (Tegen et al. 2015).
Still, expanding OSW development could drive revitalization of now-dilapidated U.S. ports, which have been ravaged by the increasingly constricted commercial fishing industry, among other factors (Storrow 2017). Improvements to port infrastructure, which are necessary to handle the immense size of OSW turbine components, could provide construction jobs. Upon the completion of port refurbishing, specialized dockworkers would be required to load and unload the massive turbine components.
Finally, OSW development could provide opportunities for research and development. Advancing offshore turbine and foundation design requires engineers in the mechanical, electrical, and geotechnical specialties. Assessment of the seafloor environment, meteorological conditions, and ecological impacts calls for geologists, meteorologists, oceanographers, marine biologists, and other individuals in specialized scientific disciplines. Aircraft pilots and ship captains would have the unending task of shuttling people to and from OSW arrays. In short, assuming OSW costs continue to decline as projected, there could be a seat (and a job) for those from all walks of life at the OSW table.
Tilting at Windmills
Like the Spaniard Don Quixote, who charged windmills he mistook for giants with “arms well-nigh two leagues in length,” opposition to American offshore wind, frequently based upon turbine visibility from shore, could be viewed as efforts against an imagined adversary. Though high cost remains a concern, Europe is on the verge of demonstrating that unsubsidized utility-scale offshore wind is achievable. This crucial renewable energy technology must now migrate across the Atlantic. Developing the United States’ offshore wind sector presents a chance to forge a new domestic industry providing locally produced clean energy. The only remaining question is whether America will capitalize upon this energy opportunity.

Brandon Burke
Policy Director, Business Network for Offshore WindBrandon Burke is a former graduate research assistant at the Kleinman Center and an attorney and Policy and Outreach Dire. He graduated from the University of Pennsylvania’s Master of Environmental Studies program, with a Certificate in Energy Management
4C Offshore. “Offshore Wind Farms.” Accessed August 19, 2017, http://www.4coffshore.com/windfarms/.
4C Offshore. 2016. “Suction Bucket Or Caisson Foundations.” Last modified January 7, accessed August 19, 2017, http://www.4coffshore.com/windfarms/suction-bucket-or-caisson-foundation….
American Wind Energy Association. 2017. “Wind Energy Facts at a Glance.” Accessed August 19, 2017, http://www.awea.org/wind-energy-facts-at-a-glance.
Aniti, Lori. 2014. “Investment in Electricity Transmission Infrastructure shows Steady Increase.” U.S. Energy Information Administration, last modified August 26, accessed August 19, 2017, https://www.eia.gov/todayinenergy/detail.php?id=17711.
Associated Press. 2017. “Dominion Proceeding with Wind Turbines Off Virginia Coast.” U.S. News & World Report, July 10, https://www.usnews.com/news/best-states/virginia/articles/2017-07-10/dom….
Bailey, Helen, Kate L. Brookes, and Paul M. Thompson. 2014. “Assessing Environmental Impacts of Offshore Wind Farms: Lessons Learned and Recommendations for the Future.” Aquatic Biosystems 10: 8.
Beiter, Philipp and Walt Musial. 2016. Terminology Guideline for Classifying Offshore Wind Energy Resources, https://www.nrel.gov/docs/fy16osti/65431.pdf.
Bragg, Mary Ann. 2017. “Cape Wind project review to be revised.” Cape Cod Times, March 30, http://www.capecodtimes.com/news/20170330/cape-wind-project-review-to-be….
Bryce, Emma. 2016. “Will Wind Turbines Ever be Safe for Birds?” National Audubon Society, last modified March 16, accessed August 19, 2017, http://www.audubon.org/news/will-wind-turbines-ever-be-safe-birds.
Bureau of Ocean Energy Management. 2017a. “Federal Offshore Lands.” Accessed August 19, 2017, https://www.boem.gov/Federal-Offshore-Lands/.
Bureau of Ocean Energy Management. 2017b. “Lease and Grant Information.” Accessed August 19, 2017, https://www.boem.gov/Renewable-Energy-Program/Lease-and-Grant-Informatio….
Cape Wind. 2017. “Cape Wind Project Overview.” Accessed August 26, 2017, http://www.capewind.org/what/overview.
Chabot, Bernard. Onshore and Offshore Wind Power Capacity Factors: How Much they Differ Now and in the Future? https://www.erneuerbareenergien.de/files/smfiledata/3/1/7/2/7/1/V2BC37Nh….
Collins, David. 2017. “Ocean City Officials Say Wind Turbines Too Close to Coast an Eyesore.” WBALTV11, last modified July 13, accessed August 19, 2017, http://www.wbaltv.com/article/ocean-city-officials-say-wind-turbines-too….
Cusick, Daniel. 2017. “Mass. Vies for Lead in Offshore Wind Production.” E&E News, June 30, https://www.eenews.net/climatewire/stories/1060056857.
Davis, Julie. 2017. “Trump Turns to Manufacturing Executives to Help Develop Jobs Plans.” The New York Times, February 23, https://www.nytimes.com/2017/02/23/us/politics/trump-manufacturing.html.
Deepwater Wind. “Block Island Wind Farm.” http://dwwind.com/project/block-island-wind-farm/.
Deepwater Wind. 2016. “America’s First Offshore Wind Farm Powers Up.” Last modified December 12, accessed August 19, 2017, http://dwwind.com/press/americas-first-offshore-wind-farm-powers/.
Delony, Jennifer. 2016. “Foundation First: Designing Offshore Wind Turbine Substructures for Maximum Cost Reduction.” Renewable Energy World, last modified December 21, accessed August 19, 2017, http://www.renewableenergyworld.com/articles/print/volume-19/issue-10/fe….
Dennis, Brady. 2016. “The Nation’s First Offshore Wind Farm is Ready to Go, Despite Critics’ Blowback.” The Washington Post, August 27. http://www.washingtonpost.com/national/health-science/the-nations-first-….
DONG Energy. “About Hornsea Project One.” Accessed August 19, 2017, http://www.hornseaprojectone.co.uk/en/about-hornsea-project-one.
DONG Energy. 2017a. “DONG Energy Awarded Three German Offshore Wind Projects.” Last modified April 13, http://www.dongenergy.com/en/media/newsroom/company-announcements-detail….
DONG Energy. 2017b. “Hornsea Project One Technical Description.” Accessed August 19, 2017, http://www.hornseaprojectone.co.uk/en/about-hornsea-project-one/technica….
DONG Energy. 2017c. “The World’s First Offshore Wind Farm is Retiring.” Last modified March 15, accessed August 19, 2017, http://www.dongenergy.com/en/media/newsroom/news/articles/the-worlds-fir….
ENTSO-E AISBL. 2016. Electricity in Europe 2015. https://www.entsoe.eu/Documents/Publications/Statistics/electricity_in_e…. Brussels, Belgium.
Ervin, Dan. 2016. “The Problem with Off-Shore Wind Energy.” The Hill, last modified September 23, accessed August 19, 2017, http://thehill.com/blogs/congress-blog/energy-environment/297456-the-pro….
Fairley, Peter. 2017. “For the First Time, Offshore Wind Power Will be Profitable without Subsidies.” IEEE Spectrum, June 26.
Froese, Michelle. 2016. “DONG Energy Hits Milestone with 1,000 Wind Turbines at Sea.” Windpower Engineering & Development, October 25.
Gill, Andrew and Frank Thomsen. Effects of Offshore Wind Farms on Marine Mammals and Fish – the European Experience, http://seagrant.gso.uri.edu/oceansamp/pdf/presentation/present_gill_euro…
Gonzalez, Javier Serrano and Roberto Lacal-Arantegui. 2016. “A Review of Regulatory Framework for Wind Energy in European Union Countries: Current State and Expected Developments.” Renewable & Sustainable Energy Reviews 56: 588-602. doi:10.1016/j.rser.2015.11.091. https://doi.org/10.1016/j.rser.2015.11.091.
Hartman, Liz. 2014. Top 10 Things You Didn’t Know about Offshore Wind Energy. https://energy.gov/eere/wind/articles/top-10-things-you-didn-t-know-abou…
Henze, Veronika and Catrin Thomas. 2017. “Record $30bn Year for Offshore Wind but overall Investment Down.” Bloomberg New Energy Finance. https://about.bnef.com/blog/record-30bn-year-offshore-wind-overall-inves….
Ho, Andrew, Ariola Mbistrova, Giorgio Corbetta, Ivan Pineda, and Kristian Ruby. 2016. The European Offshore Wind Industry – Key Trends and Statistics 2015. Brussels, Belgium.
Ho, Andrew, Ariola Mbistrova, Ivan Pindea, and Pierre Tardieu. 2017. The European Offshore Wind Industry – Key Trends and Statistics 2016. Brussels, Belgium.
Hodge, Tyler. 2017. “Wholesale Power Prices in 2016 Fell, Reflecting Lower Natural Gas Prices.” U.S. Energy Information Administration, last modified January 11, accessed August 19, 2017, https://www.eia.gov/todayinenergy/detail.php?id=29512.
Kaldellis, J. K., D. Apostolou, M. Kapsali, and E. Kondili. 2016. “Environmental and Social Footprint of Offshore Wind Energy. Comparison with Onshore Counterpart.” Renewable Energy 92: 543-556. doi:10.1016/j.renene.2016.02.018.
Kilgus, Stefan and Christine Bader. 2016. “Germany’s Offshore Tender System.” Project Finance International, December 14, http://www.wfw.com/wp-content/uploads/2017/01/Germanys-offshore-wind-ten…
Lazard. 2016. Lazard’s Levelized Cost of Energy Analysis – Version 10.0. https://www.lazard.com/media/438038/levelized-cost-of-energy-v100.pdf.
Lopez, Anthony, Billy Roberts, Donna Heimiller, Nate Blair, and Gian Porro. 2012. U.S. Renewable Energy Technical Potentials: A GIS-Based Analysis. doi:10.2172/1047328. https://www.nrel.gov/docs/fy12osti/51946.pdf.
McKenna, Phil. 2017. “Wind Power Replaces Block Island’s Diesel Addiction.” ecoRI News, last modified May 4, accessed August 19, 2017, http://www.ecori.org/renewable-energy/2017/5/3/wind-power-knocks-out-blo….
National Aeronautics and Space Administration, Earth Observatory. 2016. “Offshore Wind Farms make Wakes.” Last modified November 8, accessed August 19, 2017, https://earthobservatory.nasa.gov/IOTD/view.php?id=89063.
National Oceanic and Atmospheric Administration, Office of Coast Survey. 2013. “U.S. Maritime Limits & Boundaries.” Last modified September 13, accessed August 19, 2017, https://www.nauticalcharts.noaa.gov/csdl/mbound.htm.
National Ocean and Atmospheric Administration, Office of Response and Restoration. 2017. “Largest Oil Spills Affecting U.S. Waters since 1969.” Last modified August 21, accessed August 21, 2017, https://response.restoration.noaa.gov/oil-and-chemical-spills/oil-spills….
Neal, Rome. 2003. “Storm Over Mass. Windmill Plan.” CBS, June 26, https://www.cbsnews.com/news/storm-over-mass-windmill-plan/.
New York State Energy Research and Development Authority. 2017. “Governor Cuomo Announces Approval of Largest Offshore Wind Project in the Nation.” Last modified January 25, accessed August 19, 2017, https://www.nyserda.ny.gov/About/Newsroom/2017-Announcements/2017-01-25-….
Price, Trevor J. 2005. “James Blyth – Britain’s First Modern Wind Power Pioneer.” Wind Engineering 29 (3): 191-200. doi:10.1260/030952405774354921. http://www.jstor.org/stable/43750225.
Public Service Commission of Maryland. 2017. Order No. 88192 in the Matter of the Applications of U.S. Wind, Inc. and Skipjack Offshore Energy, LLC for a Proposed Offshore Wind Project(s) Pursuant to the Maryland Offshore Wind Energy Act of 2013. http://www.psc.state.md.us/wp-content/uploads/Order-No.-88192-Case-No.-9…
Rawson, Andrew and Edward Rogers. 2015. “Assessing the Impacts to Vessel Traffic from Offshore Wind Farms in the Thames Estuary.” Scientific Journals of the Maritime University of Szczecin 43 (115): 99-107. https://www.google.com/url?sa=t&rct=j&q=&esrc=s&source=web&cd=2&cad=rja&….
Reed, Stanley. 2017. “Germany Strikes Offshore Wind Deals, Subsidy Not Included.” New York Times, Apr 15, https://www.nytimes.com/2017/04/14/business/energy-environment/offshore-….
Richards, Heather. 2017. “Wind Manufacturer Offers Job Training in Oil City, Next Stop Coal Country.” Casper Star Tribune, July 12, http://trib.com/business/energy/wind-manufacturer-offers-job-training-in….
Schlossberg, Tatiana. 2016. “America’s First Offshore Wind Farm Spins to Life.” The New York Times, December 14, https://www.nytimes.com/2016/12/14/science/wind-power-block-island.html.
Shankleman, Jess and Brian Parkin. 2017. “Wind Power Blows through Nuclear, Coal as Costs Drop at Sea.” Bloomberg, March 8, https://www.bloomberg.com/news/articles/2017-03-09/wind-power-blows-thro….
Shuman, Cassius. 2017. “Island Operating on Wind Farm Power.” The Block Island Times, May 1, http://www.blockislandtimes.com/article/island-operating-wind-farm-power….
Siegel, Rachel. 2017. “Rep. And Harris erects new obstacle in path of Md. Wind-farm projects.” The Washington Post, July 22, https://www.washingtonpost.com/local/md-politics/rep-andy-harris-erects-….
Siemens. “Wind Energy Statistics and Targets.” Accessed August 19, 2017, https://www.siemens.com/press/pool/de/feature/2014/energy/2014-03-hull/f….
Small, Laura. 2016. “Fact Sheet: Offshore Wind – can the United States Catch Up with Europe?” Environmental and Energy Study Institute, last modified January 4, accessed August 19, 2017, http://www.eesi.org/papers/view/factsheet-offshore-wind-2016.
Storrow, Benjamin. 2017. “Can Offshore Wind Power Revive U.S. Ports?” Scientific American, June 19.
Tegen, S., D. Keyser, F. Flores-Espino, J. Miles, D. Zammit, and D. Loomis. 2015. Offshore Wind Jobs and Economic Development Impacts in the United States: Four Regional Scenarios. https://www.nrel.gov/docs/fy15osti/61315.pdf.
The White House, Office of the Press Secretary. 2017. “Press Briefing by Press Secretary Sean Spicer and Secretary of Labor Alex Acosta, 6/12/2017, #54.” Last modified June 12, accessed August 19, 2017, https://www.whitehouse.gov/the-press-office/2017/06/12/press-briefing-pr….
U.S. Department of Energy. 2009. National Electric Transmission Congestion Study. https://energy.gov/sites/prod/files/Congestion_Study_2009.pdf.
U.S. Department of Energy. 2015. National Electric Transmission Congestion Study. https://www.energy.gov/oe/services/electricity-policy-coordination-and-i….
U.S. Department of Energy. 2016. “Energy Department Announces Investment in Wave Energy Test Facility.” Last modified December 21, accessed August 19, 2017, https://energy.gov/articles/energy-department-announces-investment-wave-….
U.S. Department of Energy. 2017. U.S. Energy and Employment Report. https://energy.gov/sites/prod/files/2017/01/f34/2017%20US%20Energy%20and….
U.S. Department of Energy & U.S. Department of the Interior. 2016. National Offshore Wind Strategy. https://energy.gov/sites/prod/files/2016/09/f33/National-Offshore-Wind-S….
U.S. Department of Labor. 2015. “Wind Turbine Technicians.” Occupational Outlook Handbook., last modified December 17, accessed August 21, 2017, https://www.bls.gov/ooh/installation-maintenance-and-repair/wind-turbine….
U.S. Energy Information Administration. 2011. “Demand for electricity changes through the day.” Last modified April 6, accessed August 19, 2017, https://www.eia.gov/todayinenergy/detail.php?id=830.
U.S. Energy Information Administration. 2015. “Total Electric Power Industry Summary Statistics, 2015 and 2014.” Accessed August 19, 2017, https://www.eia.gov/electricity/annual/html/epa_01_01.html.
U.S. Energy Information Administration. 2017a. Levelized Cost and Levelized Avoided Cost of New Generation Resources in the Annual Energy Outlook 2017. https://www.eia.gov/outlooks/aeo/pdf/electricity_generation.pdf.
U.S. Energy Information Administration. 2017b. U.S. Electric System Operating Data. https://www.eia.gov/beta/realtime_grid/#/data/graphs?end=20170705T00&sta….
U.S. Fish & Wildlife Service. 2016. “Threats to Birds.” Last modified May 25, accessed August 19, 2017, https://www.fws.gov/birds/bird-enthusiasts/threats-to-birds.php.
U.S. Nuclear Regulatory Commission. 2017. “Capacity Factor (net).” Last modified April 10, accessed August 19, 2017, https://www.nrc.gov/reading-rm/basic-ref/glossary/capacity-factor-net.html.
Wagner, Lorry. “Offshore Wind Taking Cleveland Back to the Future.” Renewable Energy World., last modified July 13, accessed August 19, 2017, http://www.renewableenergyworld.com/articles/2017/07/offshore-wind-takin….
WindEurope. 2016. “Wind Energy is Competitive.” Last modified March 21, accessed August 19, 2017, https://windeurope.org/policy/topics/economics/.
- Belgium, China, Denmark, France, Germany, Japan, Netherlands, South Korea, Sweden, Taiwan, United Kingdom, and United States. [↩]
- In this context, “unrecoverable” offshore wind includes high altitude wind, high seas wind (greater than 200 nm offshore), and wind near Alaska, which is far from load centers (Beiter and Musial 2016). [↩]
- In accordance with the articles of the United Nations Convention on the Law of the Sea (“UNCLOS”), U.S. maritime waters are divided into several categories. Measured from the coastal low-water baseline, they are delineated as the “territorial sea” (offshore waters extending up to 12 nautical miles from the low-water baseline); “contiguous zone” (extending 24 nm); and “exclusive economic zone” (extending 200 nm) (NOAA 2013). Waters beyond 200 nm from the coastal low-water baseline are considered “high seas” (Beiter and Musial 2016). Pursuant to the Submerged Lands Act of 1953, 43 U.S.C. § 1301 et seq., individual U.S. states have rights to natural resources found within 3 nautical miles of the coast (BOEM 2017a). [↩]
- California, Delaware, Florida, Georgia, Hawaii, Maine, Maryland, Massachusetts, New Jersey, New York, North Carolina, Oregon, South Carolina, and Virginia. [↩]
- The German Offshore Wind Act is a part of Germany’s broader Renewable Energy Act (EEG 2017), which provides for technology-specific (including OSW-specific) energy auctions aimed at driving down the cost of electricity generated by OSW and other renewable generation methods (Kilgus and Bader 2016). [↩]
- A caisson, or “suction bucket,” is a large inverted bucket-shaped foundation that is lowered to the seafloor. Water is then pumped out of the bucket structure, creating negative pressure, which drives the foundation into the seabed. This process is often quicker than traditional driven pile foundations (4C Offshore 2016). [↩]
- Electricity transmission infrastructure spending increased from $2.7 billion in 1997 to $14.1 billion in 2012 (Aniti 2014). [↩]
- The National Renewable Energy Laboratory defines capacity factor as “the ratio of the system’s predicted electrical output in the first year of operation to the nameplate output” (NRC 2017). [↩]
- “Not In My Backyard” [↩]
