Residential Battery Storage: Reshaping the Way We Do Electricity
The number of homeowners that buy energy storage is skyrocketing, but installations are often not profitable. Explore why individuals still buy batteries, for which households they are useful, and how valuing greenness helped this technology grow.
At a Glance
Key Challenge
Many households invest in battery storage, even though it is often not profitable. Why is that and how do those residential batteries change electricity tariffs in the future?
Policy Insight
Batteries can help households with solar panels to increase solar consumption. Households with a high valuation for self-generated solar adopt batteries earlier.
Why Some Households Started Buying Expensive Batteries
Homeowners have only started installing battery storage in addition to their solar panel installations since 2015/16, but the number of installations is skyrocketing, especially in some European countries (see Figure 1). Fueled by high energy prices, sustainability concerns, and decreasing battery costs, today, the majority of households in Germany that get solar also co-install a battery.

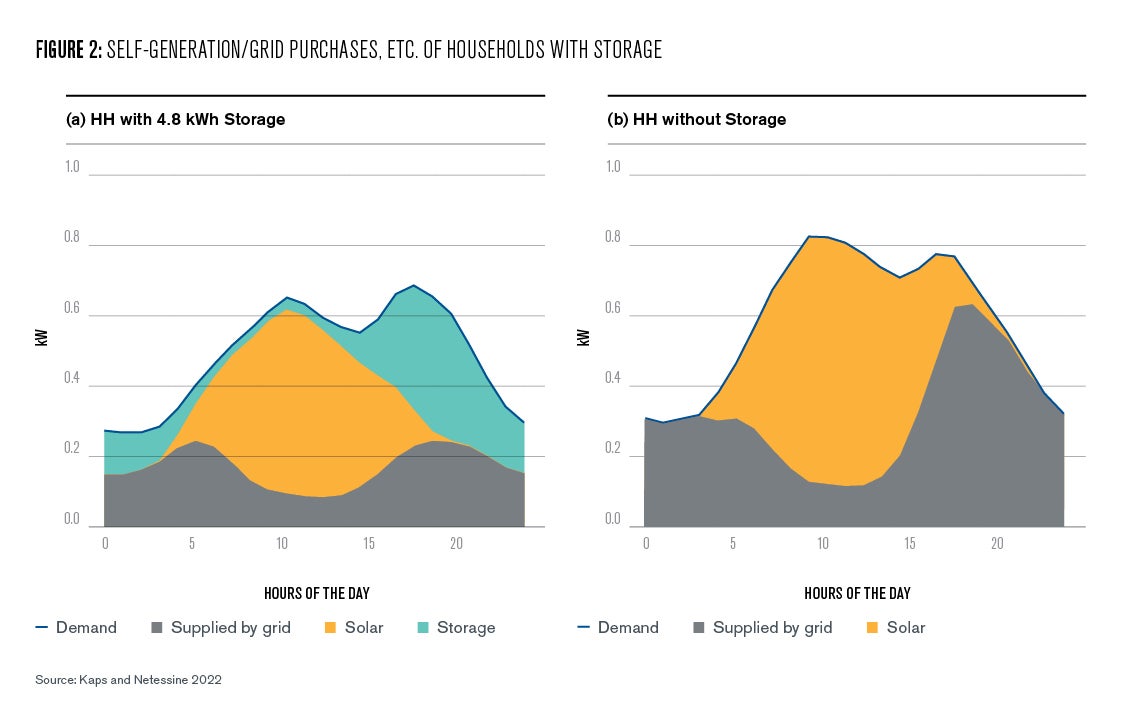
The promise of batteries is simple: whenever your solar panels produce more energy than you need (say on a sunny afternoon), rather than selling the excess energy back to the utility company1, a battery allows you to store that power. Then, when the sun goes down and you require more electricity than the panels generate, you can discharge the battery and avoid buying from the grid until the charge is depleted.
This way, a household with storage can increase the share of renewable power it consumes (Figure 2), but more importantly, also save money. Figure 2 juxtaposes which electricity sources are used to meet a household’s electricity demand by comparing two types of households in our dataset— a) the average household with 4.8 kWh2 of storage3 against b) the average household without storage.
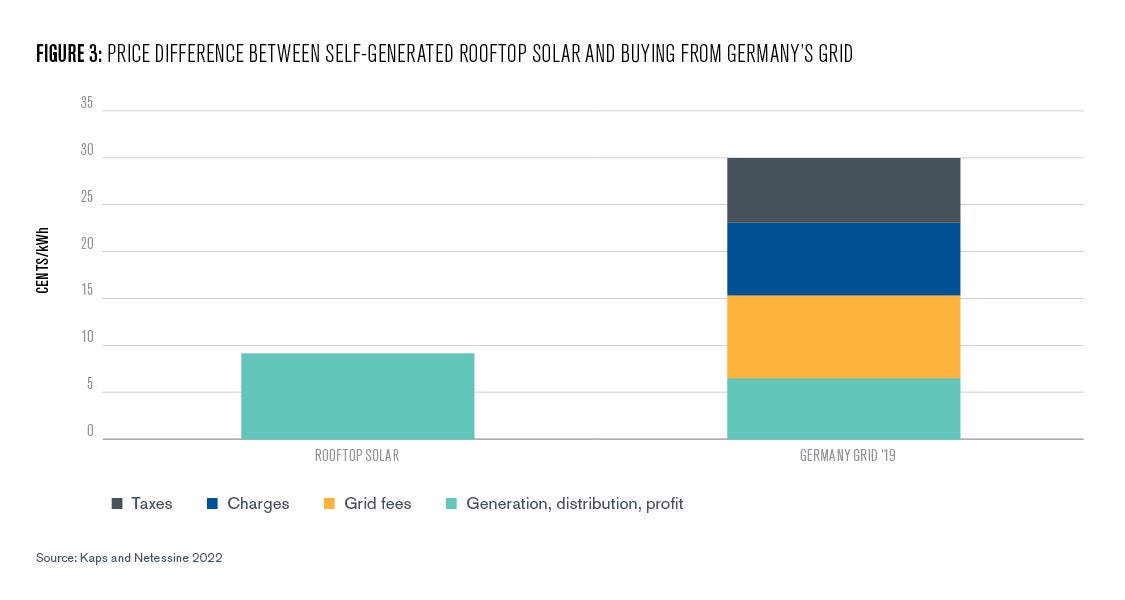
In theory, rather than paying the electricity price to the utility (which includes network and distribution charges, taxes, and other fees), the battery uses one’s own cheaper solar power. See Figure 3 for an example that illustrates the price difference between self-generated solar power (panel price, installation, maintenance), compared to the electricity price paid in 2019 in Germany.
In practice, however, while batteries do save money with every charging/discharging cycle, they are not free. Even though lithium-ion prices (the most commonly used battery technology as of 2023) have come down substantially over the years, a kilowatt-hour (kWh) of storage can still cost close to 1,000 euros4. So, hypothetically, if every battery cycle saves a household 15 cents (electricity price of 25 cents minus self-generation cost of solar power of 10 cents), one would need to use the battery for 6,667 cycles before it turns a profit. That comes down to over 25 years if you fully charge and discharge your battery every day.
In our data set, where households use 45% of battery capacity on average in a day, those 6,667 cycles would take almost 56 years to achieve. This is longer than the 10–15 years most batteries are forecasted to last (under warranty), and neither takes into account time-discounting (you pay upfront, but reap the benefits over decades), maintenance, or battery degradation. And, mind you, households that bought batteries in 2018 had to pay more for their batteries than our current-day example, making their investment even more unprofitable—or it may seem.
Some Households Value Greenness
Yet, between 2018 and 2020, in Germany alone, 150,000 new storage installations were built, storing 1.3 million kWh of energy and costing on the order of two billion euros5. So why are these households buying storage? After all, Germans are not known for simply burning money. To find out what is happening, we partnered with Solarwatt, a Dresden-based manufacturer and installer of solar panels that added storage to its offering in 2015.
The company provided us with data of thousands of their customers6 that installed solar and storage between 2018 and 2020—the majority of which are German households. Anecdotally, households quote two key reasons when asked why they bought storage: 1) the increased solar consumption share and 2) the increased independence from the utility (called autarky).
We call this desire to be more sustainable and less reliant on the grid-provider greenness valuation and aim to quantify it with the data provided by Solarwatt—in other words, to understand how much households value using their own solar power, beyond its financial benefit, to justify their storage investment.
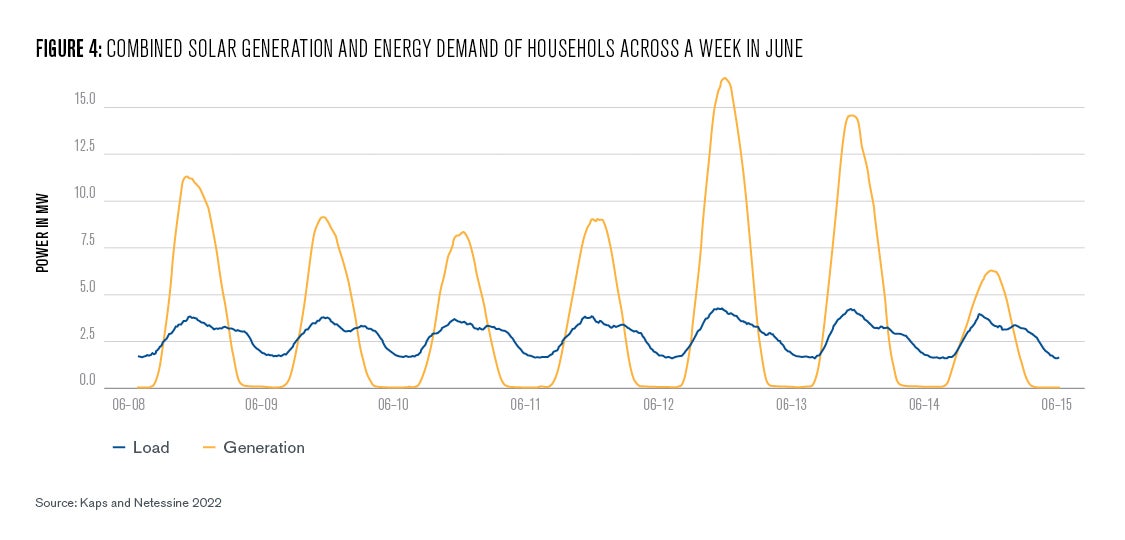
For each household, we observe how much solar and battery capacity they have, and we also see the actual solar generation and energy demand every 15 minutes for the years 2018–2020 (see Figure 4 for a plot of a week of the households’ combined energy demand and solar generation). Additionally, we know the technology costs and electricity prices in Germany, as well as the federal subsidies for solar and batteries. We combine all the data to understand a) how households use electricity across the day, b) how high their greenness valuation is, and c) how the existence of storage will change the energy provision of the future.
Inferring Greenness Valuation from Household Behavior
Conceptually, there are three steps to our approach, which we apply for each household individually (for a more rigorous explanation of the model, please refer to the research paper):
In the first step, we use the demand and solar generation data to learn about the household’s consumption preferences across the day, because the timing of electricity has a big impact on the usefulness of storage. Similarly, learning the solar generation patterns of a household is important as it, too, impacts the storage operations—the location of the building, the orientation of the roof, the angle of the panels, and even the presence of trees all add to that characteristic.
In a second step, we investigate the financial aspects of electricity consumption—how much a household pays its grid provider every month, how much money it receives selling energy back to the grid, and the solar and storage installation costs.
In a third step, we make assumptions about the households. In particular, we assume that households make the optimal investment decisions (i.e., they know the electricity price, subsidies, and the costs of panels and batteries, as well as their own preferences), and, based on that knowledge, choose the amount of solar panels and the number of battery modules that suit it best.
The idea here is that batteries are bought in modules (imagine a microwave-sized battery that contains 2.4 kWh or about two to three hours of energy storage), and each such module costs approximately $2,000. We assume that the households consciously choose whether they want e.g., 0, 1, 2, or 5 such modules and don’t just randomly select a number.
Lastly, we assume that the households consume electricity knowing that they have solar and storage installed but without checking the energy production/storage in real time. In other words, households do not first check the storage charge in their battery before deciding whether or not to turn on their computer or air conditioning.
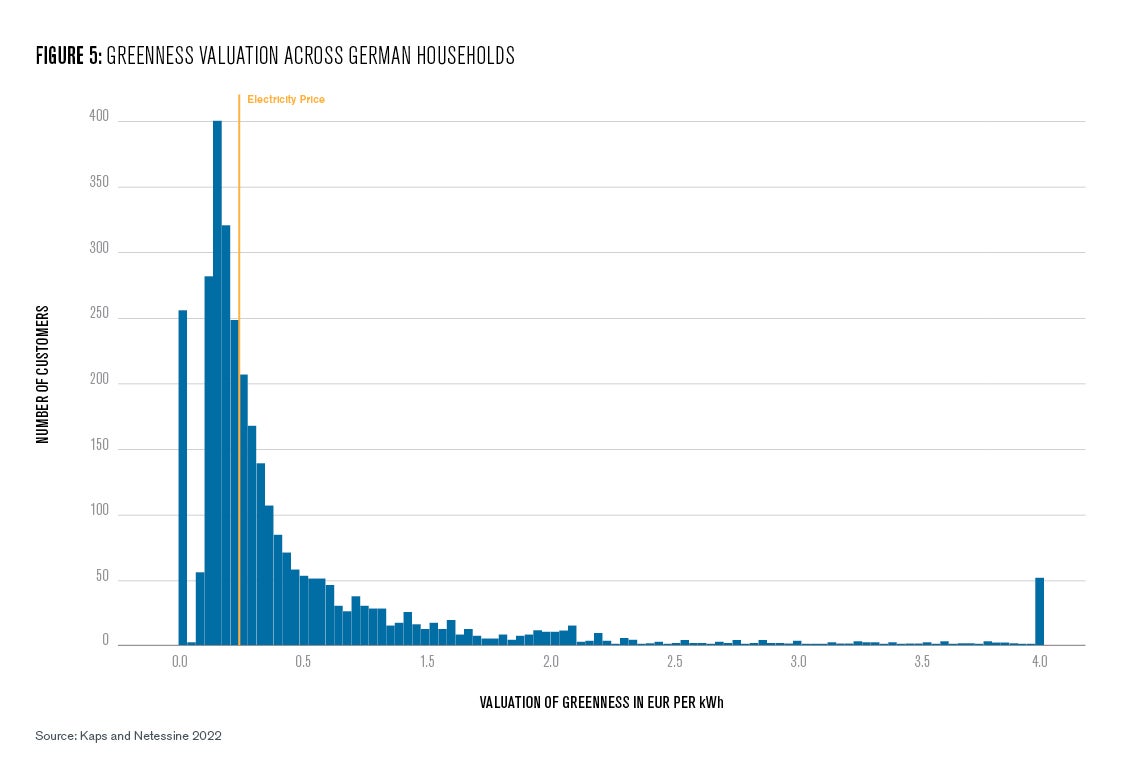
Using this approach, we obtain the greenness valuation (Figure 5) and hourly consumption preferences for each household. We discuss the main insights from our results in the following three segments.
Sustainable, Mission-Driven Entrepreneurship Takeaway
As Figure 5 shows, the German households in our data set have a substantial greenness valuation with a median of €0.29. This is important, because it quantifies the greenness valuation in the population and carries with it a clear message: a company in the sustainable technology space can leverage buyers willing to pay more for a green product and scale the business before its technology reaches price-parity. Of course, households in our data set are a particularly green subset of the German population, but it is exactly this “green audience” that is most likely to be the early customers for a new a product in the sustainability space. With these early customers, a firm can improve its product, scale its infrastructure, and mature its business offering. And identifying this group could translate into customer for other possible sustainable offerings, such as recycling services, heat pumps, or synthetic fuels.
Note that we have no households with positive but small (less than five cents per kWh) greenness valuations in Figure 57. That is not because these households don’t exist, but merely because they would not have purchased storage at 2018–2020 prices. Presumably, many more customers in this space of low-but-positive greenness valuation will start adopting batteries, as electricity prices increase or once the technology gets cheaper.
Household Takeaway
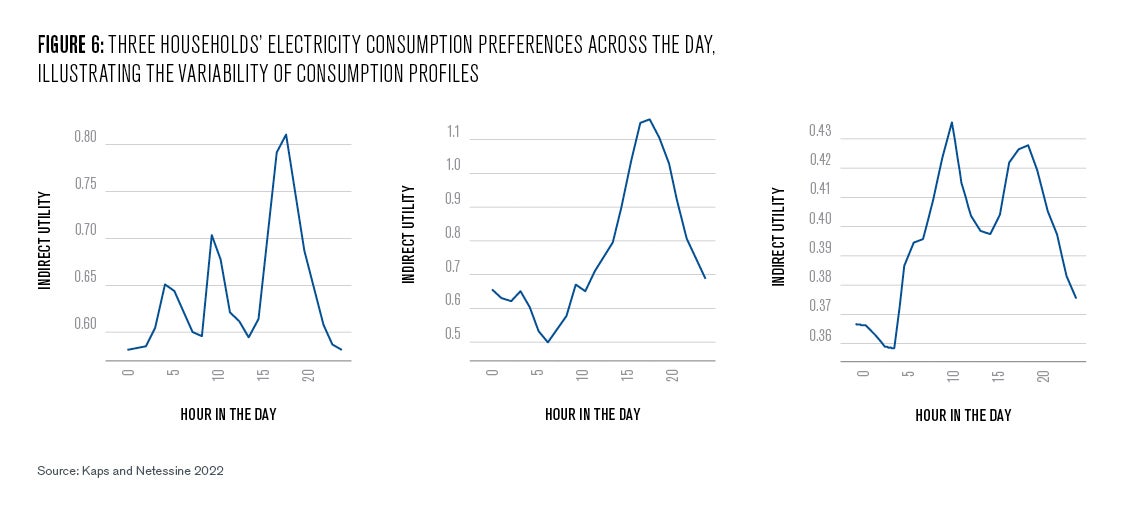
For households, the key takeaway from our work is that there is huge variability in electricity usage across the day that drastically affects the usefulness of storage (see Figure 6 to compare the hourly electricity consumption preferences of three different households). This effect is so pronounced that households with the same annual energy consumption, same solar capacity, and same battery capacity may utilize their battery differently by a factor of three—and ideally, one would want to know in which bucket one’s own household falls before buying a battery.
To know whether or not to get a battery as a household, it is therefore not enough to only look at your monthly utility bill or to estimate demand by looking at the number of people in a household. Rather, we find that the timing of excess solar and shortages need to be considered.
The ideal household for storage utilization is one where everyone leaves the house in the morning, little electricity is used during the day (so that solar can charge the battery), and in the evening, dinner or entertainment options utilize a lot of electricity to discharge the battery. Working from home, frequent and intensive AC usage, and overall low electricity usage are all detrimental to the utility of batteries.
Grid Provider and Electricity Tariff Takeaway
We used our model and the estimated parameters to counterfactually predict what may happen in the future. Particularly, we were interested in the large fraction of the population with no greenness valuation who only wants to minimize electricity cost. The hypothetical mid-term future we envision is one where solar is 20% cheaper, batteries 35% cheaper, the electricity price is 38 cents per kWh8,
and no subsidies exist.
We studied what solar and storage capacities the households from our dataset would invest in if they had the same electricity preferences across the day but only cared about the lowest possible price and were unwilling to pay extra for greenness. In that future scenario, 72% of households would get some amount of storage and almost everyone would get solar. This is bad news for the utility for three reasons (see Figure 7 for a visualization of reasons one and two).
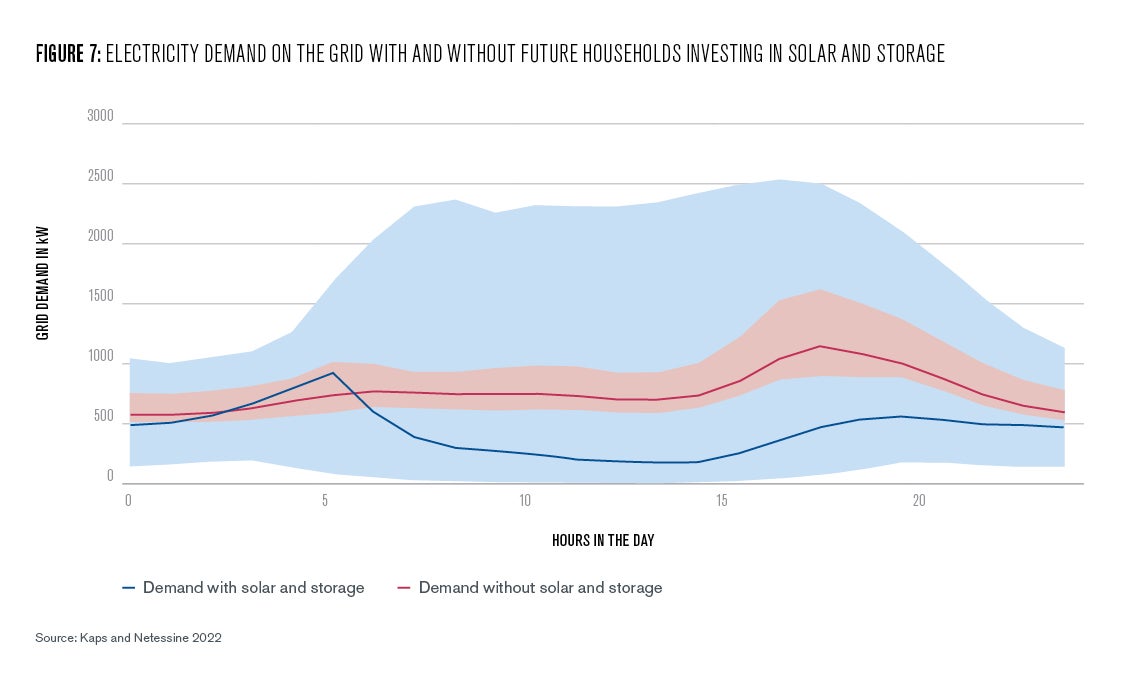
The first reason is that if most households install solar and storage, the average demand the utility needs to fulfill (henceforth called grid load) is 43% lower. In Figure 7, the black line represents the average grid load without investments, while the blue line shows grid load with investments.
The second, less-obvious, reason is that cheap solar and storage increases the variability of the grid load across the year (compare the grey shaded region with the blue shaded region indicating the range of the highest and lowest grid usage days). Cheap self-generated electricity allows households to electrify their household more, which means they use more electricity (electric vehicles, heat pumps, air conditioners, more appliances, etc.).
On very sunny days, almost all of this energy is self-generated and the utility experiences very little residential load, but on very dark days, e.g., in January (this is based on German data), almost all electricity demand has to be met by the utility, thus creating huge changes in grid load throughout the year.
The third reason storage is bad news for the utility is that existing electricity tariffs may not work well when households have the option to generate their own power and now can also choose when to use it throughout the day. Facing lower average demand and higher variability, utilities may naturally want to raise prices, but raising prices further incentivizes more households to get solar and storage.
Adding time-of-use pricing (or making evening consumption more expensive) is another case-in-point for storage. Of course, fixed connection fees, charges based on maximum demand or demand variability load, or other tools exist as potential solutions, but it is likely that electricity tariffs will have to evolve alongside storage technology in the coming years.
Regulator Takeaway
Regulatory takeaways are hard to generalize as they are so market-specific. We thus start with a German specific takeaway on solar and then move to a country-agnostic view on storage. The German federal government should stop subsidizing rooftop solar.
To economists, this insight might not be new, but we were able to quantify how many euros of subsidies it takes to reduce a ton of carbon emissions. With the current subsidy scheme, German taxpayers are paying €615 per ton of carbon removed, largely because residential solar by itself is already profitable, and subsidizing it reduces the payback of those households choosing to invest in it.
Regarding storage, things are more nuanced. As long as batteries remain unprofitable, governments that have household storage adoption targets can use the insight of greenness valuation to calibrate their incentive schemes. As adoption is a combination of financial benefits, subsidies, and greenness valuation, if a government knew the greenness valuation distribution in its population, it could set a subsidy at a level that would not render storage profitable directly but rather make it cheap enough for those with a high greenness valuation to invest in it.
Lastly, seeing the grid challenges discussed in the grid-provider takeaway section, it may be prudent for regulators to reevaluate what the relation between private consumers and the electricity grid should be. When a few percent of households had solar-only installations, letting them sell and buy from the grid at will was not overly problematic.
But if a large fraction of buildings get solar (some states and cities even mandate solar installations for new construction) and private storage becomes the norm, then regulating who gets to operate the storage and under which circumstances private individuals can sell to their grid providers will become necessary for the stable operation of the energy grid of the future.

Christian Kaps
Assistant Professor, Harvard School of BusinessChristian Kaps is an assistant professor at the Harvard School of Business and obtained his Ph.D. in Operations Management at the Wharton School.
Figgener, Jan, Christopher Hecht, Jakob Bors, Kai Spreuer, Kai-Philipp Kairies, Peter Stenzel, and Dirk Uwe Sauer. 2023. “The Development of Battery Storage Systems in Germany: A Market Review (Status 2023).” 10.48550/arXiv.2203.06762
Kaps, Christian and Serguei Netessine. 2023. “Residental Battery Storage: Reshaping the Way We Do Electricity.” SSRN. https://papers.ssrn.com/sol3/papers.cfm?abstract_id=4219247
- The contractual and regulatory specifics differ by market, but in most regions, a household receives either the market price, a subsidy, or a combination of both for the solar energy sold to the utility. [↩]
- One kilowatt-hour (kWh) is a standard unit of energy consumption. It arises when you consume 1 kilowatt of power for one hour (equivalent to running a 1,000-watt microwave for an hour). For comparison, the average American household uses about 1.3 kWh of electricity every hour, on average. The average German household uses about 0.6 kWh. [↩]
- The most commonly installed capacity in our dataset [↩]
- At the time of writing, Tesla’s Powerwall 2 has 13.3 kWh capacity and costs $11,500 including installation, while smaller systems might be even more expensive per kWh. [↩]
- Capacities ISEA RWTH Aachen, revenue based on own calculations. [↩]
- To be compliant with data-privacy regulation, all data is fully anonymized; we only observe information about the system and electricity usage, but nothing about the household itself or the individuals inside the house. This data is only used for research, to understand customer behavior, and to improve the service offering. [↩]
- The ~260 households with a zero valuation are those households that invested only in solar, which was a profitable investment and does not allow us to infer anything about their greenness valuation. [↩]
- Higher than in our dataset but lower than in Germany and many other European countries in 2022 following the Ukrainian invasion [↩]
