Nuclear energy, an emissions-free energy source, is at risk of decline in the United States while the need to confront climate change becomes more pressing. Federal investment and market incentives may enable much-needed growth.
At a Glance
Key Challenge
U.S. nuclear energy capacity is in decline due to two major causes—both price-related: rising construction costs of new reactors and overwhelming competition from natural gas plants.
Policy Insight
Federal investment in the development of small modular reactors, the construction of new reactors, and the modernization of aging reactors, in addition to carbon pricing, would enable a much-needed increase in U.S. nuclear energy capacity.
Status of Nuclear Energy
Nuclear energy is an important component of the U.S. clean energy portfolio. Across the nation, 94 commercial nuclear reactors produce more than 50% of all emissions-free electricity (U.S. Nuclear Regulatory Commission 2020a). As the U.S. prepares to meet the goal proposed by President Biden of 100% emissions-free electricity by 2035 (Waldman 2021), the future contribution of nuclear energy is contested. Reaching this ambitious goal, however, may require not only massive investments in grid-scale energy storage and renewable energy generation (e.g., solar, wind), but also the expansion of nuclear energy capacity.
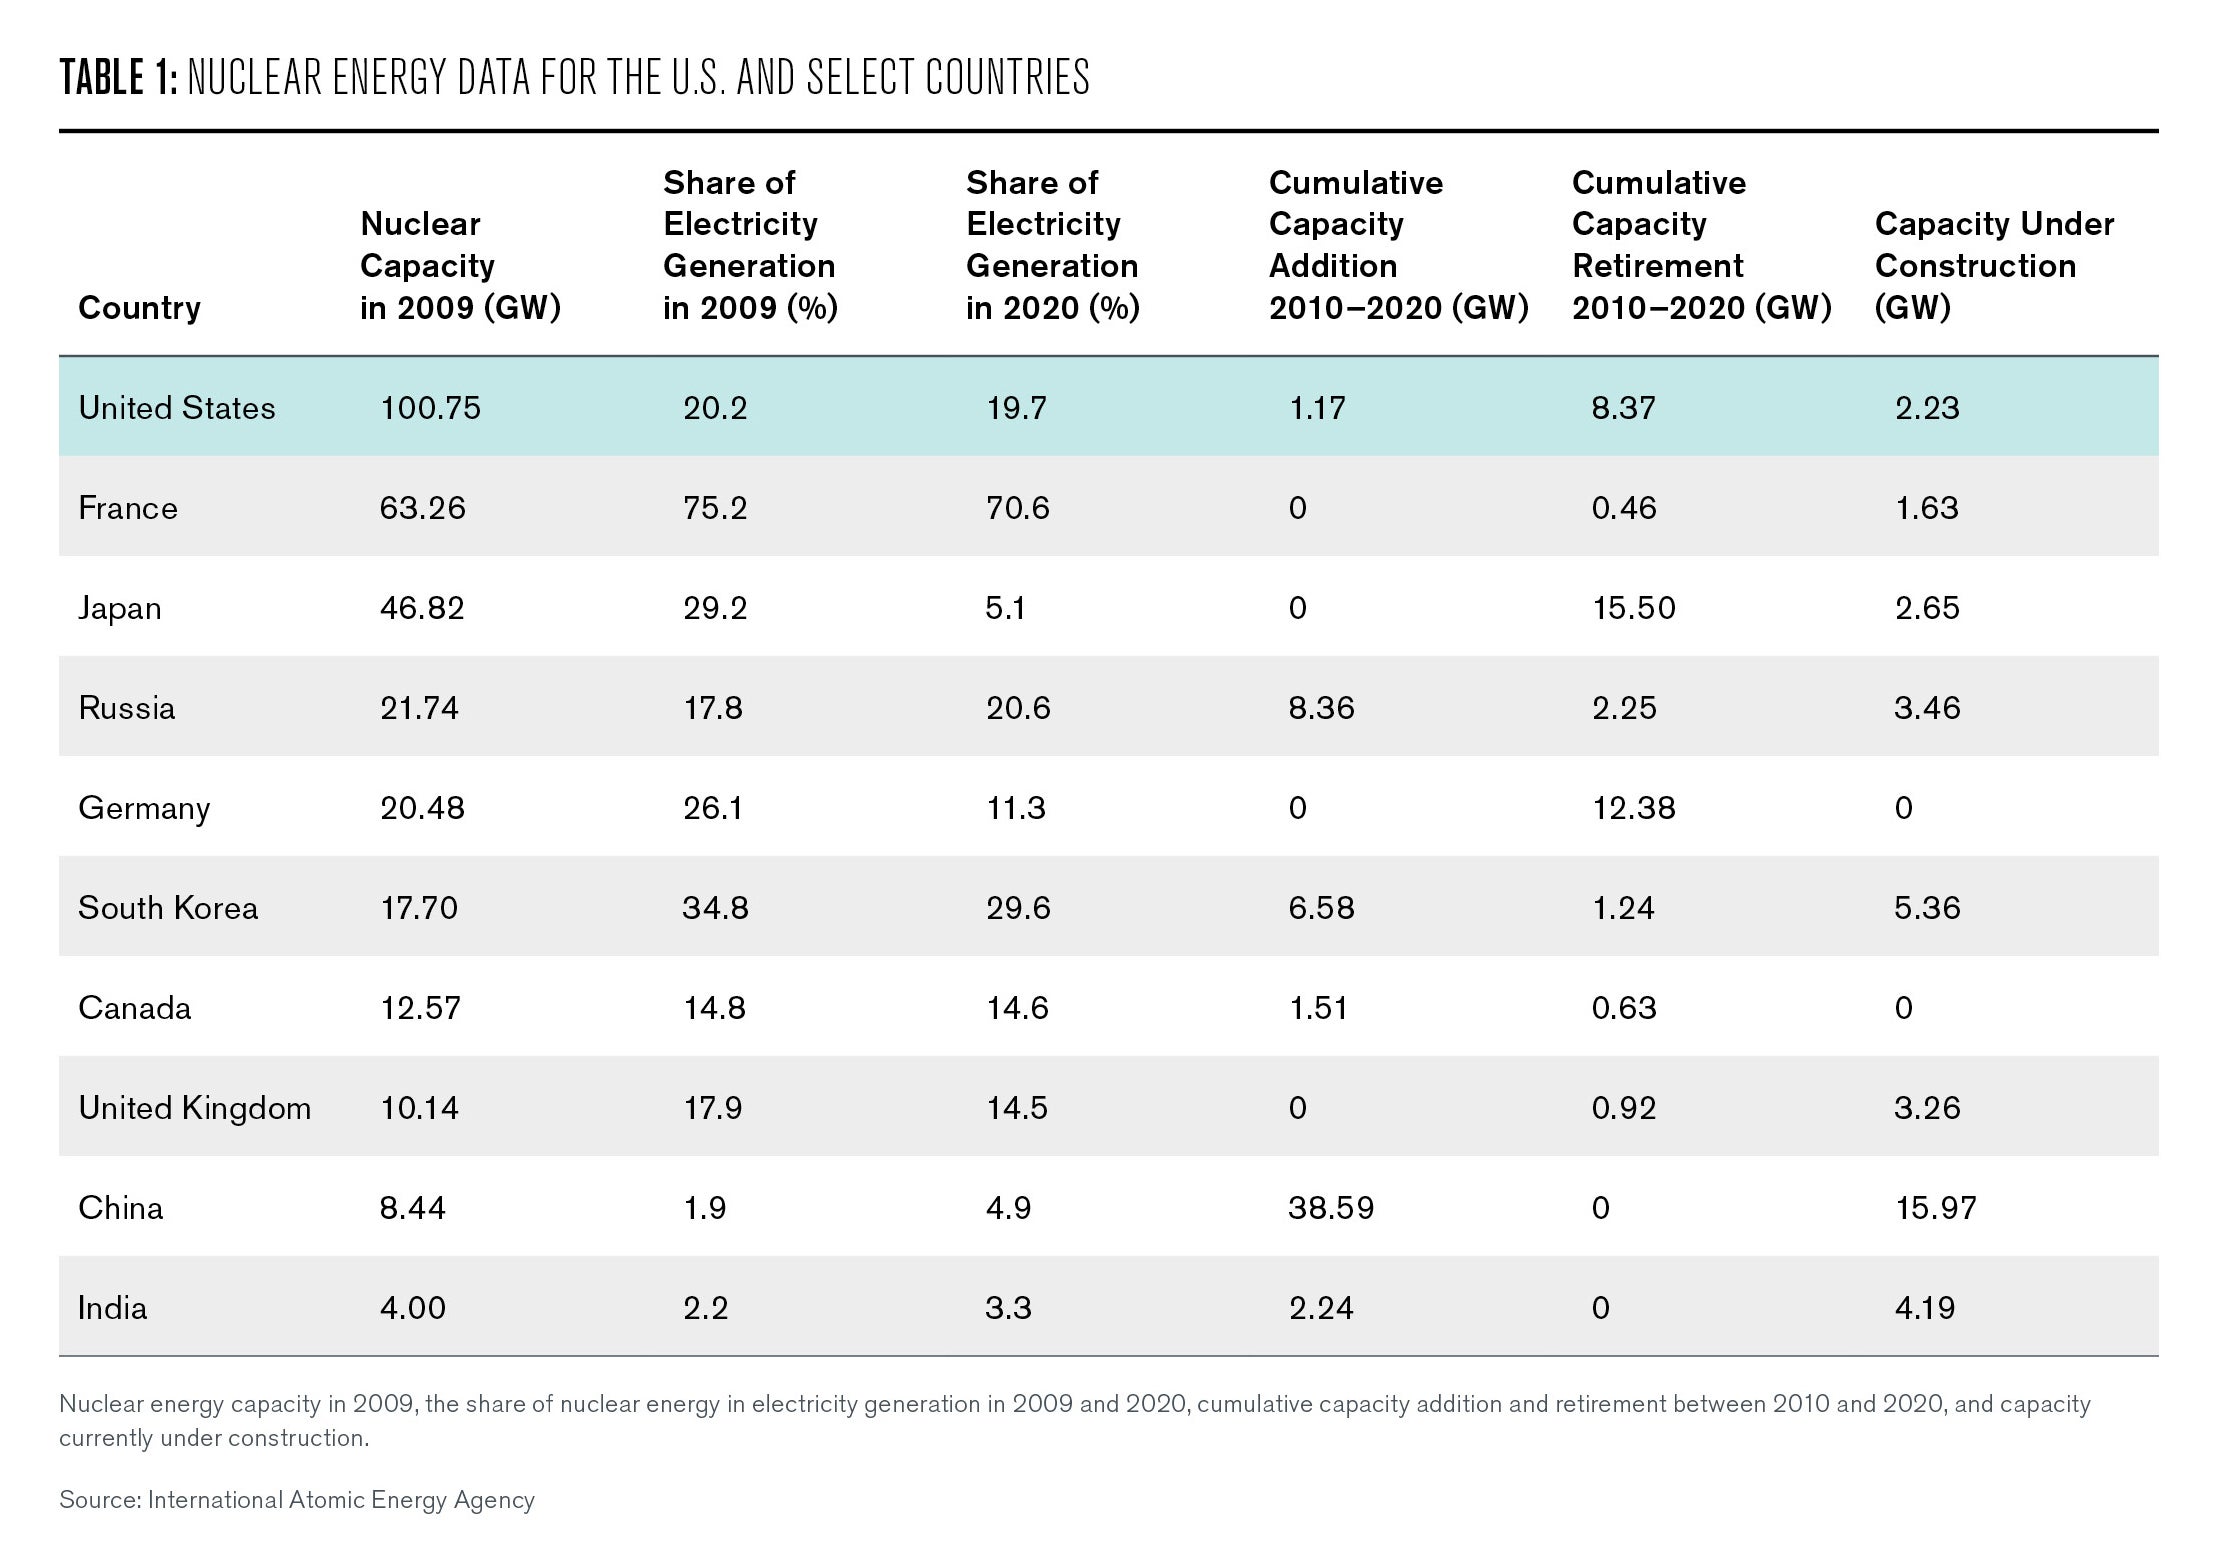
Construction of new nuclear plants has recently seen a surge in many parts of the world, most notably in China where nuclear capacity grew by more than 400% between 2010 and 2020, with an additional 16 GW of capacity set to be connected to the grid in the next few years (Table 1). In contrast, Japan and Germany have sharply reduced their nuclear capacity by 33% and 60% respectively in the aftermath of the 2011 Fukushima accident (Table 1).
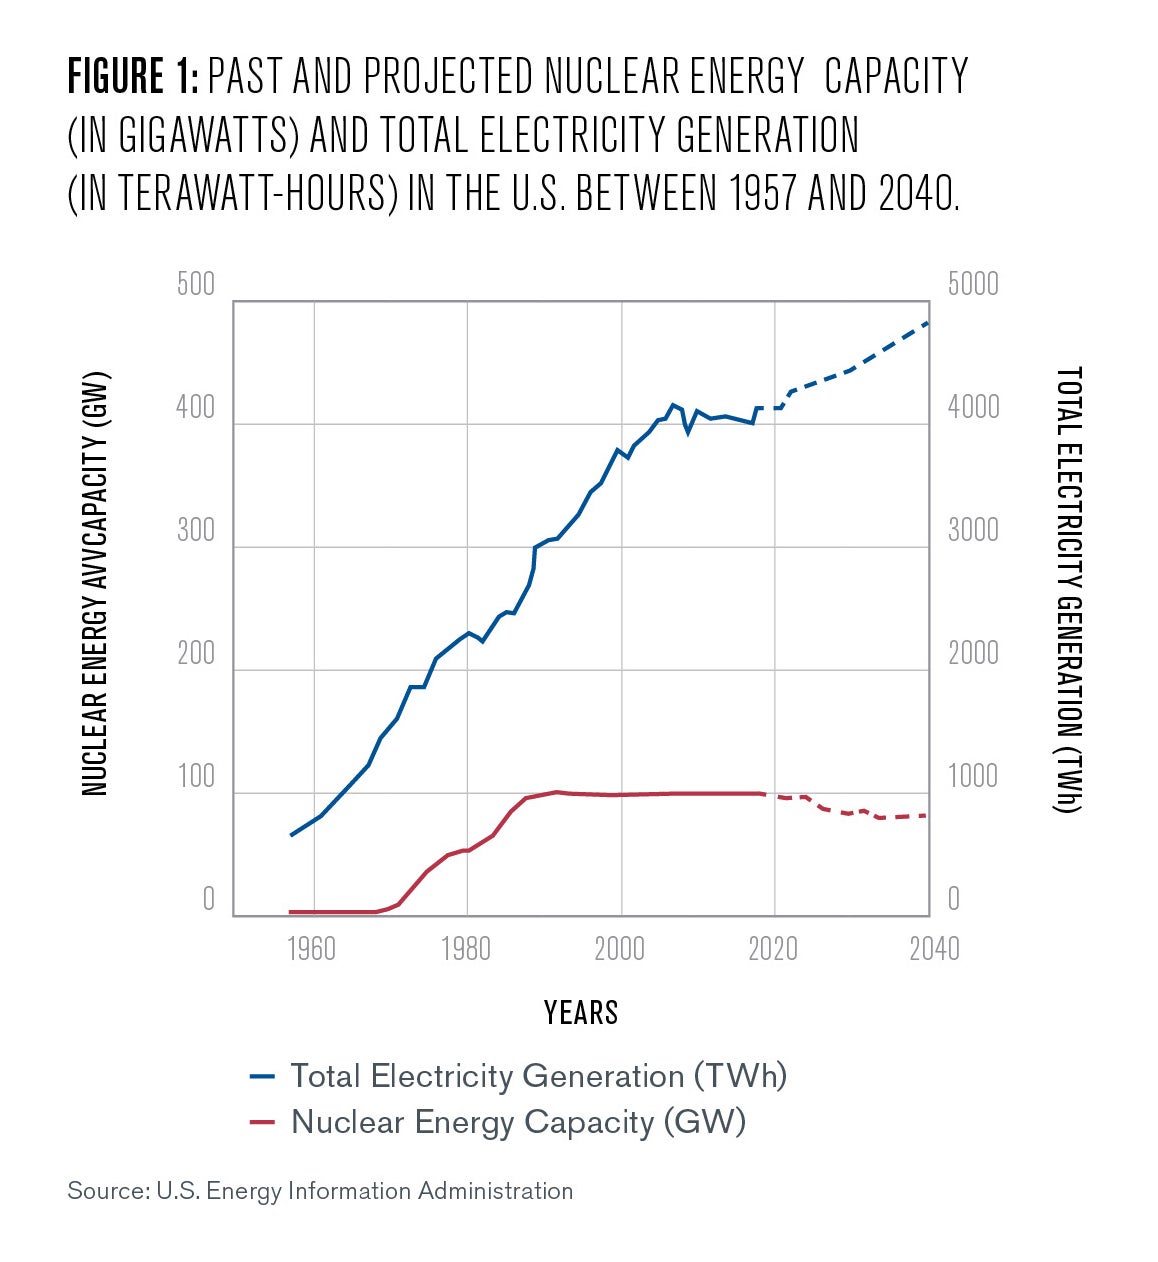
The U.S. has seen a slow decline in nuclear capacity in the past decade, as shown in Table 1, and is set to lose even more capacity in the coming decade as more reactors shut down without replacement (Figure 1). Five reactors have closed between 2019 and 2021, while only two are under construction (International Atomic Energy Agency 2021). This decline in nuclear capacity is occurring while demand for electricity continues to increase in the U.S., particularly from the transportation sector (Figure 1).
The decline of U.S. nuclear capacity can be attributed to two major causes—both price-related.
Construction Costs
Nuclear reactor construction projects have faced rising costs despite a low interest rate environment, which has discouraged private investment. The overnight cost of projects initiated between 1970 and 1986 exceeded budget by 241% on average. More recently, two 1.1 GW reactors in South Carolina would have entered service in 2020 if they were not canceled due to delays and billions of dollars in cost overruns (Cunningham and Polson 2017).
Enhanced regulatory scrutiny after the 1979 Three Mile Island accident has contributed to the cost increases due to inspection disruptions, design changes, and additional spending on safety features. Reactors under construction during the accident took 2.2 times longer to complete and were 2.8 times more expensive compared to reactors completed before the accident (Lovering, Yip, and Nordhaus 2016).
Regulatory scrutiny, however, is not the dominant contributor to the overall increase in costs. By examining the construction cost of the largest reactor component, the containment structure, a recent analysis (Eash-Gates et al. 2020) revealed that significant cost increases occurred between 1976 and 2017 mainly because material use increased (due to design changes) and labor productivity declined (due to construction management and supply deficiencies). Only 30% of these cost increases could be directly attributed to safety-related spending.
Competition
The second major cause of stagnating U.S. nuclear capacity is overwhelming competition from natural gas power plants. Technological advances in hydraulic fracturing (fracking) and horizontal drilling have allowed the extraction of enormous shale gas reserves that were previously inaccessible (Elliott and Santiago 2019). The increased U.S. production of natural gas, which reached an all-time high of 34 trillion cubic feet in 2019 (U.S. Energy Information Administration 2019), has driven down prices, thus making natural gas a more attractive energy source relative to nuclear energy. The use of natural gas has been further buoyed by favorable provisions in the U.S. tax code (e.g. drilling costs deduction) and the absence of taxes on carbon emissions (Environmental and Energy Study Institute 2019).
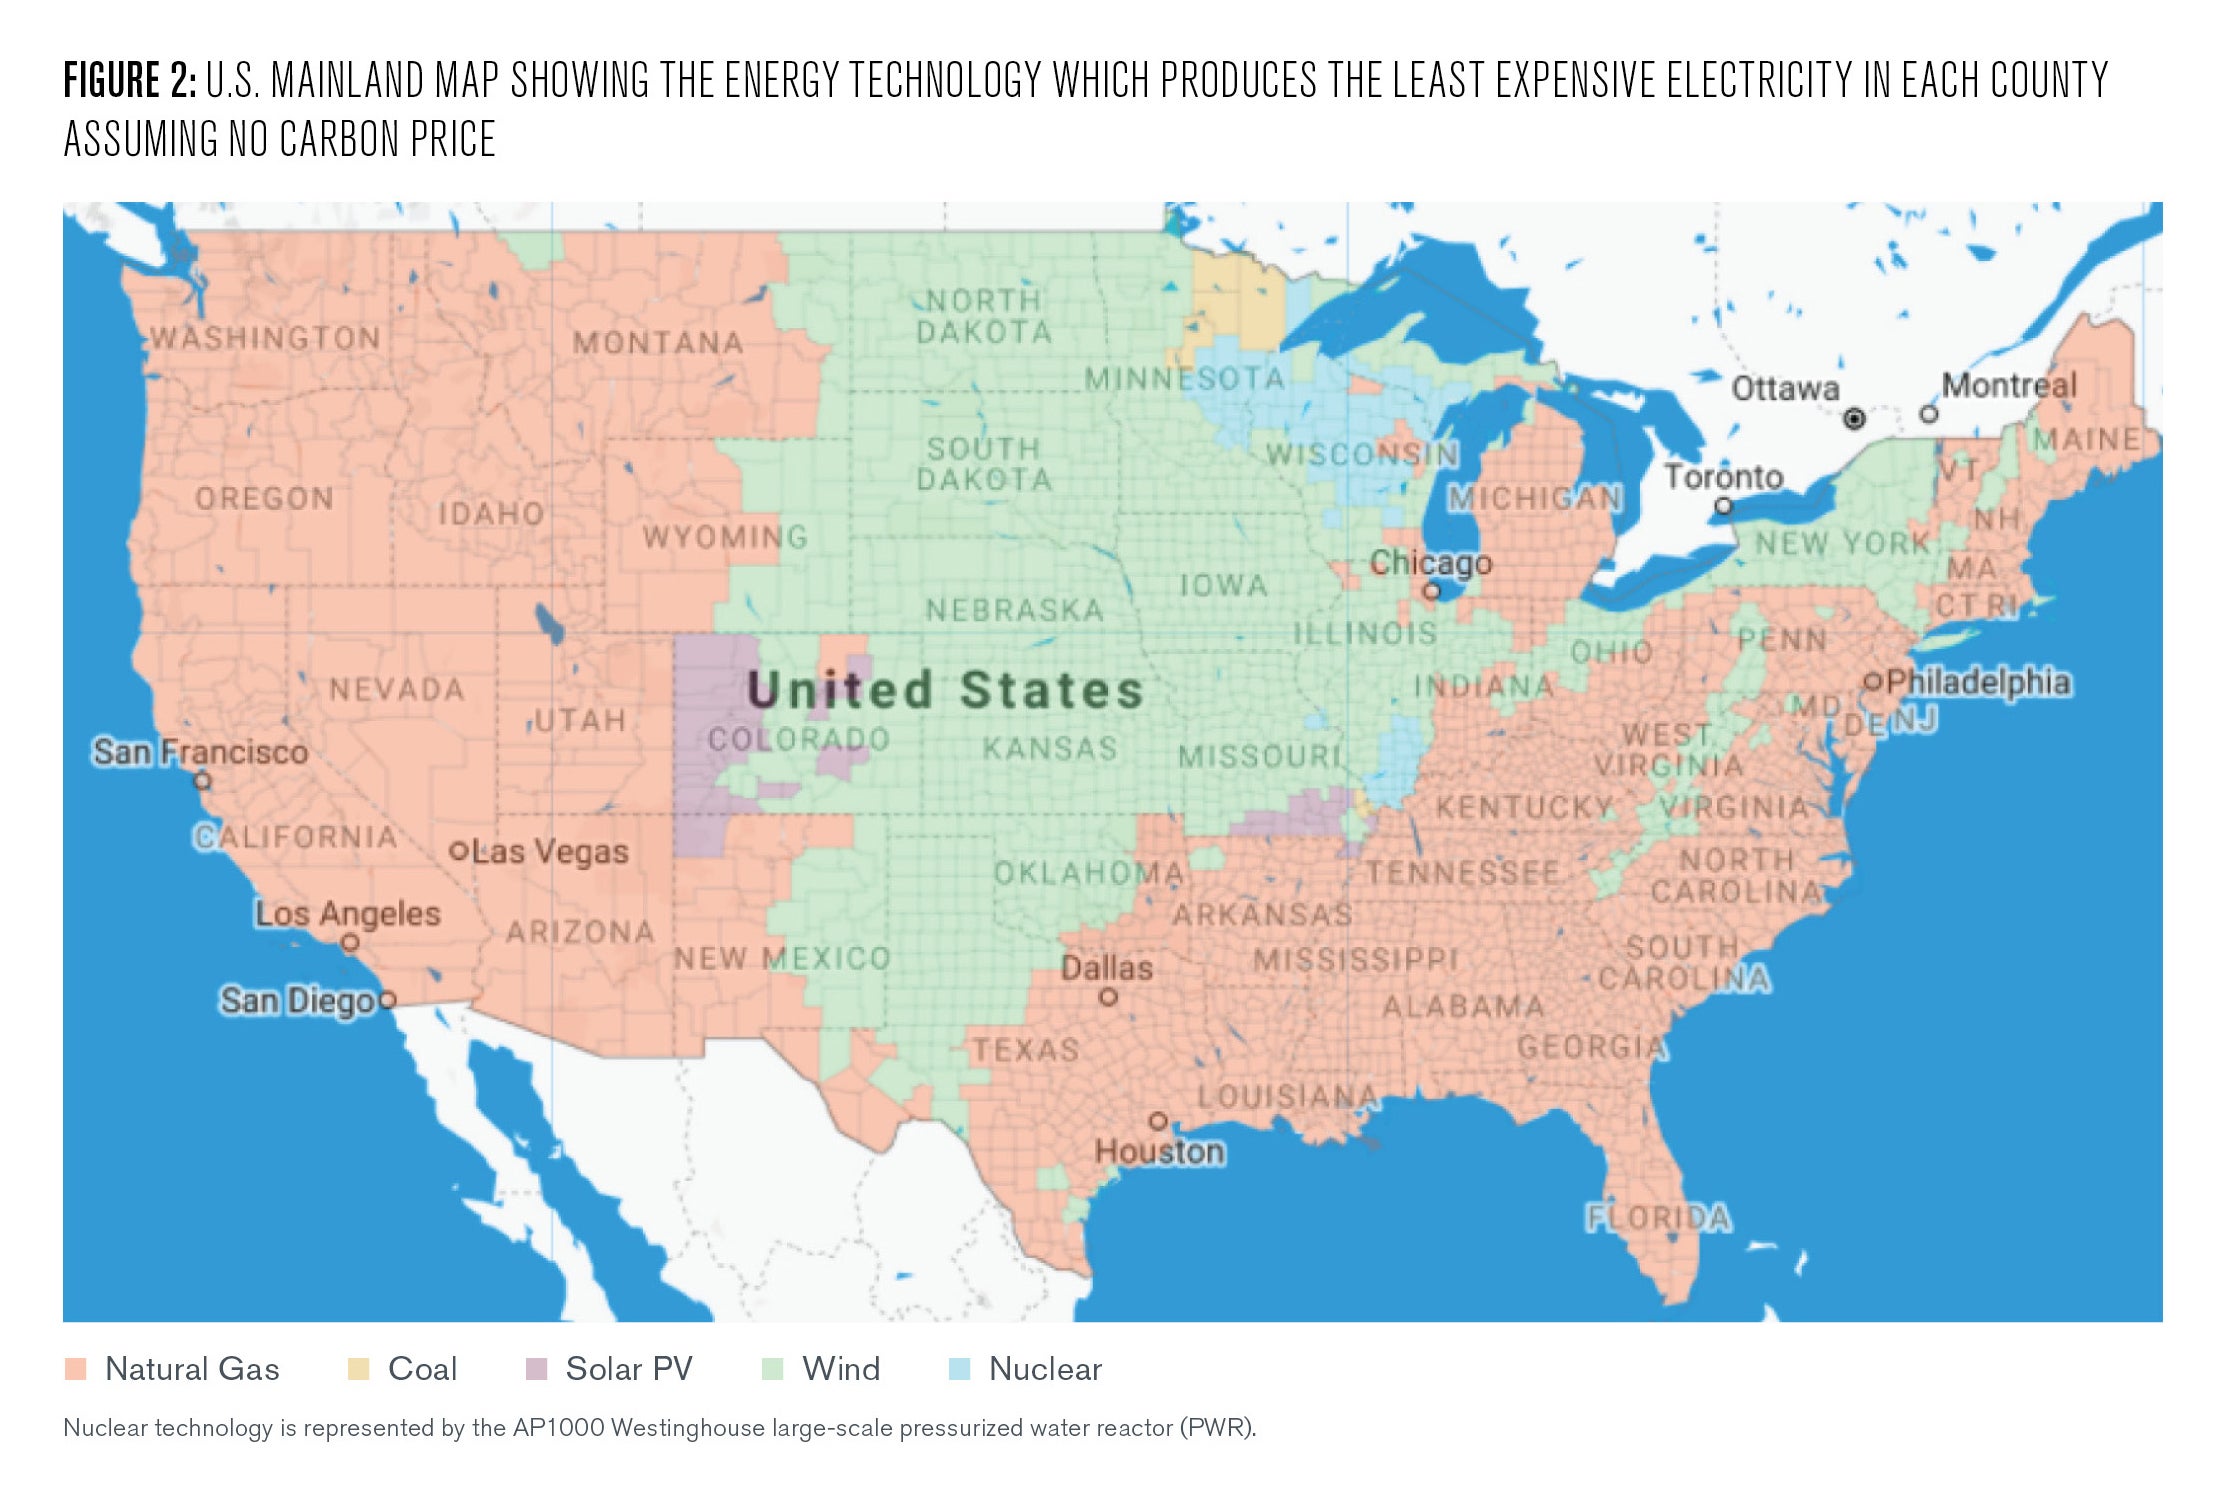
Using data on the capital cost of various energy technologies (see the appendix), we estimate that natural gas power plants currently generate the cheapest electricity in most of the U.S. while nuclear energy is the least expensive energy source in limited parts of the Midwest region (Fig. 2).
In this era of low natural gas prices, nuclear reactors are becoming too unprofitable to operate. In fact, 21 reactors, accounting for almost a quarter of total nuclear energy capacity, are at risk of closing (Clemmer et al. 2018). If these reactors are closed and replaced by natural gas plants, annual carbon dioxide emissions would increase by about 80 million metric tons (U.S. Energy Information Administration 2020d), thus jeopardizing progress towards the full decarbonization of the electric grid by 2035.
Nuclear in the Energy Transition
Currently, about 60% of U.S. electricity is produced through the combustion of coal and natural gas (U.S. Energy Information Administration 2020e). The U.S. has committed in 2021 to substitute fossil fuels in electricity generation with emissions-free energy sources such as solar, wind, hydropower, and nuclear energy by 2035 (Waldman 2021).
While wind and solar energy are economically competitive with fossil fuels in many parts of the country (Fig. 2), their ability to generate electricity depends on the weather and time of day. As a result, wind and solar photovoltaics only operate at 40% and 30% of their maximum generating capacity in a given year (U.S. Energy Information Administration 2020c).
On the other hand, nuclear plants consistently operate at over 90% of their maximum capacity on average, higher than natural gas plants which operate at 60% capacity on average (U.S. Energy Information Administration 2020c). In addition, nuclear energy has a high power density, as it requires, per unit of power generation, 36 times less land area than solar energy and 130 times less land area than wind energy (van Zalk and Behrens 2018).
In a zero-emissions grid with no nuclear energy, solar and wind farms would, in 2050, span over 1 million km2, or an area roughly the size of Arkansas, Iowa, Kansas, Missouri, Nebraska, Oklahoma, and West Virginia combined (E. Larson et al. 2020), which could complicate the siting of new energy projects and exacerbate conflicts over land use (Mai et al. 2021). In contrast, if nuclear energy is significantly expanded, an area slightly smaller than West Virginia and Nebraska combined (about 250,000 km2) would be required for electricity generation (E. Larson et al. 2020). Therefore, nuclear energy may be needed to transition the U.S. to a 100% emissions-free grid while ensuring grid reliability and minimizing land use.
Many, however, see nuclear plants as too unsafe to contribute to the transition to a clean grid despite their excellent safety record compared to fossil fuel plants. Since the first U.S. nuclear plant opened in 1958, there has been only one major incident, a partial meltdown at Three Mile Island in 1979. This incident was met with public uproar, though it did not lead to any adverse health consequences because, thanks to redundant safety features, radiation was successfully contained (Chapin et al. 2002; World Nuclear Association 2019).
Overall, the death toll of U.S. nuclear plants, 21 in total, has been limited to workplace accidents such as falls and electrocutions (Environmental Progress 2021). U.S. fossil fuel plants, on the other hand, cause between 23,000 and 94,000 premature deaths annually due to particulate matter pollution (Caiazzo et al. 2013). Coal power plants, in particular, produce substantial amounts of highly radioactive ash (Hvistendahl 2007). By comparison, nuclear plants release negligible levels of radiation during their normal operations, due to strict monitoring and regulation (R. Rhodes 2018; Davis 2018).
Nonetheless, one issue that elicits legitimate concerns and may impede the expansion of nuclear capacity is the disposal of spent nuclear fuel. The U.S. has yet to settle on a long-term solution to this issue, which protects environmental and human safety, ensures secure storage, and minimizes costs.
Currently, spent nuclear fuel rods are stored in dozens of sites across 34 states, mostly near or within nuclear plants (U.S. Nuclear Regulatory Commission 2020b). The spent fuel is stored either in water pools, or in sealed dry casks that provide radiation shielding and secure storage for at least 100 years (Conca 2020; Chapin et al. 2002). This fragmented system of spent fuel storage, though it does not pose any significant safety risks, places financial and logistical burdens on nuclear plant operators, sometimes long after a plant is decommissioned.
The U.S. Department of Energy (DOE) collected billions of dollars in fees over 30 years from nuclear plant operators, with the promise that their spent fuel would be collected and stored in a permanent geological repository in Yucca Mountain, Nevada. However, the Yucca Mountain site, despite its technical and safety merits, never materialized due to stiff political opposition (Dixon 2013; U.S. Nuclear Regulatory Commission 2014). Two other proposed repositories in New Mexico and Texas are also facing legal and political hurdles (Bryan 2021; Douglas 2021). As a result, the DOE is now liable for $35 to $50 billion in refunds and damages to nuclear plant operators, with the bill rising each year that a permanent repository is not available (Dixon 2013). By comparison, collecting, encapsulating, and storing all spent fuel in Yucca Mountain may cost as little as $20 billion (in 2020 dollars) once the site is open (OECD 1993).
The example of other nations that have found success in establishing permanent geological repositories shows that the challenge resides not in technical considerations, but rather in politics and community engagement. Finland, for instance, saw early and sustained engagement with the communities that lived close to the candidate repository sites. This engagement built trust and assuaged concerns, so that when it came time for the final selection one municipality even volunteered to host the repository if all other candidate sites were taken out of consideration (Fountain 2017).
In addition to establishing a permanent geological repository, scaling up reprocessing can further improve the management of spent fuel and radioactive waste. Reprocessing involves the separation of uranium in the spent fuel from the fission products (e.g., cesium, strontium) and the transuranic elements (e.g., neptunium, americium, plutonium). The uranium can be incorporated into new fuel rods or used in other applications. The fission products and transuranic elements can be isolated for future use or concentrated and encapsulated for long-term storage.
Reprocessing not only reduces the quantity of radioactive material that requires storage in a geological repository, but also ensures efficient use of available uranium reserves. Though widely used in France, the United Kingdom, and Russia, the reprocessing of spent fuel has not been performed in the U.S. in decades even though a federal ban on the practice was lifted in 1981 (World Nuclear Association 2020a).
Since about 80% of the uranium used in U.S. nuclear plants is imported (U.S. Energy Information Administration 2020a), reprocessing would also reduce reliance on foreign uranium mines, which expose many marginalized communities around the world to environmental and health hazards (Dewar, Harvey, and Vakil 2013; Nuclear Free Future Foundation et al. 2020).
In addition to the issue of spent fuel and radioactive waste, there is also a growing concern about the aging state of many operational reactors. Out of 94 U.S. commercial reactors, 47 are more than 40 years old and four are more than 50 years old (U.S. Nuclear Regulatory Commission 2020a). These reactors require increased maintenance and many of their control rooms are still equipped with analog systems that afford limited functionality and access to information compared to state-of-the-art digital systems.
The Nuclear Regulatory Commission (NRC) licenses reactors for 40 years initially, then extends licenses for 20 years at a time. To obtain a license renewal, the NRC requires the remediation of safety issues and the establishment of a monitoring and maintenance program (Gormley, Sinkiewicz, and Wolfe 2020). But beyond compliance with NRC regulations, many operators have little incentive to engage in costly innovation or modernization programs. In response, Congress passed legislation in 2019 that instructs the NRC to establish by 2027 an updated regulatory framework that encourages greater innovation within the nuclear industry (Nuclear Energy Innovation and Modernization Act 2019).
For over 60 years, U.S. nuclear plants have produced reliable emissions-free energy while maintaining a strong safety record. As a substitute to fossil fuels for baseload power generation, nuclear energy would significantly reduce greenhouse gas emissions, and could provide valuable ancillary services such as district heating and hydrogen production. Coupled with a rapid increase in the capacity of renewables and energy storage, expanding nuclear energy could be a viable pathway to rapidly decarbonize the grid by 2035.
Achieving this expansion, however, might be derailed by an aging infrastructure and the lack of a cost-effective system for the management and disposal of spent nuclear fuel and other radioactive waste. These issues should be addressed so that nuclear energy can safely and effectively contribute to full decarbonization of the electric grid.
Expanding Nuclear Capacity
A Princeton University report estimates that, in a scenario where renewable energy and nuclear energy are both used to decarbonize the grid, about 260 GW of nuclear capacity would need to be constructed by 2050 (E. Larson et al. 2020). Small modular reactors (SMRs), which generate 300 MW or less compared to around 1,000 MW for standard reactors, could provide a less capital-intensive and more flexible means to increase nuclear capacity, and replace many aging reactors currently in operation.
Safety concerns have, however, been raised about SMRs due to their small containment structures, the lack of some active safety features, and the potential for interactions between adjacent reactors during an accident (Lyman 2013). On the other hand, these SMRs are designed with many safety improvements compared to existing large-scale reactors such as passive safety features that do not require human interaction, emergency power, or mechanical pumps (Cho 2019; Conca 2018; World Nuclear Association 2020b).
Multiple companies are working to develop, demonstrate, and gain regulatory approval for their SMR designs. A notable example is NuScale, which developed a light-water SMR that can modulate its power output, with a maximum capacity of 72 MW (Ingersoll et al. 2015). After receiving NRC approval for its SMR design in 2020 (U.S. Nuclear Regulatory Commission 2020a), NuScale is poised to start the construction of a nuclear plant with twelve 60-MW SMRs in Idaho (World Nuclear News 2020).
Another SMR design under development is a hybrid plant that integrates an advanced sodium fast reactor (SFR) with a molten salt energy storage system (Patel 2020). In a future electric grid with a high share of renewable sources, both of these SMR designs are valuable because they can modulate their output in response to grid fluctuations, thus ensuring reliable and flexible generation (Ingersoll et al. 2015; Patel 2020).
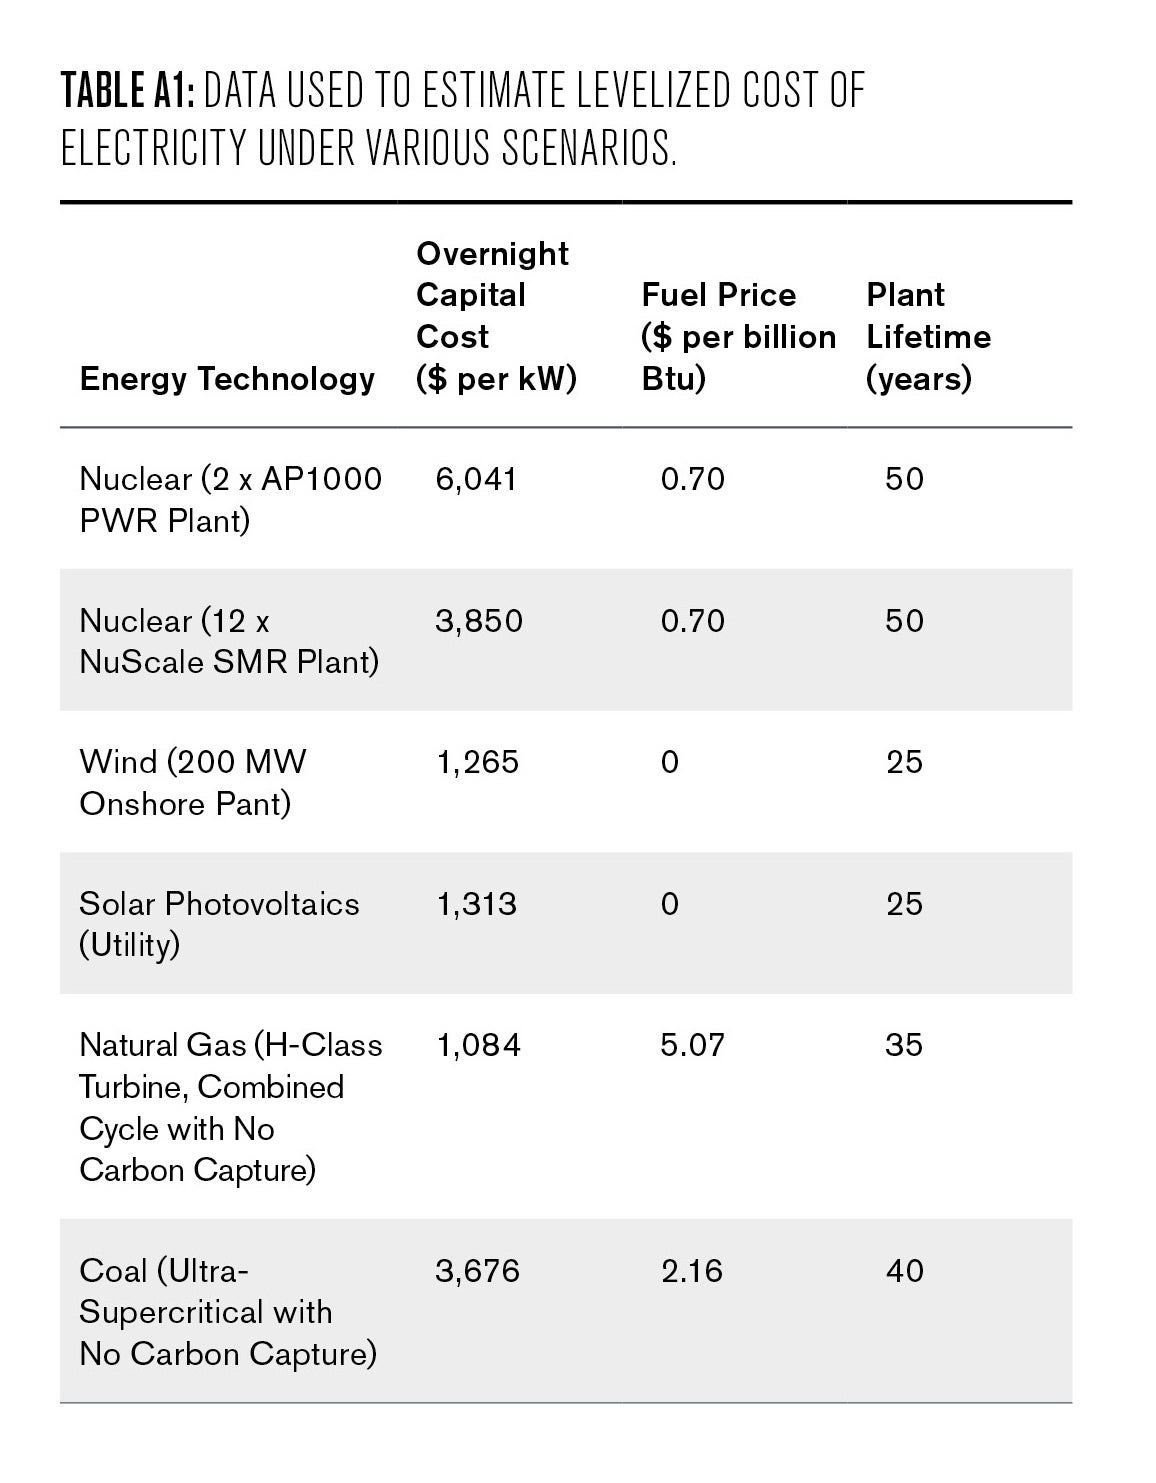
With rising construction costs a major obstacle to expanding nuclear capacity, SMRs promise to be significantly cheaper and easier to build than large-scale reactors. Each NuScale SMR is entirely fabricated in a factory then installed on-site, which would help reduce its cost as production is scaled up. Hence, a NuScale SMR plant is expected to cost about $3850 (in 2020 dollars) per kilowatt (Black, Aydogan, and Koerner 2019), compared to about $6000 per kilowatt for a large-scale 1-GW reactor (U.S. Energy Information Administration 2020b).
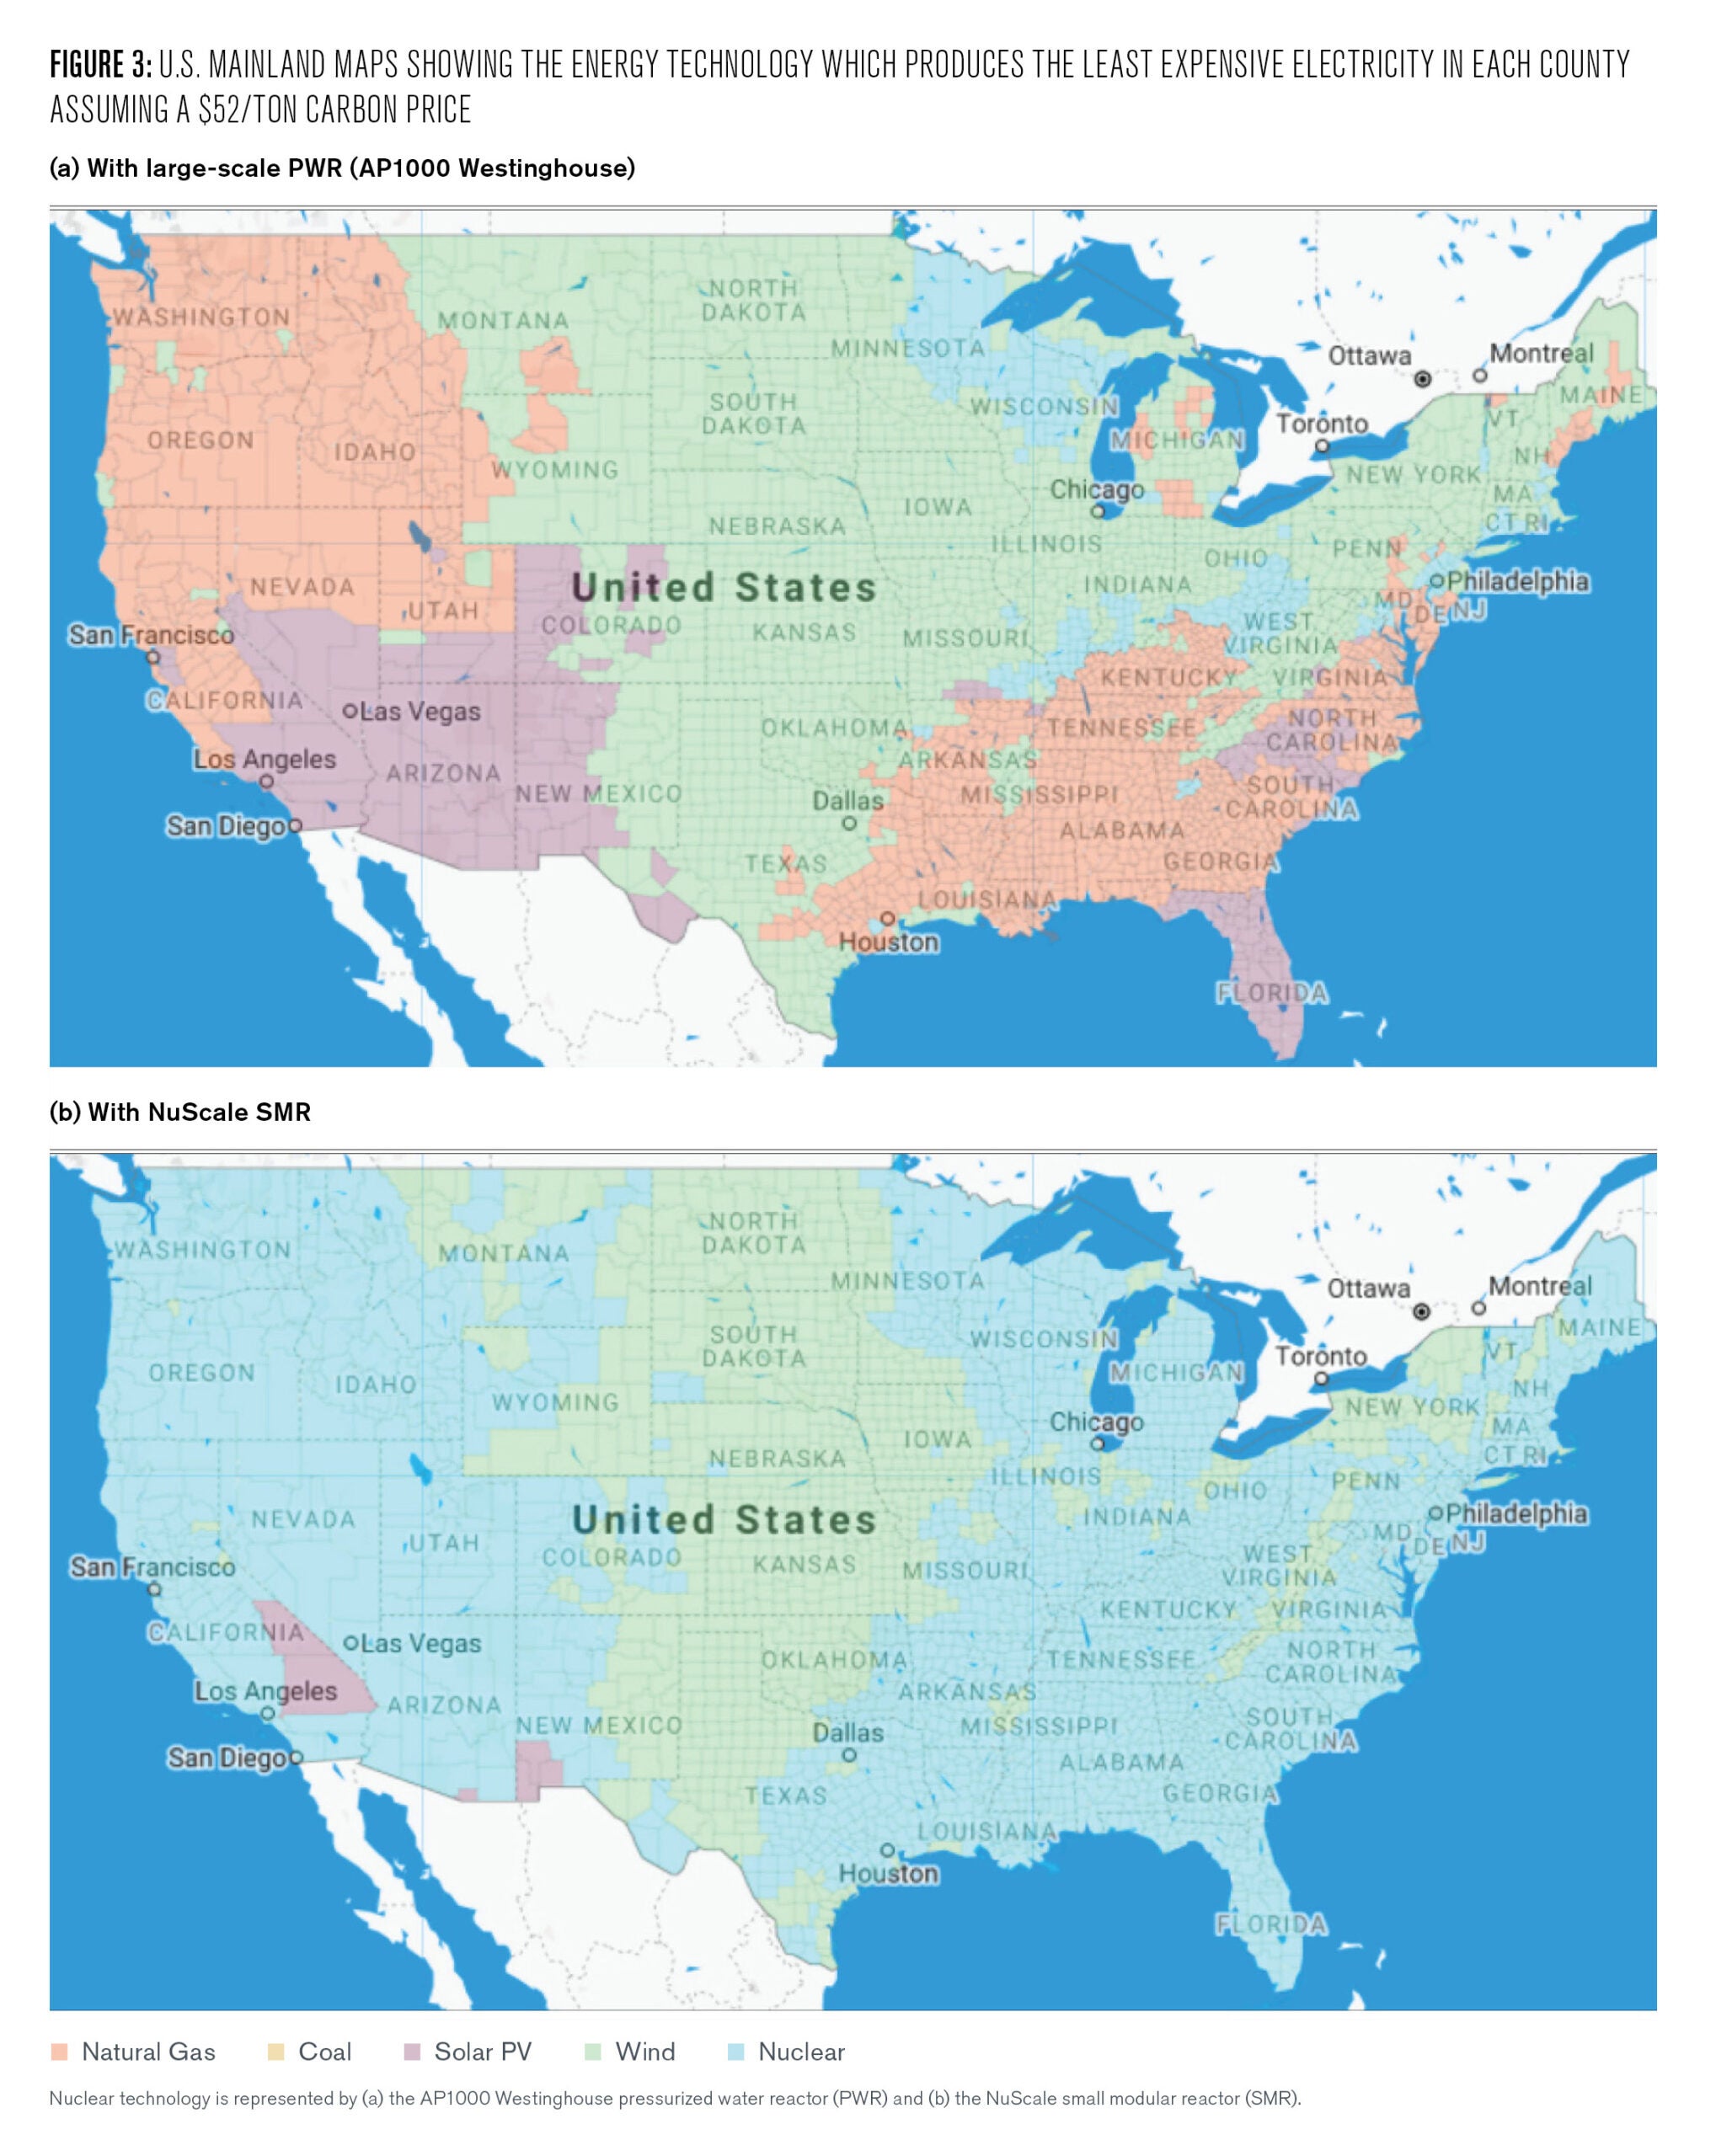
If a $52/ton price (in 2020 dollars) were placed on carbon dioxide emissions, as recommended by a consortium of federal agencies (U.S. Interagency Working Group on Social Cost of Greenhouse Gases 2016), nuclear plants with costs comparable to the large-scale reactor would be competitive only in limited areas of the U.S. East and Midwest (Fig. 3a). In comparison, a nuclear SMR plant would produce the least expensive electricity in almost all the U.S. (Fig. 2b), and could, thus, effectively compete with natural gas and renewable energy.
To accelerate the deployment of SMRs to the grid, the Department of Energy has provided support which has been critical in enabling SMR developers to clear technological and regulatory hurdles (World Nuclear Association 2020b; NuScale Power 2020). In fiscal year 2020, Congress appropriated $230 million to the demonstration of advanced reactors and $100 million to support the design and licensing of SMRs (U.S. Senate Appropriations Committee 2020). This support was continued into 2021 (S.4049: National Defense Authorization Act 2020).
But while SMRs might require at least another decade to be deployed at scale, upgrading operational reactors can be a quicker and more cost-effective method to increase nuclear capacity. Since half of U.S. commercial reactors are more than 40 years old, supporting the replacement of aging components and upgrade of control rooms and safety mechanisms can allow many reactors to safely remain in operation for decades to come (Voosen 2009).
This support can also allow a reactor operator to seek NRC approval for a “power uprate,” whereby the reactor is reconfigured to produce a higher power output (Trehan 2004). As a result, nuclear capacity can be increased, up to safe operation limits (IAEA 2004), while avoiding the logistical and financial burdens of building new reactors. Power uprates have been used in the U.S. since 1996 to add over 6.7 GW of capacity, and could enable at least another 6.5 GW to be added in the next few years (A. Larson 2019; Trehan 2004).
Power uprates, however, might not be sufficient. Decarbonizing the grid might require a massive expansion in nuclear capacity, as recommended by the Princeton University report, which will be fraught with challenges. The federal government is uniquely positioned to tackle these challenges because it not only can spend without financial constraints (unlike state governments and the private sector), but can also use fiscal and legal tools to fully employ human and material resources while avoiding supply bottlenecks and inflationary pressures (Nersisyan and Wray 2021).
Various policy options are available to provide this federal investment. One option would establish a fund under the U.S. Department of Energy that provides financing for utilities interested in upgrading or constructing nuclear reactors. This financing can take the form of grants or low-interest loans as appropriate for the risk and scale of each project, with preferential terms given to cooperatives and publicly owned utilities.
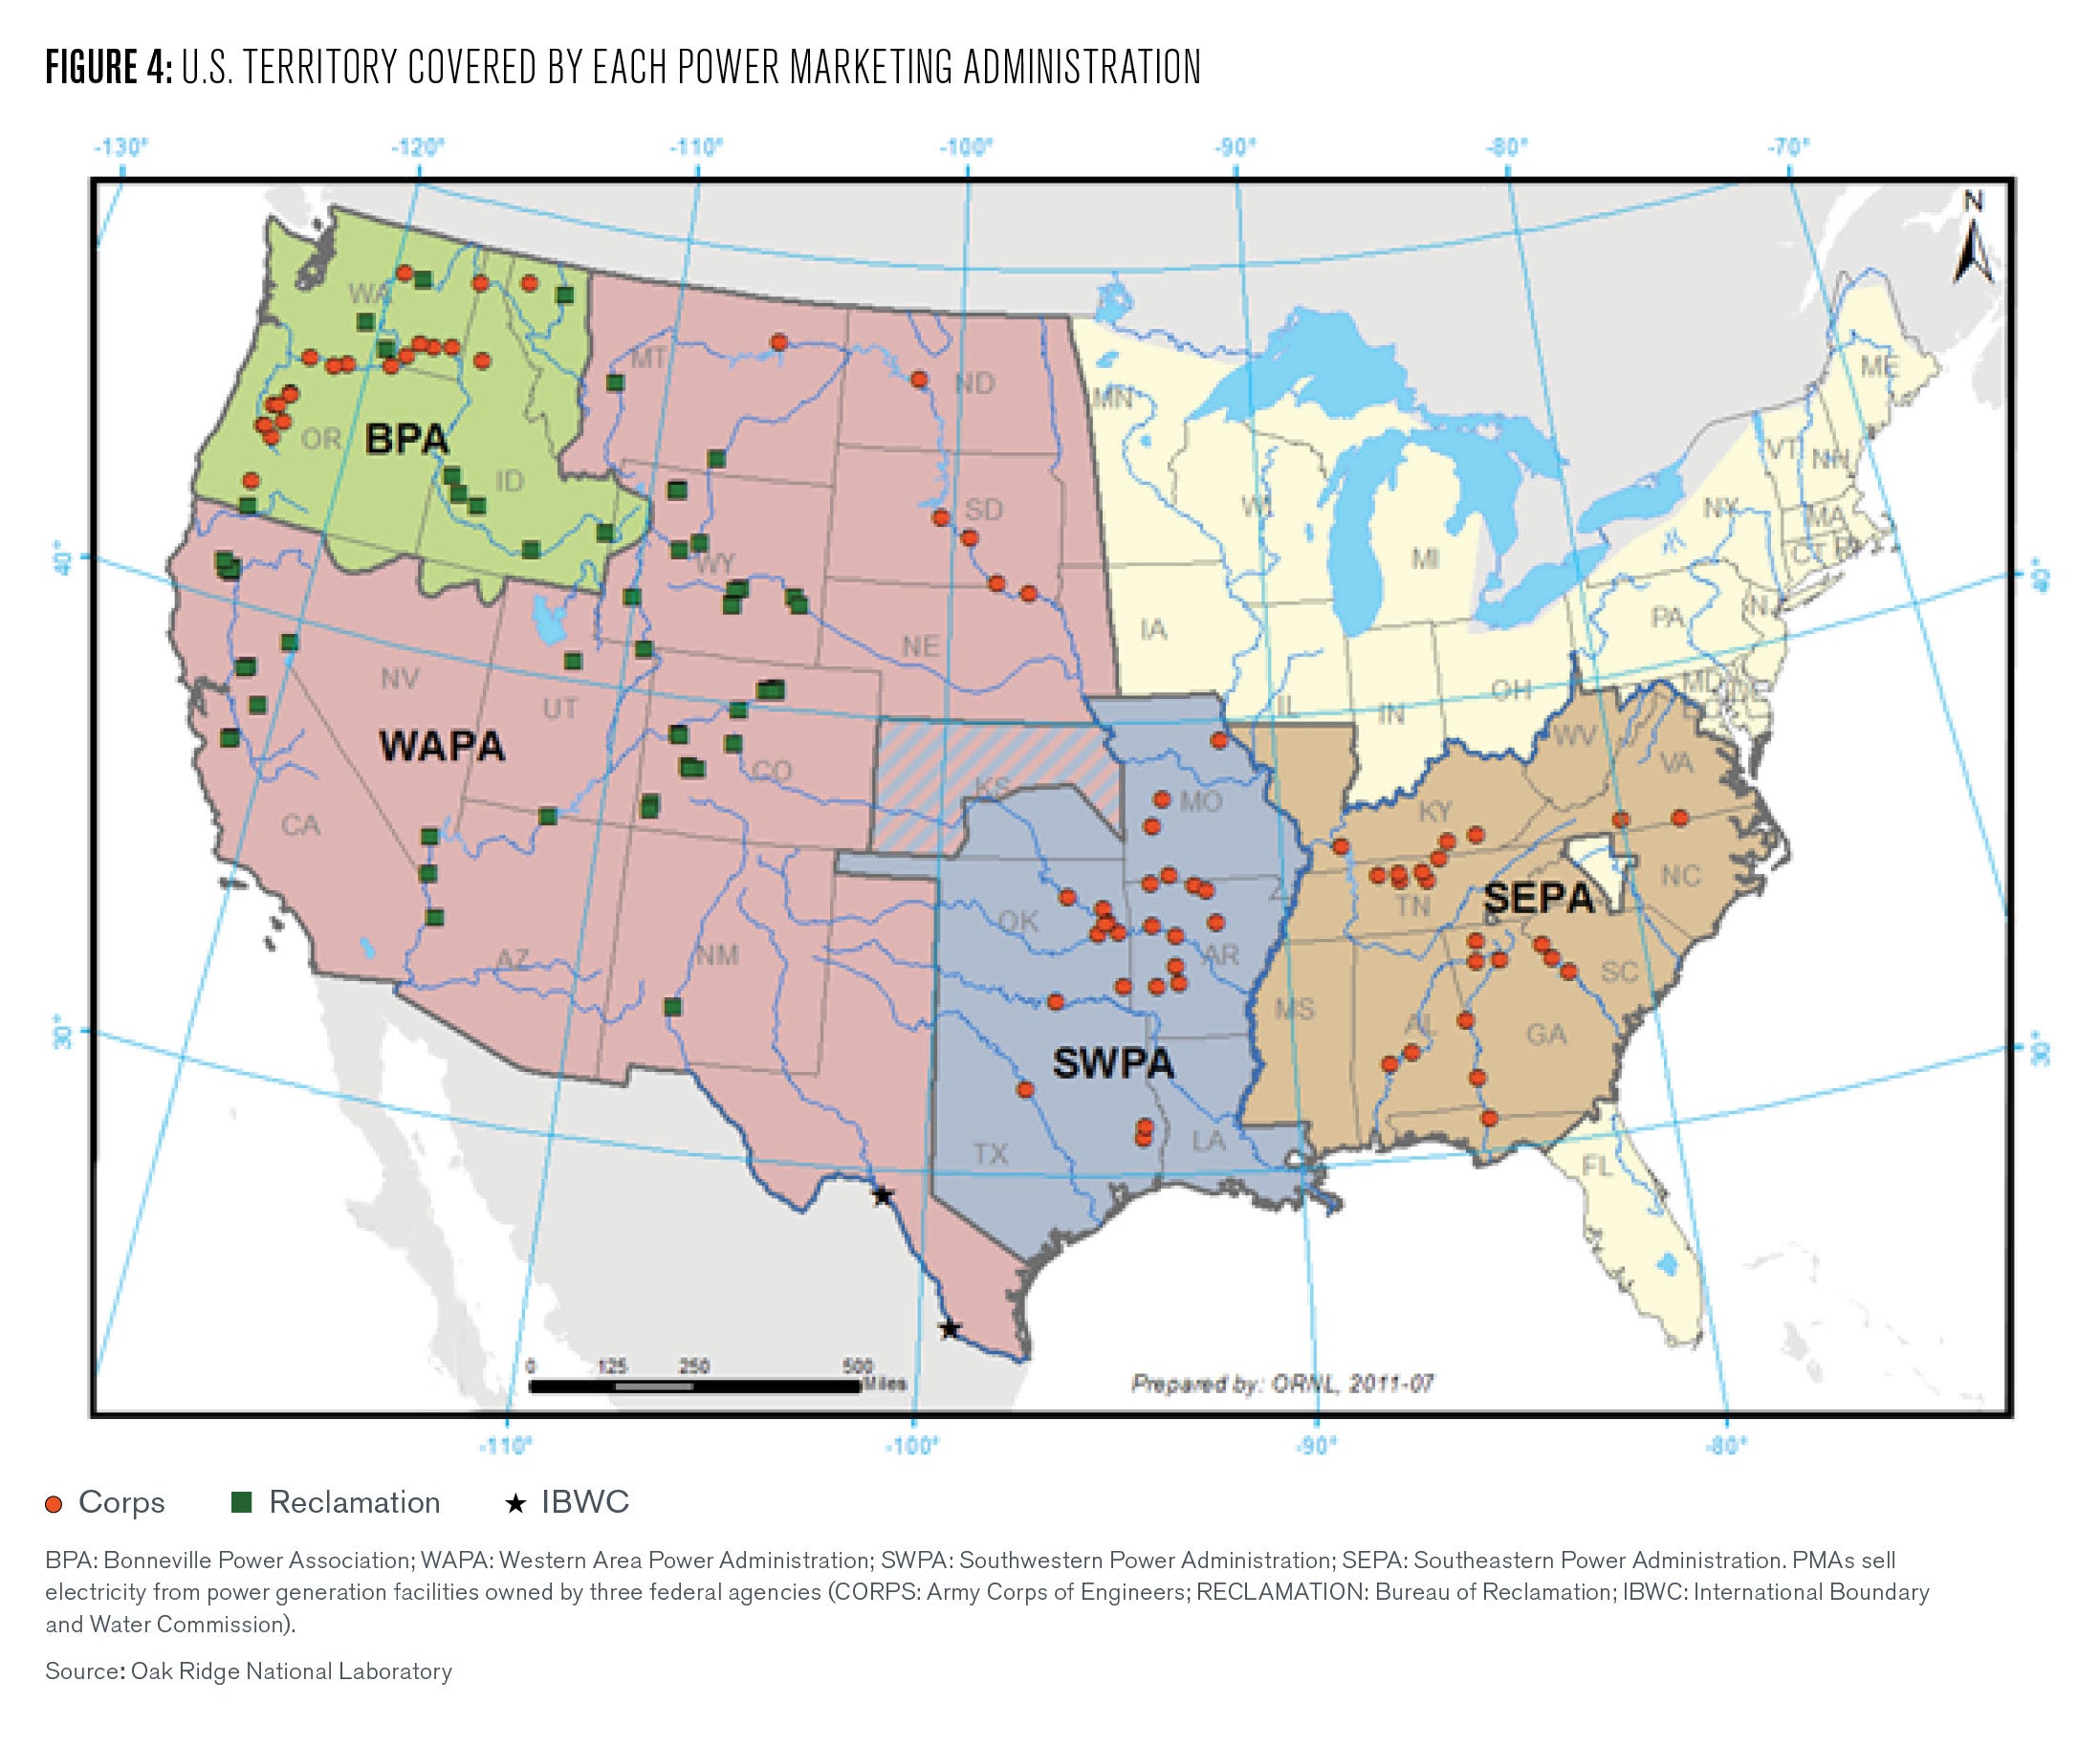
Another option would fund the expansion of nuclear capacity via five regional power marketing administrations (PMAs) (Bruenig 2019). These include the four PMAs that Congress created to sell federally owned hydropower and achieve rural electrification (Campbell 2019), in addition to a new PMA that covers U.S. territory not covered by the others (Figure 4). The five PMAs would be provided with the financing and legal mandate necessary to significantly expand zero-emissions energy capacity including nuclear energy, as well as build transmission infrastructure to support this expansion.
Market Incentives for Emissions-Free Energy
In addition to direct federal investment, providing market incentives to emissions-free generators commensurate with the carbon emissions they prevent, is an effective means to accelerate the decarbonization of the electric grid and encourage private investment in nuclear energy and other clean energy technologies.
One mechanism to provide such incentives is a direct tax on fossil fuel plants for each ton of carbon emissions. This tax would increase the cost of electricity generated from fossil fuels, thus giving emissions-free generators a sustained market advantage. A carbon tax policy is transparent and simple to design and enforce, but it has garnered timid political support partly due to its regressive effects (Gleckman 2021).
Another mechanism to incentivize emissions-free generation is a technology-neutral clean energy standard (CES) program, which compels utilities to source a predetermined share of their electricity from emissions-free producers. This share is enforced either through regulations or through a market-based system in which a limited number of emissions allowances are issued either for free or via an auction, and are subsequently traded between utilities to meet their clean generation targets (Center for Climate and Energy Solutions 2019). A well-designed CES program increases the share of clean electricity at predictable rates with the goal of reaching 100% emissions-free electricity at a predefined year, while preventing disruptions in energy markets and ensuring that retail electricity prices remain affordable.
While complex and opaque compared to a carbon tax, CES programs have enjoyed wide adoption at the state and local levels: thirty states and the District of Columbia have some form of CES in place (Barbose 2019; Center for Climate and Energy Solutions 2021). These programs have preserved several at-risk nuclear plants. For instance, CES programs in New York and Illinois have prevented the closure of six reactors, totaling about 5.7 GW of capacity (Nuclear Energy Institute 2018; U.S. Nuclear Regulatory Commission 2019).
Since many states have no carbon pricing policies in place or very timid decarbonization targets, a federal CES would provide much-needed certainty and consistency in the path to full decarbonization by 2035, while allowing more ambitious states such as Californica, Maine, and New York to set an even faster decarbonization pace (Barbose 2019).
A bill was introduced in 2019 to establish a technology-neutral market-based federal CES that would achieve full grid decarbonization by 2050, though it never received a vote (H.R.2597: Clean Energy Standard Act 2019). The provisions of this bill would avoid the retirement of 43 GW of nuclear capacity, while only raising average electricity rates by 4% (Picciano, Rennert, and Shawhan 2019). President Biden has endorsed a more ambitious version of this bill, aiming for full decarbonization by 2035, as part of his multi-trillion dollar infrastructure spending plan (McDonnell 2021).
Conclusion
The signs of climate change are already abundantly clear in the U.S.; from droughts and fires in Western states to violent storms along the East Coast. Nuclear energy, due to its safety, reliability, small land footprint, and zero carbon emissions, can effectively contribute to decarbonizing electricity generation, though it faces rising capital costs and competition from natural gas plants.
Continuous investment in the development and demonstration of small modular reactors, direct federal investment in the construction of new reactors and the modernization of existing reactors, and the provision of market incentives through carbon taxation or a clean energy standard would, combined, enable a much-needed increase in U.S. nuclear energy capacity. There is still hope that coupling the continued growth in renewable energy with an increase in nuclear capacity would allow the U.S. to phase out fossil fuel plants in time to effectively mitigate the most catastrophic effects of climate change.

Zakaria Hsain
Ph.D. Mechanical Engineering and Applied MechanicsZakaria Hsain holds a Ph.D. in mechanical engineering and applied mechanics from Penn and is a former Kleinman Center research assistant. He is a fellow at the Hydrogen and Fuel Cell Technologies Office at the U.S. DOE.

Alissa Johnson
Doctoral CandidateAlissa Johnson is a Ph.D. candidate in mechanical engineering and applied mechanics at the University of Pennsylvania, with a research focus on battery architectures and multifunctional energy storage systems.

Erin K. Reagan
Doctoral CandidateErin K. Reagan is a Ph.D. candidate in the Cell and Molecular Biology Graduate Group at the University of Pennsylvania, researching mRNA vaccine design for infectious disease. She is also president of the Penn Science Policy and Diplomacy group.
Acknowledgments
We are grateful to Angela Pachon, Dr. James R. Hines Jr., Dr. Shannon Wolfman, Jake Hoffman, and Stephen Mell for their valuable comments. We also thank Lindsey Samahon for copyediting.
Appendix
To generate the maps shown in figures 2 and 3, we used an online tool provided by the Energy Institute in the University of Texas at Austin (Energy Institute – UT Austin 2020). The tool produces a map of the mainland United States, with each county colored according to the energy technology which generates the least expensive electricity within it. The cost of various technologies is compared based on their levelized cost of electricity (LCOE) which is calculated using overnight capital cost, fuel price, plant lifetime, and discount rate (10 %), as well as other operating costs that vary by geographical location and energy technology (J. D. Rhodes et al. 2017).
We obtained estimates of the overnight capital cost for all energy technologies from the U.S. Energy Information Administration (U.S. Energy Information Administration 2020b), with the exception of estimates for the nuclear SMR which were obtained from a recent economic analysis (Black, Aydogan, and Koerner 2019).
Barbose, Galen. 2019. “U.S. Renewables Portfolio Standards: 2019 Annual Status Report.” https://emp.lbl.gov/publications/us-renewables-portfolio-standards-2.
Black, Geoffrey A., Fatih Aydogan, and Cassandra L. Koerner. 2019. “Economic Viability of Light Water Small Modular Nuclear Reactors: General Methodology and Vendor Data.” Renewable and Sustainable Energy Reviews 103 (December 2018): 248–58. https://doi.org/10.1016/j.rser.2018.12.041.
Bruenig, Matt. 2019. “Sanders Endorses ‘Green TVA’ Approach to Green New Deal.” People’s Policy Project. 2019. https://www.peoplespolicyproject.org/2019/08/22/bernie-sanders-endorses-green-tva-approach-to-green-new-deal/.
Bryan, Susan Montoya. 2021. “New Mexico Sues US over Proposed Nuclear Waste Storage Plans.” Associated Press, March 29, 2021. https://apnews.com/article/us-news-environment-new-mexico-nuclear-waste-3b9b5078e6d4661d6d4255200a5bcd55.
Caiazzo, Fabio, Akshay Ashok, Ian A. Waitz, Steve H.L. Yim, and Steven R.H. Barrett. 2013. “Air Pollution and Early Deaths in the United States. Part I: Quantifying the Impact of Major Sectors in 2005.” Atmospheric Environment 79: 198–208. https://doi.org/10.1016/j.atmosenv.2013.05.081.
Campbell, Richard J. 2019. “The Power Marketing Administrations : Background and Current Issues.” Washington, DC.
Center for Climate and Energy Solutions. 2019. “Clean Energy Standards: State and Federal Policy Options and Implications.” Arlington, VA. https://www.c2es.org/site/assets/uploads/2019/11/clean-energy-standards-state-and-federal-policy-options-and-considerations.pdf.
———. 2021. “Regional Greenhouse Gas Initiative (RGGI).” 2021. https://www.c2es.org/content/regional-greenhouse-gas-initiative-rggi/.
Chapin, Douglas M., Karl P. Cohen, W. Kenneth Davis, Edwin E. Kintner, Leonard J. Koch, John W. Landis, Milton Levenson, et al. 2002. “Nuclear Power Plants and Their Fuel as Terrorist Targets.” Science 297 (5589): 1997–99. https://doi.org/10.1126/science.1077855.
Cho, Adrian. 2019. “Smaller, Safer, Cheaper: One Company Aims to Reinvent the Nuclear Reactor and Save a Warming Planet.” Science 363 (6429). https://doi.org/10.1126/science.aax0771.
Clemmer, Steve, Jeremy Richardson, Sandra Sattler, and Dave Lochbaum. 2018. “The Nuclear Power Dilemma.” https://www.ucsusa.org/sites/default/files/attach/2018/11/Nuclear-Power-Dilemma-full-report.pdf.
Conca, James. 2018. “NuScale’s Small Modular Nuclear Reactor Passes Biggest Hurdle Yet.” Forbes. 2018. https://www.forbes.com/sites/jamesconca/2018/05/15/nuscales-small-modular-nuclear-reactor-passes-biggest-hurdle-yet/#6072f7d05bb5.
———. 2020. “Nuclear Regulatory Commission Shows Dry Cask Storage Is Safe – Yet Again.” Forbes. 2020. https://www.forbes.com/sites/jamesconca/2020/03/18/nuclear-regulatory-commission-shows-dry-cask-storage-is-safe–yet-again/?sh=7b5f13727470.
Cunningham, Stephen, and Jim Polson. 2017. “Two Half-Finished Nuclear Reactors Scrapped as Costs Balloon.” Bloomberg. 2017. https://www.bloomberg.com/news/articles/2017-07-31/scana-to-cease-construction-of-two-reactors-in-south-carolina.
Davis, J. 2018. “Radioactive Effluents from Nuclear Power Stations in the Community.” Washington DC. https://www.nrc.gov/docs/ML2032/ML20325A229.pdf.
Dewar, Dale, Linda Harvey, and Cathy Vakil. 2013. “Uranium Mining and Health.” Canadian Family Physician 59: 469–71. http://www.ncbi.nlm.nih.gov/pubmed/23673579%0Ahttp://www.pubmedcentral.nih.gov/articlerender.fcgi?artid=PMC3653646.
Dixon, Darius. 2013. “The $38 Billion Nuclear Waste Fiasco.” Politico, November 30, 2013. https://www.politico.com/story/2013/11/nuclear-waste-fiasco-100450.
Douglas, Erin. 2021. “Texas Lawmakers Want to Ban Dangerous Radioactive Waste. The Proposal Would Give a Nuclear Waste Company a Big Financial Break.” Texas Tribune, April 8, 2021. https://www.texastribune.org/2021/04/08/nuclear-waste-texas-ban/.
Eash-Gates, Philip, Magdalena M. Klemun, Goksin Kavlak, James McNerney, Jacopo Buongiorno, and Jessika E. Trancik. 2020. “Sources of Cost Overrun in Nuclear Power Plant Construction Call for a New Approach to Engineering Design.” Joule 4 (11): 2348–73. https://doi.org/10.1016/j.joule.2020.10.001.
Elliott, Rebecca, and Luis Santiago. 2019. “A Decade in Which Fracking Rocked the Oil World.” Wall Street Journal, December 17, 2019.
Energy Institute – UT Austin. 2020. “Levelized Cost of Electricity.” 2020. http://www.calculators.energy.utexas.edu/lcoe_map/#/county/tech.
Environmental and Energy Study Institute. 2019. “Fact Sheet: Fossil Fuel Subsidies: A Closer Look at Tax Breaks and Societal Costs.” 2019. https://www.eesi.org/papers/view/fact-sheet-fossil-fuel-subsidies-a-closer-look-at-tax-breaks-and-societal-costs#1.
Environmental Progress. 2021. “Historical Deaths from Nuclear Energy.” 2021. https://environmentalprogress.org/nuclear-deaths.
Fountain, Henry. 2017. “On Nuclear Waste, Finland Shows U.S. How It Can Be Done.” New York Times, June 9, 2017. https://www.nytimes.com/2017/06/09/science/nuclear-reactor-waste-finland.html.
Gleckman, Howard. 2021. “Some In the Environmental Justice Movement Oppose A Carbon Tax. That’s a Problem For Democrats.” Forbes, July 20, 2021. https://www.forbes.com/sites/howardgleckman/2021/07/20/some-in-the-environmental-justice-movement-oppose-a-carbon-tax-that-is-a-problem-for-democrats/?sh=5eb5e71f17d1.
Gormley, Rob, Jenn Sinkiewicz, and Brenna Wolfe. 2020. “License Renewals Could Modernize U.S. Nuclear; Supply Base Will Need to Keep Pace.” Power, August 2020. https://www.powermag.com/license-renewals-could-modernize-u-s-nuclear-supply-base-will-need-to-keep-pace/.
H.R.2597: Clean Energy Standard Act. 2019. Washington: 116th U.S. Congress. https://www.congress.gov/bill/116th-congress/house-bill/2597/text.
Hvistendahl, Mara. 2007. “Coal Ash Is More Radioactive Than Nuclear Waste.” Scientific American, December 2007. https://www.scientificamerican.com/article/coal-ash-is-more-radioactive-than-nuclear-waste/.
IAEA. 2004. “Implications of Power Uprates on Safety Margins of Nuclear Power Plants.” Vienna.
Ingersoll, D T, C Colbert, Z Houghton, R Snuggerud, J W Gaston, and M Empey. 2015. “Can Nuclear Power and Renewables Be Friends?” Proceedings of ICAPP, 9.
International Atomic Energy Agency. 2021. “Power Reactor Information System.” 2021. https://pris.iaea.org/PRIS/home.aspx#.
Larson, Aaron. 2019. “Extended Power Uprate Is a Winning Strategy for Nuclear Plant.” Power, November 2019. https://www.powermag.com/extended-power-uprate-is-a-winning-strategy-for-nuclear-plant/.
Larson, Eric, Chris Greig, Jesse Jenkins, Erin Mayfield, Andrew Pascale, Chuan Zhang, Joshua Drossman, et al. 2020. “Net-Zero America: Potential Pathways, Infrastructure, and Impacts.” https://netzeroamerica.princeton.edu/the-report.
Lovering, Jessica R, Arthur Yip, and Ted Nordhaus. 2016. “Historical Construction Costs of Global Nuclear Power Reactors.” Energy Policy 91: 371–82. https://doi.org/10.1016/j.enpol.2016.01.011.
Lyman, Edwin. 2013. “Small Isn’t Always Beautiful: Safety, Security, and Cost Concerns about Small Modular Reactors.” https://www.ucsusa.org/sites/default/files/2019-10/small-isnt-always-beautiful.pdf.
Mai, Trieu, Anthony Lopez, Matthew Mowers, and Eric Lantz. 2021. “Interactions of Wind Energy Project Siting, Wind Resource Potential, and the Evolution of the U.S. Power System.” Energy 223: 119998. https://doi.org/10.1016/j.energy.2021.119998.
McDonnell, Tim. 2021. “Biden’s Big Infrastructure Bill Could Doom the US Coal and Gas Energy Sector.” Quartz, March 2021. https://qz.com/1991269/what-bidens-infrastructure-bill-means-for-fossil-fuels/.
Nersisyan, Yeva, and L. Randall Wray. 2021. “Can We Afford the Green New Deal?” Journal of Post Keynesian Economics 44 (1): 68–88. https://doi.org/10.1080/01603477.2020.1835499.
Nuclear Energy Innovation and Modernization Act. 2019. U.S. https://www.congress.gov/bill/115th-congress/senate-bill/512.
Nuclear Energy Institute. 2018. “Zero-Emission Credits.” Washington. https://www.nei.org/CorporateSite/media/filefolder/resources/reports-and-briefs/zero-emission-credits-201804.pdf.
Nuclear Free Future Foundation, Beyond Nuclear, Rosa-Luxemburg-Stiftung, and International Physicians for the Prevention of Nuclear War. 2020. “Uranium Atlas: Facts and Data about the Raw Material of the Atomic Age.” https://beyondnuclearinternational.files.wordpress.com/2020/07/uraniumatlas_2020.pdf.
NuScale Power, LLC. 2020. “NuScale Wins U.S. DOE Funding for Its SMR Technology.” 2020. https://www.nuscalepower.com/about-us/doe-partnership.
OECD. 1993. “The Cost of High-Level Waste Disposal in Geological Repositories.” Paris.
Patel, Sonal. 2020. “GE Hitachi, TerraPower Team on Nuclear-Storage Hybrid SMR.” Power, September 2020. https://www.powermag.com/ge-hitachi-terrapower-team-on-nuclear-storage-hybrid-smr/.
Picciano, Paul, Kevin Rennert, and Daniel Shawhan. 2019. “Projected Effects of the Clean Energy Standard Act of 2019.” Washington. https://media.rff.org/documents/RFF-IB-19-03_CES_4.pdf.
Rhodes, Joshua D., Carey King, Gürcan Gulen, Sheila M. Olmstead, James S. Dyer, Robert E. Hebner, Fred C. Beach, Thomas F. Edgar, and Michael E. Webber. 2017. “A Geographically Resolved Method to Estimate Levelized Power Plant Costs with Environmental Externalities.” Energy Policy 102: 491–99. https://doi.org/10.1016/j.enpol.2016.12.025.
Rhodes, Richard. 2018. “Why Nuclear Power Must Be the Part of the Energy Solution?” Yale Environment 360, 2018. https://doi.org/10.1002/ep.13545.
S.4049: National Defense Authorization Act. 2020. 116th U.S. Congress. https://www.congress.gov/bill/116th-congress/senate-bill/4049/text.
Trehan, Narinder K. 2004. “Power Uprates in Nuclear Power Generating Stations.” In IEEE Symposium on Nuclear Science, 7:4596–98. IEEE. https://doi.org/10.1109/nssmic.2004.1466905.
U.S. Energy Information Administration. 2019. “Annual Energy Outlook 2019 with Projections to 2050.” https://www.eia.gov/outlooks/ieo/pdf/ieo2019.pdf
———. 2020a. “2019 Uranium Marketing Annual Report.” Washington, DC.
———. 2020b. “Capital Cost and Performance Characteristic Estimates for Utility Scale Electric Power Generating Technologies.” https://www.eia.gov/analysis/studies/powerplants/capitalcost/pdf/capital_cost_AEO2020.pdf.
———. 2020c. “Electric Power Monthly with Data for December 2019.” Washington.
———. 2020d. “How Much Carbon Dioxide Is Produced per Kilowatthour of U.S. Electricity Generation?” 2020. https://www.eia.gov/tools/faqs/faq.php?id=74&t=11.
———. 2020e. “What Is U.S. Electricity Generation by Energy Source?” 2020. https://www.eia.gov/tools/faqs/faq.php?id=427&t=3.
U.S. Interagency Working Group on Social Cost of Greenhouse Gases. 2016. “Technical Support Document: Technical Update of the Social Cost of Carbon for Regulatory Impact Analysis under Executive Order 12866.” Washington. https://19january2017snapshot.epa.gov/sites/production/files/2016-12/documents/sc_co2_tsd_august_2016.pdf.
U.S. Nuclear Regulatory Commission. 2014. “Safety Evaluation Report Related to Disposal of High-Level Radioactive Wastes in a Geologic Repository at Yucca Mountain, Nevada.” Vol. 3. https://www.nrc.gov/docs/ML1428/ML14288A121.pdf.
———. 2019. “2019-2020 Information Digest.” Washington. https://doi.org/10.1016/s0033-3506(52)80021-6.
———. 2020a. “2020-2021 Information Digest.”
———. 2020b. “U.S. Independent Spent Fuel Storage Installations.” 2020. https://www.nrc.gov/waste/spent-fuel-storage/map-fuel-storage-facilities.pdf.
U.S. Senate Appropriations Committee. 2020. “Energy and Water Development, 2020.” https://www.appropriations.senate.gov/imo/media/doc/EWD 2020.pdf.
Voosen, Paul. 2009. “How Long Can a Nuclear Reactor Last?” Scientific American, November 2009. http://www.scientificamerican.com/article.cfm?id=nuclear-power-plant-aging-reactor-replacement-.
Waldman, Scott. 2021. “Biden Sets 2035 as Goal to Decarbonize U.S. Electricity.” E&E News, April 1, 2021. https://www.eenews.net/climatewire/stories/1063728989/search?keyword=scott+waldman.
World Nuclear Association. 2019. “Safety of Nuclear Power Reactors.” 2019. http://www.world-nuclear.org/info/Safety-and-Security/Safety-of-Plants/Safety-of-Nuclear-Power-Reactors/#.UghCSj92FvA.
———. 2020a. “Processing of Used Nuclear Fuel.” 2020. https://www.world-nuclear.org/information-library/nuclear-fuel-cycle/fuel-recycling/processing-of-used-nuclear-fuel.aspx.
———. 2020b. “Small Nuclear Power Reactors.” 2020. https://www.world-nuclear.org/information-library/nuclear-fuel-cycle/nuclear-power-reactors/small-nuclear-power-reactors.aspx.
World Nuclear News. 2020. “NuScale and UAMPS Agreements Progress Plans for SMR Plant.” World Nuclear News. 2020. https://www.world-nuclear-news.org/Articles/NuScale-and-UAMPS-agreements-progress-plans-for-SM.
Zalk, John van, and Paul Behrens. 2018. “The Spatial Extent of Renewable and Non-Renewable Power Generation: A Review and Meta-Analysis of Power Densities and Their Application in the U.S.” Energy Policy 123: 83–91. https://doi.org/10.1016/j.enpol.2018.08.023.
