
In today’s financial markets, companies that claim to be "green" are rewarded. Empirical data shows that larger companies and companies in decline are prone to greenwashing. They don’t excel at reducing emissions; they excel at managing appearances.
At A Glance
Key Challenge
If companies that do not genuinely reduce their emissions continue to receive high ESG scores, the system designed to reward good behavior might inadvertently be enabling greenwashing.
Policy Insight
Firms should be ranked directly based on their emissions data. That data must be standardized and made more transparent—enabling more accurate comparisons across companies.
Introduction
In today’s financial markets and public institutions, companies that claim to be “green” or environmentally friendly are rewarded with tangible benefits. These rewards come in the form of increased investor confidence, lower costs of capital, and even direct inflows of investment. Recent evidence shows that mutual funds and institutional investors often shift capital toward companies labeled as sustainable. For example, research indicates that funds classified as having low sustainability ratings can experience significant capital outflows, whereas those with high ratings attract substantial inflows. Moreover, high environmental, social, and governance (ESG) scores seem to translate into higher company valuations and are factored into the decisions of public institutions such as pension funds, which are now setting net-zero emissions targets for their portfolios.
However, a perplexing issue arises when we examine the relationship between these ESG scores and a firm’s actual environmental performance. Despite the intuitive expectation that higher ESG scores would correspond with better environmental outcomes, the empirical evidence suggests that this is not always the case. Many large firms receive high environmental scores without necessarily reducing their pollution levels or emissions per unit of revenue. In some instances, firms that are in decline (as measured by reductions in market capitalization or overall size) paradoxically receive even higher environmental scores.
This discrepancy raises important questions about the reliability and meaning of ESG ratings. If companies that do not genuinely reduce their emissions continue to receive high scores, the system designed to reward true environmental improvements might inadvertently be enabling “greenwashing.” Greenwashing is the practice by which companies exaggerate or misrepresent their environmental efforts. They do so to appear more environmentally responsible than they truly are, thereby lowering their cost of capital and attracting investors who are focused on sustainable investments.
In this policy brief, I explain the empirical evidence, describe the underlying economic logic, and provide clear policy recommendations designed to mitigate greenwashing. Rather than relying on complex mathematical formulations and technical equations, the analysis and modeling are explained in everyday language.
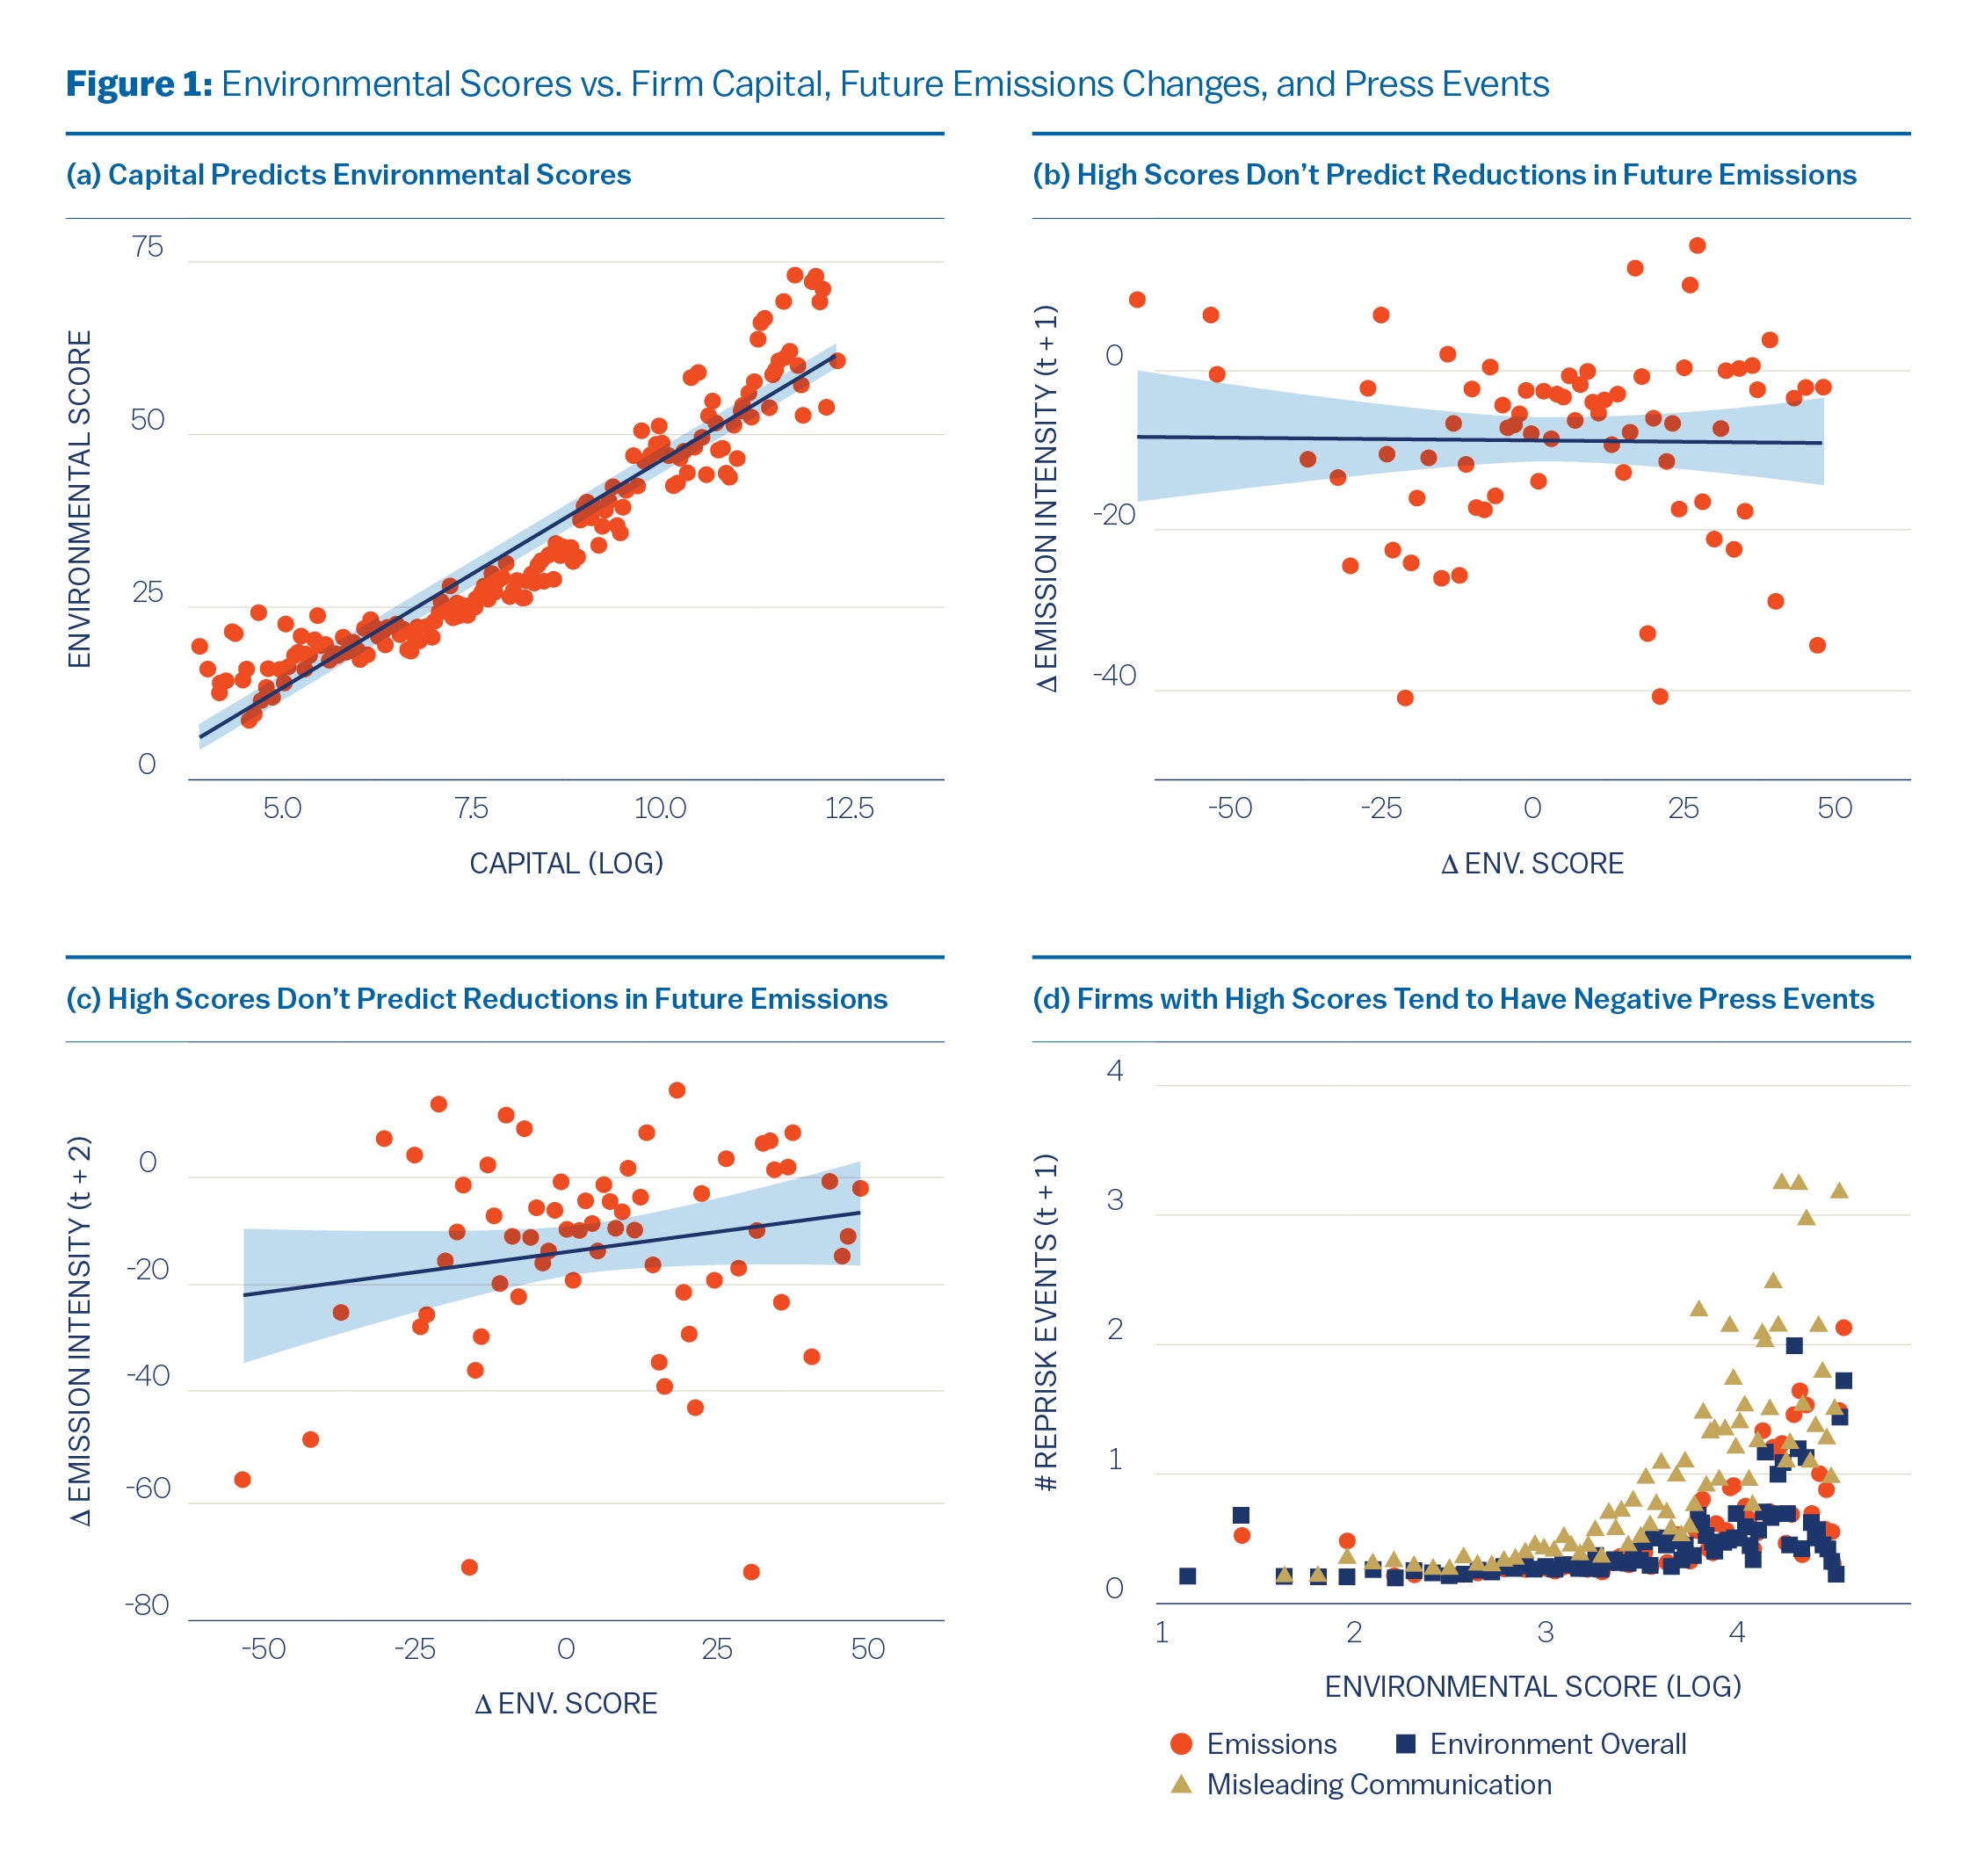
At the core of this discussion is the observation that firm size—whether measured by capital, market value, or revenue—is a strong predictor of a high environmental score, regardless of whether the firm is truly “green” in terms of its emissions. Statistical analyses of data collected over several years from reputable sources reveal that larger companies tend to receive higher environmental scores even when controlling for the level of emissions. Moreover, changes in a firm’s size over time have a significant impact on its environmental rating. In plain terms, a company that is declining in size may find it easier to create the appearance of environmental improvement even if its actual emissions remain high.
Further complicating matters, the data show that these high environmental scores do not reliably predict future reductions in emissions. In other words, a high score today does not guarantee that a company will lower its emissions in the following years. Additionally, when examining measures of corporate reputation—such as the frequency of negative news events or controversies related to environmental issues—there is evidence that firms with higher scores tend to attract more negative attention. This suggests that a high ESG score may be more indicative of effective public relations and financial engineering rather than genuine environmental stewardship.
The goal of this brief is to show that1 the current approach to ESG scoring is flawed and, in some cases, counterproductive for achieving real environmental benefits. When firms are rewarded for merely appearing green rather than for being green, the incentives for real environmental improvements are undermined. Consequently, financial rewards intended to spur the transition to a sustainable economy may instead be directed to companies that excel at managing appearances rather than reducing their actual environmental impact.
Descriptive Analysis of the Evidence
The empirical evidence for these concerns is drawn from several years of data collected from well-known rating agencies and databases that track ESG scores and emissions. The primary focus is on the environmental dimension of ESG scores, which typically range from 0 to 100. These scores are composite measures derived from a company’s self-reported information on various environmental issues, including emission reduction targets, policies, and initiatives. Throughout this brief—and in the underlying empirical work—all ESG scores refer exclusively to the S&P Global CSA scores. While one may conjecture that similar patterns may hold for other common providers (e.g. MSCI, Sustainalytics), such extensions lie beyond the scope of the present analysis.
Firm Size and Environmental Scores
One of the most striking observations is that larger firms tend to receive higher environmental scores. Analyses show that measures of firm size—whether total capital, market value, or revenue—consistently and robustly predict high environmental ratings. This relationship persists even after adjusting for the level of emissions. In plain language, if you compare a large company with a smaller one, and adjust for differences in their production scale (for instance, by looking at emissions per unit of revenue), the larger company is more likely to score better on the environmental index.
This pattern suggests that the scoring process may be biased in favor of larger companies. Larger firms typically have more resources available to invest in public relations, sophisticated reporting mechanisms, and specialized consulting services that help them navigate and possibly manipulate the ESG evaluation process. Thus, their higher scores might reflect their ability to manage perceptions rather than a true measure of their environmental performance.
Changes in Firm Size and Their Impact on Scores
Another intriguing finding is the significant role played by changes in a company’s size over time. Companies experiencing a reduction in size—for example, those that are losing market capitalization—tend to receive higher environmental scores. One explanation for this phenomenon is that firms in decline may find it easier to overemphasize or embellish minor improvements in their emissions. When a company is already facing challenges related to shrinking size, even a small reported reduction in emissions can be highlighted and magnified in the scoring process. This leads to an unusually high environmental rating that does not necessarily correspond to a substantial or sustainable improvement in environmental performance.
This observation calls into question the reliability of the environmental score as an indicator of a firm’s long-term commitment to reducing emissions. It appears that the scoring system might be capturing short-term or superficial changes rather than true, lasting improvements.
The Disconnect Between Scores and Future Emissions
A central expectation of any environmental rating system is that a high score should be an indicator of future improvements. Ideally, companies that score well on environmental metrics should continue to reduce their emissions over time. However, the data do not support this expectation. An analysis comparing current environmental scores with subsequent emissions levels reveals no statistically significant relationship. That is, companies with high environmental scores are not more likely to lower their emissions in the future than companies with lower scores.
This finding is critical because it undermines the very purpose of the ESG scoring system. If high environmental scores do not translate into real-world environmental benefits in the long run, then the system might be rewarding companies for appearance rather than for meaningful change.
Negative Publicity and Misleading Communication
Another important aspect of the evidence is the relationship between high environmental scores and the incidence of negative news events related to environmental issues. Data tracking corporate controversies and negative publicity indicate that firms with high scores are more likely to be associated with events such as misleading communication, environmental mishaps, and other controversies. This might seem counterintuitive; one would expect that companies with strong environmental performance would avoid such negative attention. Instead, the data suggest that high scores are linked to a higher likelihood of incidents that point to possible greenwashing.
In simple terms, although a company may appear to be environmentally responsible based on its high ESG score, this may be a result of sophisticated image management rather than actual operational improvements. The inconsistency and variability in the reported emissions data add further credence to this interpretation, as companies with high scores often exhibit greater fluctuations in their reported environmental performance. Such “noisy” reporting makes it difficult for investors and regulators to ascertain the true level of a company’s environmental impact.
Assessing the Consistency of Emissions Reporting
One way to evaluate the reliability of reported emissions is to look at how consistent the data are over time. I find that larger companies—which generally receive higher environmental scores—tend to show more variability in their reported emissions figures. This variability is not fully explained by real changes in operations; rather, it may indicate that these companies are altering the way they report their emissions. Such fluctuations complicate efforts to determine which companies are genuinely improving their environmental performance and which are engaging in greenwashing.
Explaining the Underlying Model in Plain Language
To better understand the dynamics behind greenwashing, it is helpful to describe a conceptual model that captures the main ideas without relying on technical formulas. The model considers how companies, investors, and regulators interact in an environment where climate change poses significant risks.
Types of Capital and Their Environmental Impact
In the model, every company is assumed to possess two types of capital:
- Green Capital: This represents investments and assets that are environmentally friendly. Examples include renewable energy installations, energy-efficient machinery, and sustainable production technologies. While green capital has environmental benefits, it is generally considered to be less productive in the sense that it may not generate output as efficiently as other forms of capital.
- Brown Capital: This refers to assets that are more traditional and productive but are associated with higher Brown capital includes older technologies, fossil fuel-based equipment, and production processes that lead to significant pollution.
Under normal economic conditions (a good climate state), firms use a mix of green and brown capital to produce goods and services. However, the risk of climate change introduces uncertainty. In the event that the negative impacts of climate change become severe, governments are likely to intervene by imposing measures such as carbon taxes. These measures are designed to discourage the use of brown capital by increasing its cost. Consequently, firms that have invested more heavily in green capital are less adversely affected by such measures and are thus better positioned in a bad climate state.
Investor Perception and the Challenge of Noisy Data
Investors are keenly interested in understanding a company’s environmental performance because they want to hedge against the risks associated with climate change. In a world where government policies such as carbon taxes may suddenly come into effect, a firm that is truly green will be less exposed to these risks. However, investors face a challenge: they cannot directly observe the composition of a company’s capital (i.e., the exact proportions of green versus brown capital). Instead, they rely on the emissions data that companies report publicly.
The problem is that the reported emissions data are “noisy.” In everyday language, this means that the numbers published by companies are subject to random fluctuations, measurement errors, and sometimes deliberate manipulation. Investors are aware of this noise and, as a result, use a mental or statistical filtering process to try to extract the true underlying environmental performance from the reported data. This filtering process is akin to trying to hear a friend’s voice in a noisy room: you have to distinguish the true signal from the background noise.
The Incentive for Greenwashing
Because investors base their decisions on the filtered estimates of a company’s environmental quality, companies have a strong incentive to manipulate the data in their favor. Greenwashing, in this context, refers to the deliberate distortion of the reported emissions data so that the estimates derived by investors suggest that the company is greener than it actually is. This manipulation is particularly attractive for large companies and those experiencing declines in size, as the benefits of appearing environmentally responsible (such as lower borrowing costs and higher market valuations) can be substantial.
To illustrate, imagine a large company that is facing declining market capitalization. Rather than investing heavily in costly new green technologies, the company might choose instead to adjust its reporting practices. By emphasizing minor improvements or by altering the way emissions are reported, the company creates the appearance of environmental progress. Investors, using their filtering process, then interpret these manipulated figures as evidence of genuine improvement, leading to a better valuation and lower cost of capital for the firm.
The Filtering Process in Everyday Terms
The process used by investors to assess a company’s true environmental performance from noisy emissions data can be compared to trying to watch a movie on a low-quality screen. Imagine that you are watching a film, but the picture is grainy and full of static. Even though you can see the general outline of the story, the details are obscured by the noise. If someone were to manipulate the signal—say, by boosting the brightness or contrast—you might be led to believe that the film is of higher quality than it actually is. Similarly, when companies engage in greenwashing, they alter the “signal” in the reported data. Investors, using their standard methods to filter the noise, end up with an overoptimistic view of the company’s environmental performance.
This manipulation of information undermines the purpose of ESG ratings. Instead of reflecting real, substantive environmental improvements, high scores may simply be the result of sophisticated image management. The outcome is a system in which financial rewards are decoupled from actual performance, ultimately weakening the incentives for companies to invest in genuine environmental sustainability.
Policy Recommendations
In light of the evidence and the dynamics described above, it is clear that significant policy reforms are needed to address the problem of greenwashing and ensure that ESG scores truly reflect environmental performance. The following policy recommendations are designed to reduce the opportunities for companies to engage in deceptive practices and to better align financial incentives with real improvements in environmental quality.
Rank Firms Directly by Their Emissions Data
The first recommendation is to simplify the evaluation process by ranking firms directly on the basis of their emissions data rather than relying on complex ESG scoring systems. The current process of deriving ESG scores involves multiple layers of aggregation—from survey responses to composite indices—which leaves ample room for interpretation and manipulation. By focusing directly on emissions figures, investors and regulators can cut through the complexity and reduce the potential for greenwashing. A direct ranking system would limit companies’ ability to use sophisticated reporting techniques to obscure their true environmental impact.
Improve and Standardize Emissions Reporting
A major contributor to the current problems is the lack of standardization in how companies report their emissions. Today, firms use a variety of methods and frameworks to measure and disclose their emissions, leading to inconsistencies that make it difficult to compare performance across companies. Regulatory bodies, such as the Securities and Exchange Commission (SEC), should mandate a uniform reporting framework for emissions. This would require all companies to report their data using standardized definitions, measurement methods, and reporting periods. With consistent and transparent data, investors would be better able to assess which companies are truly making progress toward reducing their environmental impact, and the opportunities for greenwashing would be significantly reduced.
Mandate Full Disclosure of ESG Scoring Methodologies
Currently, many ESG rating agencies do not fully disclose the methods and weightings used to calculate their scores. This lack of transparency makes it difficult for investors, regulators, and even the companies themselves to understand why certain firms are rated more highly than others. To address this issue, regulators should require that ESG rating agencies provide full disclosure of their scoring methodologies. Such transparency would not only improve the reliability of the scores but would also allow for more meaningful comparisons across different agencies. With clear information about how scores are derived, stakeholders can better evaluate whether a high score truly reflects superior environmental performance or is merely the result of sophisticated reporting techniques.
Enforce Penalties for Greenwashing
One of the most troubling aspects of the current system is that high environmental scores do not correlate with future improvements in emissions. This discrepancy suggests that many firms are benefiting from high scores without undertaking substantive changes in their operations. To deter greenwashing, it is essential to introduce enforceable penalties for companies found to be deliberately misrepresenting their environmental performance. Such penalties could include financial fines, regulatory sanctions, or other punitive measures that increase the cost of greenwashing. By making the consequences of deceptive reporting significant, policymakers can incentivize firms to invest in genuine environmental improvements rather than merely managing their public image.
Encourage Long-Term Environmental Commitments and Innovation
While it is crucial to address the problem of greenwashing in the short term, policy reforms should also promote long-term commitments to environmental sustainability. Governments
and regulators should create incentives for companies to make substantial, long-term investments in green technologies and innovations. This could involve tax incentives, grants for research and development, or public-private partnerships aimed at advancing sustainable technologies. Moreover, companies should be encouraged to disclose their long-term environmental strategies and the investments they are making in green capital. By shifting the focus from short-term image management to long-term performance, policymakers can ensure that financial rewards are aligned with real progress in reducing environmental impact.
Increase Stakeholder Engagement and Transparency
Finally, increasing stakeholder engagement in the ESG evaluation process can help reduce the opportunities for greenwashing. Investors, customers, and civil society organizations should have greater access to detailed information about a company’s environmental performance and the methodologies used to assess it. Enhanced transparency and accountability would not only discourage deceptive practices but would also empower stakeholders to hold companies accountable for their environmental commitments. This, in turn, would create a more robust and credible system for measuring and rewarding true environmental performance.
Long-Term Benefits of Improved ESG Reporting
Implementing the above policy recommendations is not only critical for reducing greenwashing in the short term but also has far-reaching benefits for the economy and the environment over the long term. By ensuring that ESG scores accurately reflect genuine environmental performance, several important outcomes can be achieved:
- More Efficient Capital Allocation: Investors rely on ESG scores to identify companies that are better positioned to succeed in a future where climate change and environmental regulations play a significant Accurate and reliable scores will lead to a more efficient allocation of capital, directing resources toward companies that are truly committed to sustainability.
- Enhanced Market Discipline: When firms know that their reported environmental performance will be scrutinized under a standardized and transparent system, they will have stronger incentives to invest in real improvements rather than engaging in superficial reporting. This market discipline will ultimately drive higher standards of environmental performance across industries.
- Strengthened Regulatory Oversight: With clearer, standardized, and more transparent data, regulators will be better equipped to monitor corporate behavior and enforce environmental regulations. This enhanced oversight will reduce the incidence of greenwashing and ensure that companies adhere to their stated environmental commitments.
- Increased Consumer and Investor Confidence: Reliable ESG reporting will help restore trust in the sustainability claims made by companies. Consumers and investors who are increasingly concerned about climate change will be more confident in directing their spending and investment decisions toward firms that are genuinely making a
- Accelerated Innovation in Green Technologies: By rewarding companies that invest in long-term green innovation, improved ESG reporting can foster an environment in which technological advancements are encouraged. This will accelerate the development and adoption of cleaner technologies, ultimately contributing to a more sustainable future.
Further Reflections and Future Directions
While the recommendations outlined above represent significant steps toward mitigating greenwashing, it is important to recognize that this is an evolving field. As our understanding of environmental risks and sustainable practices improves, so too must the frameworks used to assess and incentivize corporate performance.
Future research should continue to explore the relationship between ESG ratings, firm behavior, and environmental outcomes. In particular, more work is needed to understand the mechanisms through which companies manipulate reported data and to develop more robust methods for detecting and deterring such practices. Additionally, as new technologies emerge for monitoring and reporting environmental performance, regulators and investors will need to adapt their approaches accordingly.
It is also essential that policymakers and market participants remain engaged in an on- going dialogue about the best ways to measure and reward true environmental performance. Collaboration between industry experts, academic researchers, regulatory bodies, and civil society will be key to developing and refining the tools and standards needed for a transparent and effective ESG reporting system.
In conclusion, the challenge of greenwashing is a complex one that sits at the intersection of finance, technology, and public policy. Addressing it requires not only technical improvements in data collection and analysis but also a concerted effort to align market incentives with long-term environmental sustainability. The policy recommendations presented in this brief offer a roadmap for such an effort, pointing the way toward a future in which corporate green claims are backed by genuine, measurable progress.
By implementing these changes, we can help ensure that investments in green initiatives truly contribute to the mitigation of climate change. In the end, a more accurate, transparent, and accountable ESG reporting system will benefit not only investors and companies but also society as a whole—driving the transition to a more sustainable and resilient global economy.

Joseph Huang
Ph.D. Candidate in Economics, SASJoseph Huang is a PhD candidate at in economics at the University of Pennsylvania. He is also a Kleinman Center 2023-2024 grant recipient.
Author’s note: This policy digest is based on my forthcoming paper Macroeconomic Consequences of Greenwashing. I am enormously grateful for the invaluable guidance and support from my committee members Jesús Fernández-Villaverde, Dirk Krueger, and Hal Cole. I am especially indebted to Lars Hansen, Mike Barnett, Amy Boonstra, Fabrice Tourre, Paymon Khorrami, Diana Petrov, and Ruimeng Hu, whose mentorship, advice, and encouragement have been pivotal throughout my academic journey. I also appreciate the comments from and discussions with Buz Brock, Ornella Darova, José Víctor Ríos Rull, Marlon Azinovic, Alessandro Dovis, Jordan Peeples, Ozgur Seker, Simon Scheidegger, Marcus Tomaino, Basil Halperin, and Pete Vilter. I thank the participants at the Macro Student Talk and Macro Lunch groups at the University of Pennsylvania. I acknowledge the financial support from Kleinman Center for Energy Policy a the University of Pennsylvania.
Empirical Evidence
I present five facts regarding the discrepancy between high environmental scores and environmental performance. These facts guide the development of my model and serve as a reference point for its evaluation.
Data. I use ESG scores and emissions data from S&P Global, a rating agency that started to give out ESG scores in 2013 and provides emissions data through its Trucost division. S&P Global’s influence can be seen in its widespread adoption by major financial institutions, including BlackRock and Vanguard, the two largest asset managers globally. It is also well-studied by academics such as Berg, Kolbel, and Rigobon (2019); Bolton and Kacperczyk (2021); and Hartzmark and Shue (2022).
An ESG score, which ranges from 0 to 100, is a composite metric that evaluates a firm’s performance across its environmental, social, and governance dimensions. Firms’ ESG credentials are assessed through S&P Global’s annual Corporate Sustainability Assessment (CSA), wherein a selected group of invited companies provide comprehensive disclosures on their operations and practices. Questions range from emission targets, measures taken to achieve these targets, CEO’s compensation, etc. Question-level scores are aggregated into criteria-level scores for the most material ESG themes per industry, which are then combined into separate environmental, social, and governance dimension scores. In this paper, I focus on the environmental (E) dimension. Going forward, unless otherwise specified, scores refer to the environmental scores.
Trucost’s firm-level data includes both direct (scope 1) and indirect (scopes 2 and 3) emissions. Scope 1 emissions are those emitted directly from sources controlled or owned by the company, while scope 2 emissions cover indirect emissions from the generation of purchased electricity consumed by the company. Scope 3 emissions include all other indirect emissions that occur in a company’s value chain, such as those associated with the production and transportation of purchased goods and services. I will focus on scopes 1 and 2 as in
Hartzmark and Shue (2022), since they are the scopes that firms have control over. The Trucost data is compiled through a combination of self-reported information and proprietary estimation models. In addition, I will use emission intensity, or emissions scaled by total revenue, to adjust for firm size, since larger firms may emit more solely due to their scale.
Data on firms’ fundamentals are obtained from Compustat, as is standard in the literature. The frequency of analysis is annual and the coverage only includes firms in the U.S. Lastly, I use data from RepRisk to characterize negative events (such as bad press) associated with greenwashing. RepRisk is a leading data science company that systematically captures and analyzes risk incidents related to environmental, social, and governance (ESG) issues from public sources and news media (Twitter, Facebook, press releases, earnings calls, news channels, etc.). Categories of risk incidents include misleading communication and emissions. Glossner (2017) uses RepRisk data to measure ESG risk and finds that statistically significant impact on the returns of firms with high ESG risk, suggesting that RepRisk captures materially negative events.
Below, I illustrate the five facts. My sample covers all the U.S. publicly traded firms that are given an ESG score by S&P Global from 2013 to 2023 across all industries. All regression standard errors are heteroskedasticity-consistent HC1 errors, clustered at the firm and year levels.
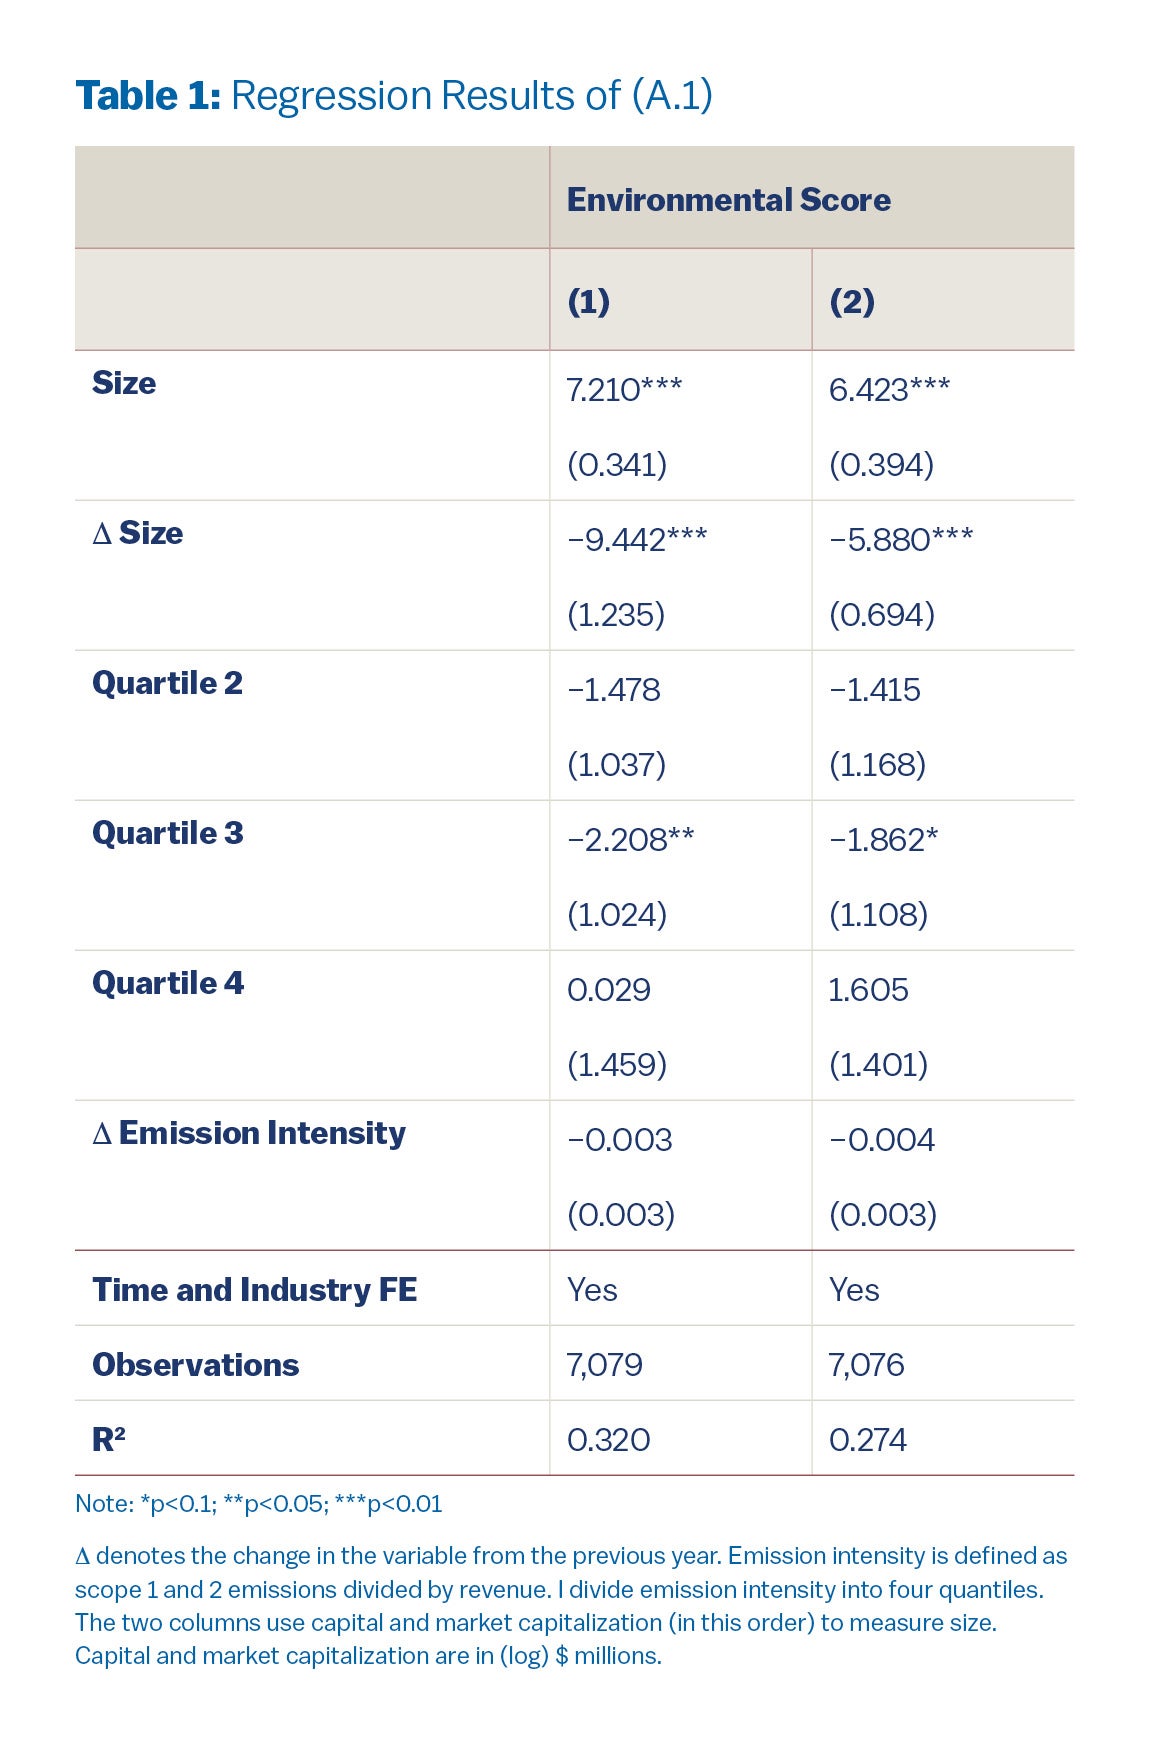
Fact 1: larger firms tend to have higher scores. Firm size, measured by capital or market equity, is a strong predictor of scores. The positive association between firm size and environmental score is statistically significant and robust to various controls. To show this, I regress scores on size and, in addition, change in size, the four quartiles of emission intensity and change in emission intensity from the previous year, all on the firm level. Quartiles are determined by fixing firms’ industry and reported year. Specifically, I estimate the following regression:

where i denotes each firm and t each year. sizeit is either capital or market capitalization (in logs). I use two different measures of size for robustness. Industry fixed effects are included partly to control for the relative importance of the environmental score in the composite ESG score.
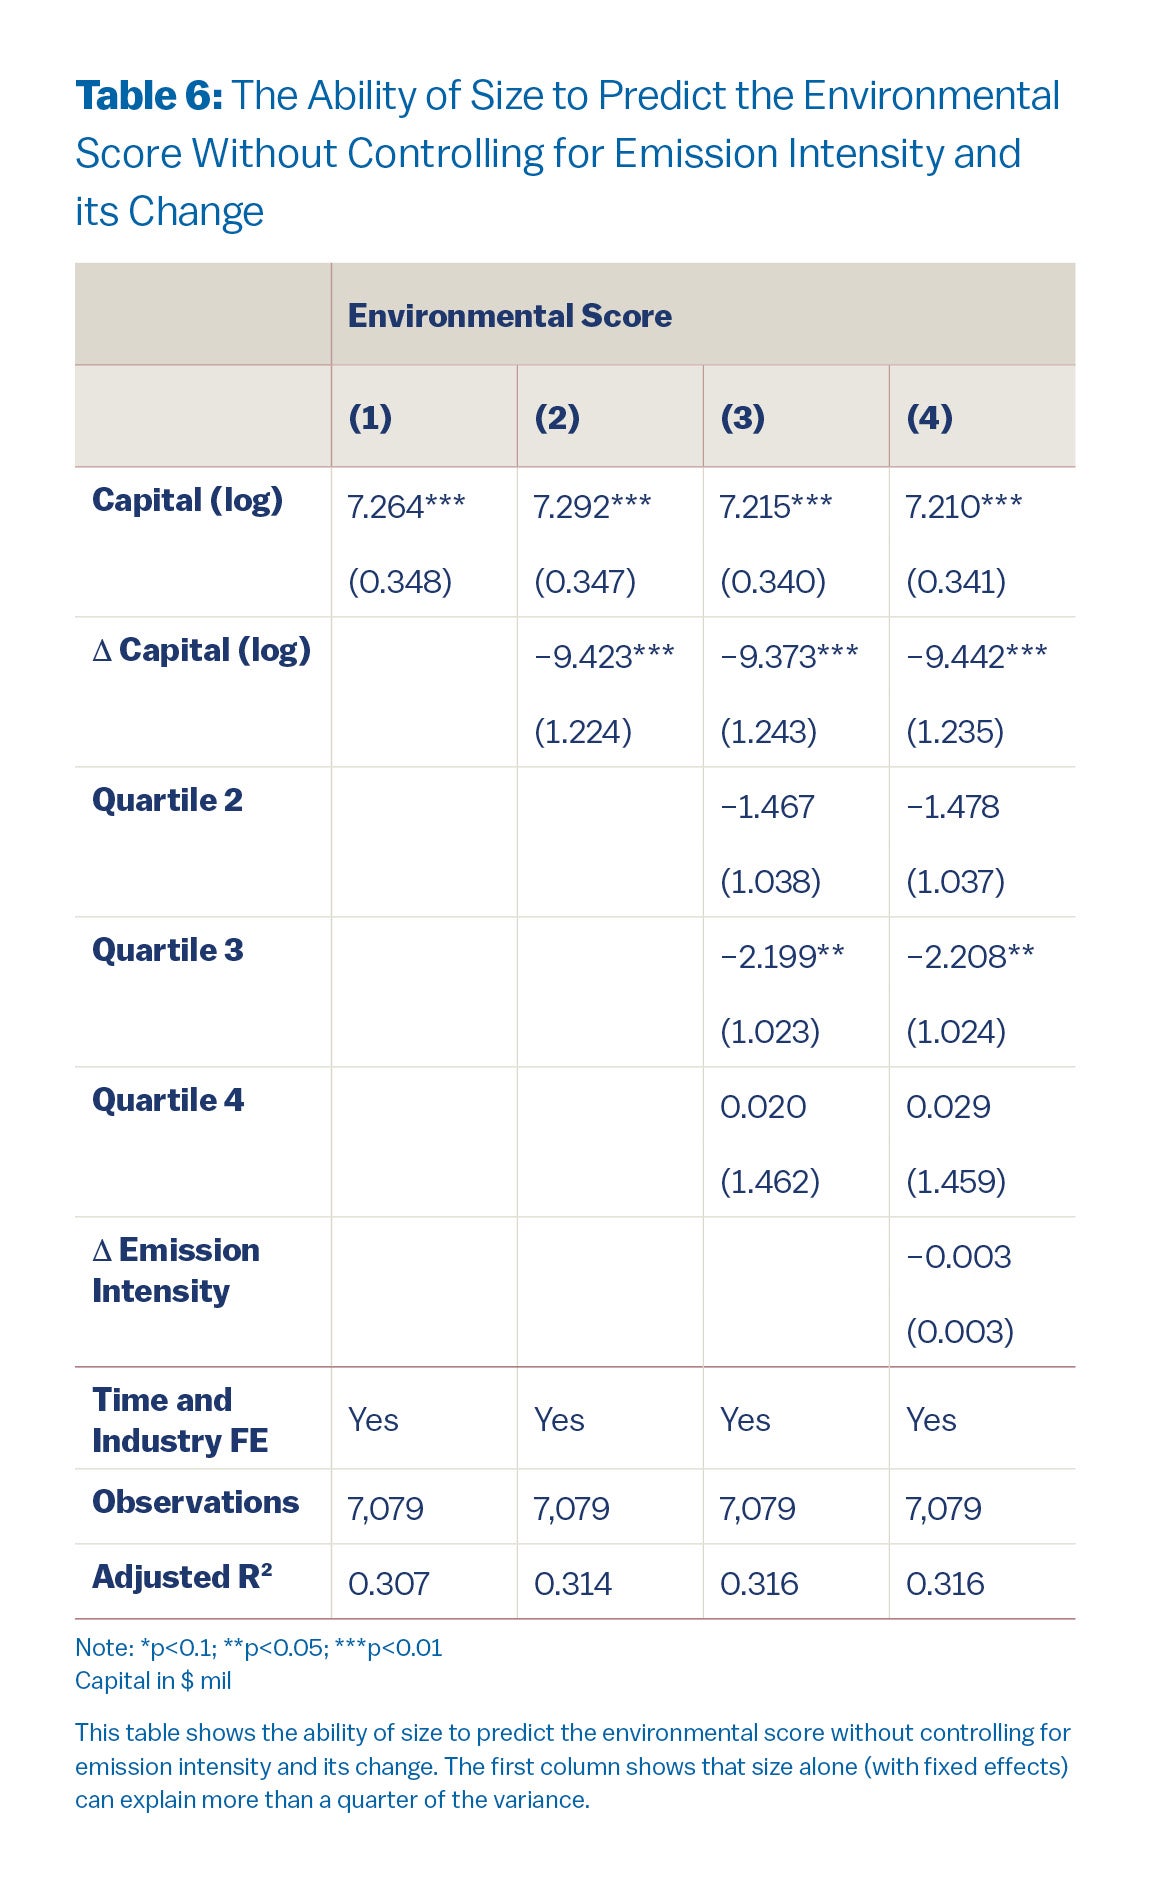
The regression results are summarized in Table 1 for all three measures of size. A few remarks are in order. First, size is a strong predictor of the environmental score, even after controlling for fixed effects and the aforementioned regressors. The statistical significance is robust to both measures of size. With fixed effects, size alone can explain 30% of the variance (Table 6). Second, firms’ improvement (or lack thereof) in emission intensity doesn’t contribute to its environmental scores. Furthermore, the effect of firms’ current emission intensity (i.e. the coefficients on quartiles) on their scores are ambiguous and non-robust (significance levels are non-monotonic). In summary, regression results in Table 1 provide evidence that larger firms receive higher scores, after controlling for its environmental credentials measured by emissions.
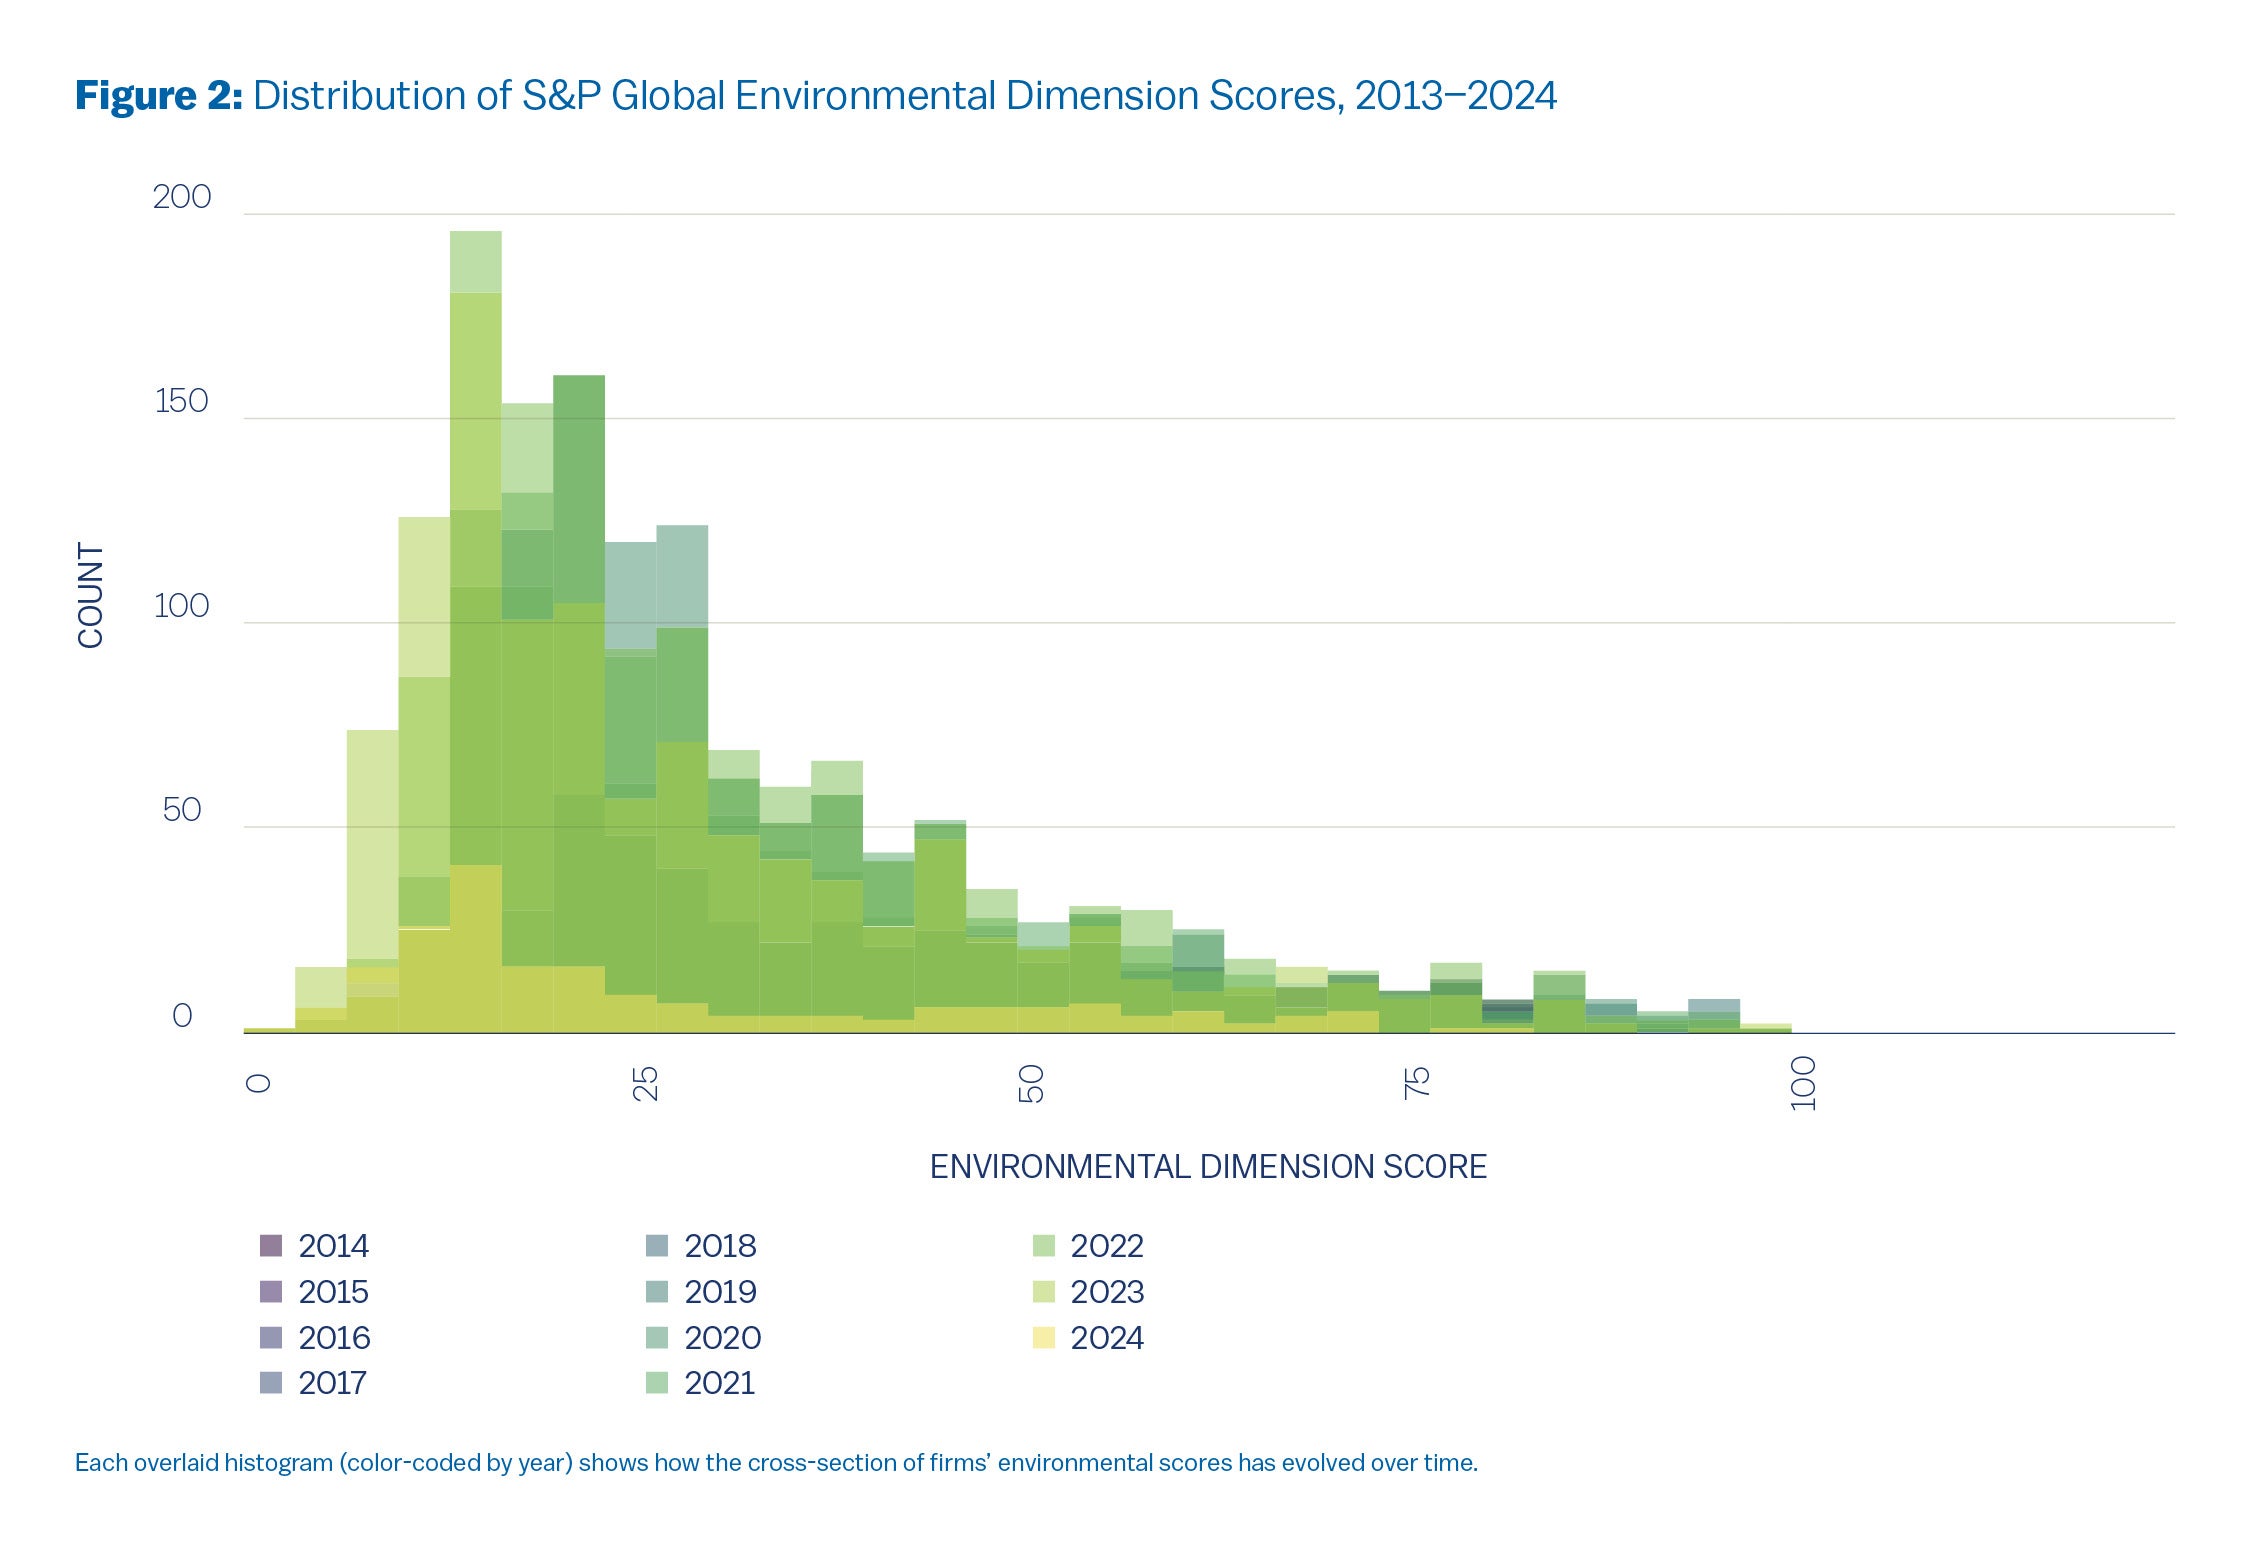
To understand the significance of the effect of size on scores, consider that in any given year the middle 50% of firms’ environmental scores span roughly 15 points (Figure 2). A 7-point boost—what the regression attributes to a 1% increase in capital—therefore corresponds to nearly half of that inter-quartile range.
Fact 2: declining firms have higher scores. Another robust and significant predictor of environmental scores in Table 1 is change in firm size. Firms that disinvest or lose market capitalization have higher scores.
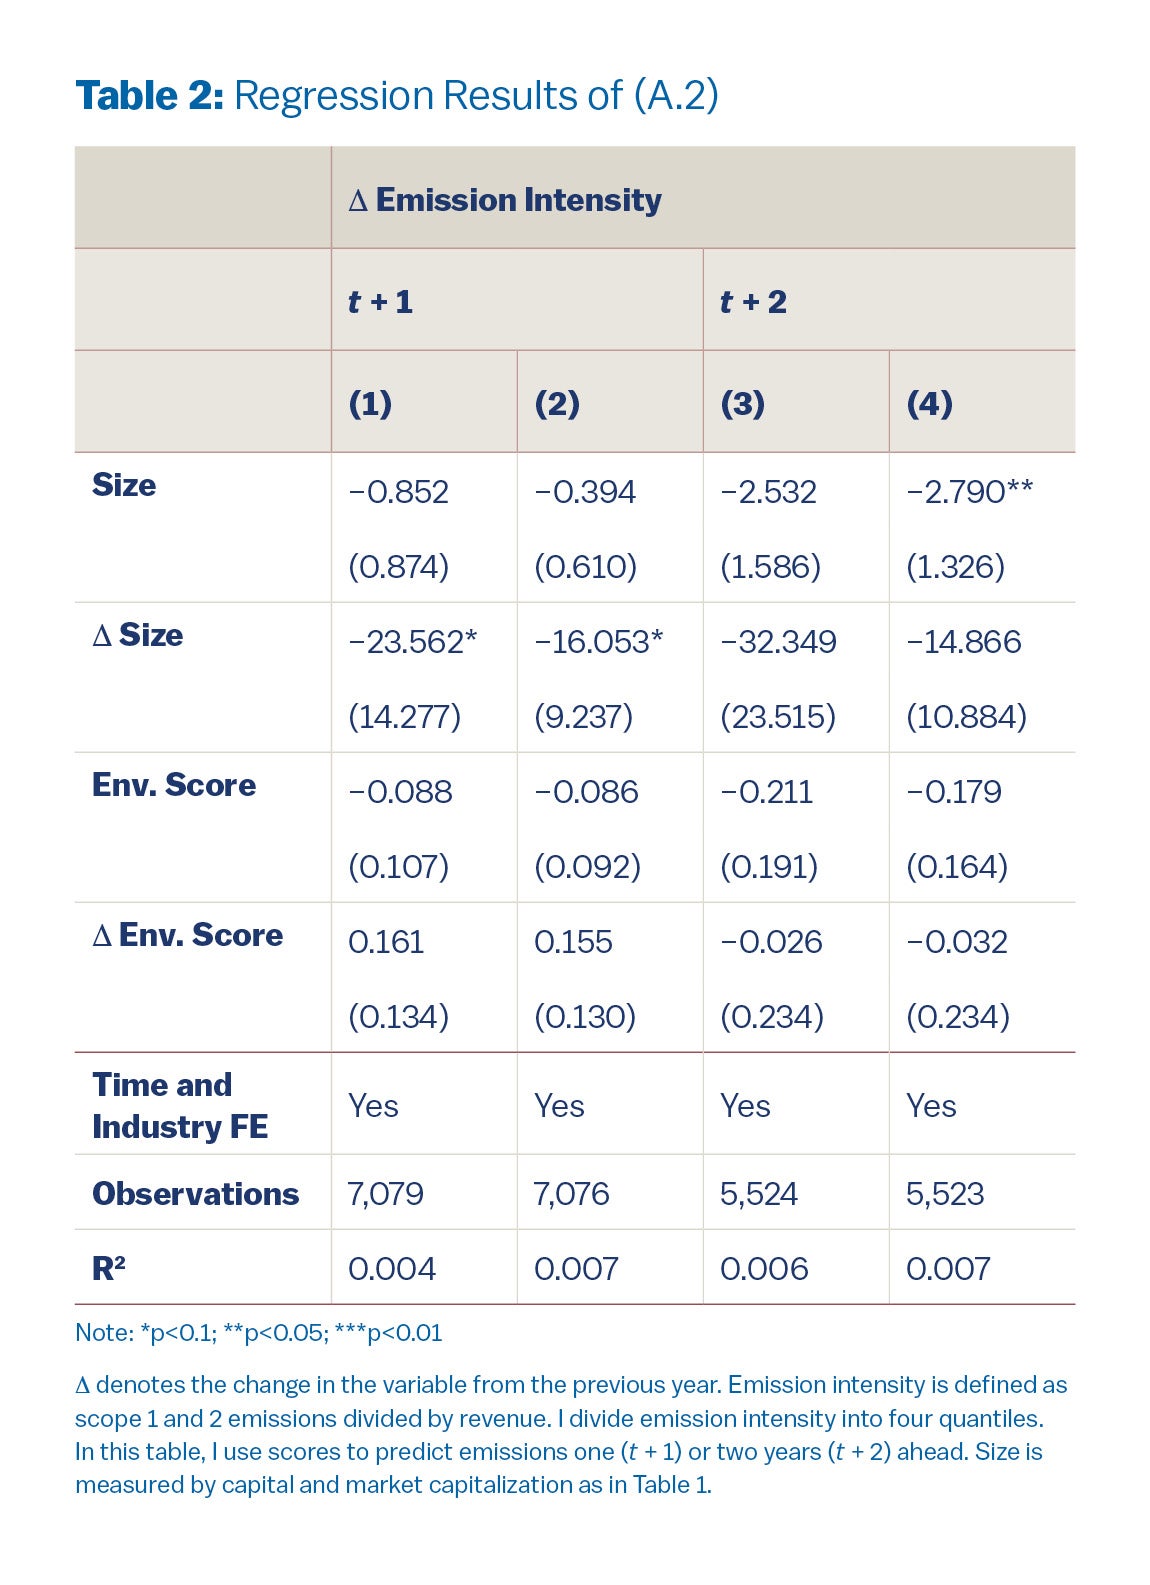
Fact 3: scores don’t predict future emissions. The regression results in Table 1 show that scores are not backward looking: firms that reduced emissions from the previous year don’t have higher scores. In this fact, I show that scores are not forward-looking either: they don’t predict future emissions. I estimate the following regression

I include size and change in size as predictors to prevent omitted variable bias. They strongly correlate with scores (facts 1 and 2) and, a priori, one may reasonably argue that they influence emissions. I estimate two sets of regressions, one to predict change in emissions in one year and the other to predict change in emissions in two years.
Results in Table 2 indicate that environmental scores and change in environmental scores are not significant predictors of future emissions. Furthermore, together with size and change in size, which are strong predictors of scores, the four regressors explain less than 1% of the variance, highlighting the disconnect between firm characteristics, scores, and emissions. Another interesting result is that there exists little evidence that larger firms reduce their emissions. Most coefficients associated with size are not significant. The weak significance associated with size measured by market capitalization is likely an artifact, given the coefficients all the other columns have no statistical significance.
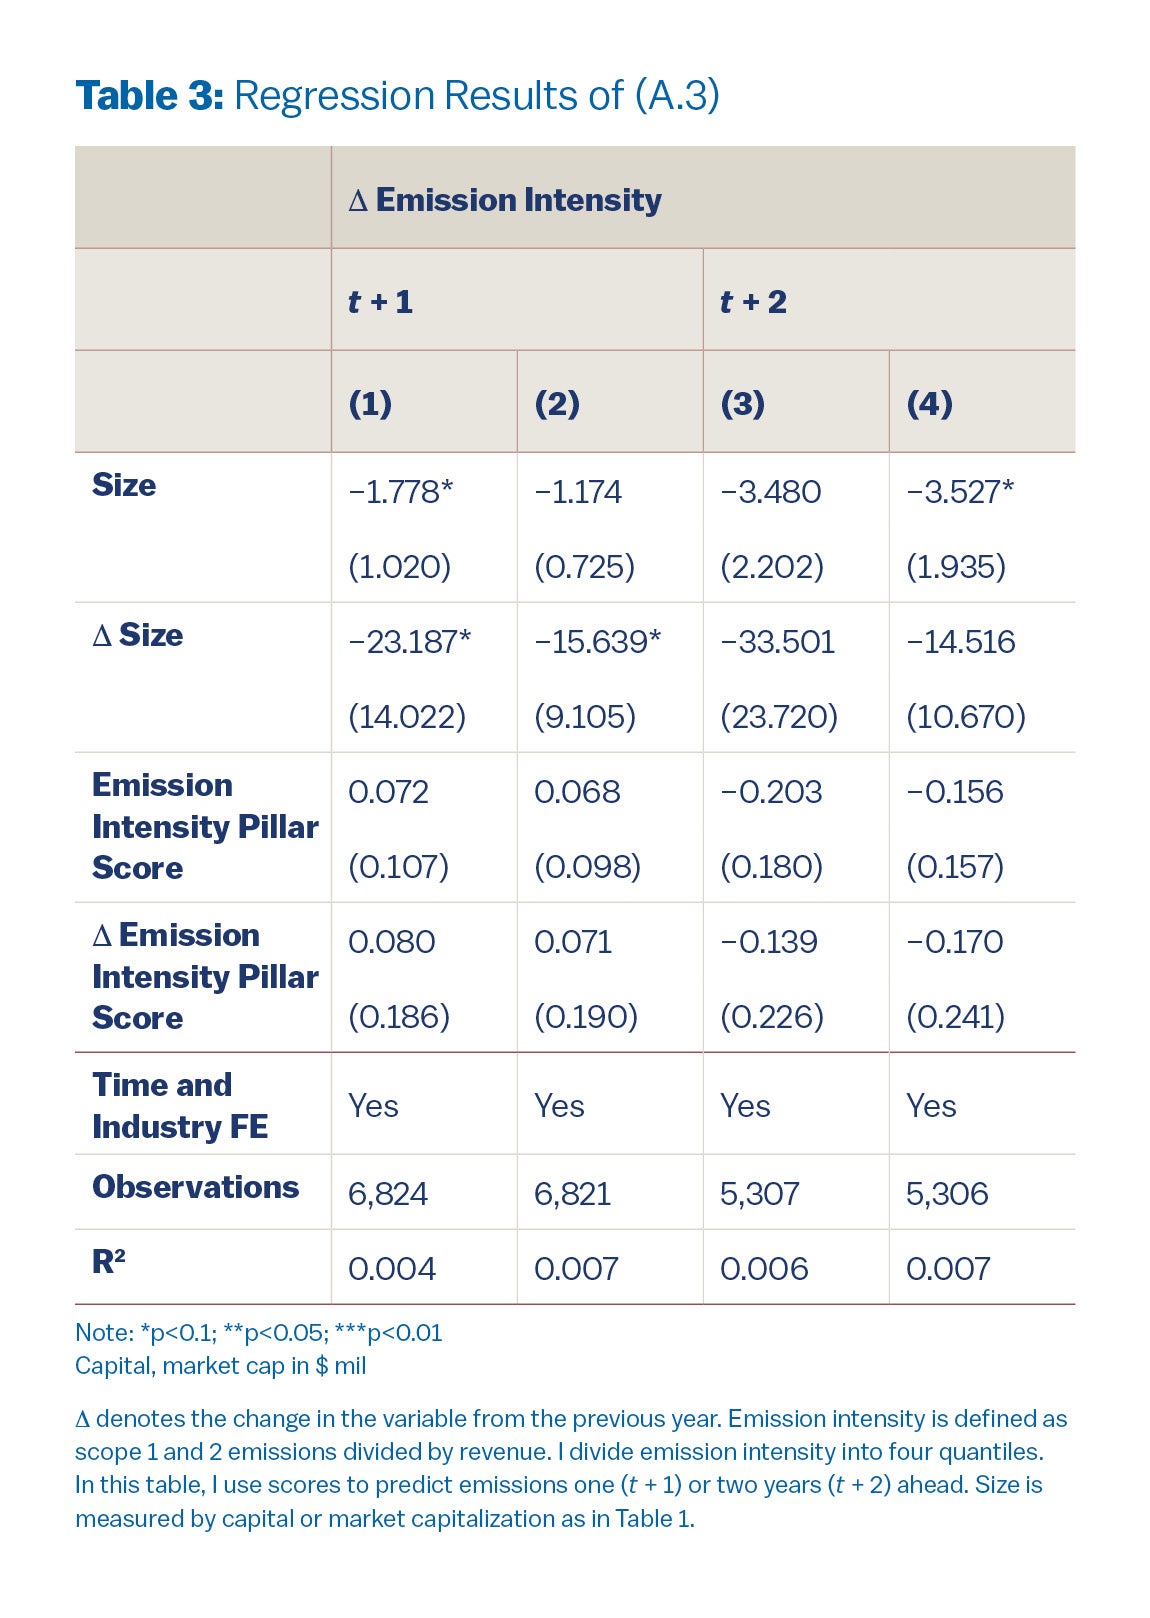
Since the Environmental score is a weighted average of pillar scores that assess a firm’s environmental credentials, I also use one of the pillar scores, the emission intensity scopes 1 and 2 scores, to predict emissions. These pillar scores aim to assess firms’ emission intensity and the pertinent section in the CSA demands that firms report emissions.2 I estimate the following regression:
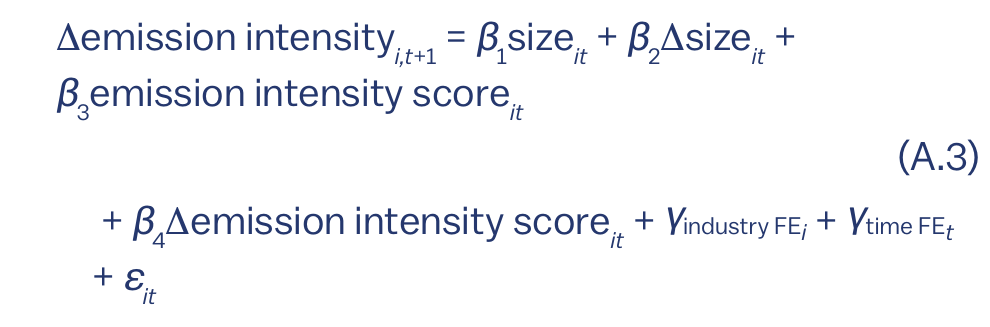
where emission intensity score it is the average of the emission intensity scopes 1 and 2 scores for firm i in year t. The only difference between this regression and the previous one (A.2) is that I use emission intensity pillar scores instead of the environmental score.
Regression results in Table 3 show qualitatively similar results as in Table 2: even emission intensity scores, which are designed to evaluate emission intensity, don’t predict future emissions. The weak significance associated with size is not robust, given that it goes away when I use a different measure of size or when I use a different score.
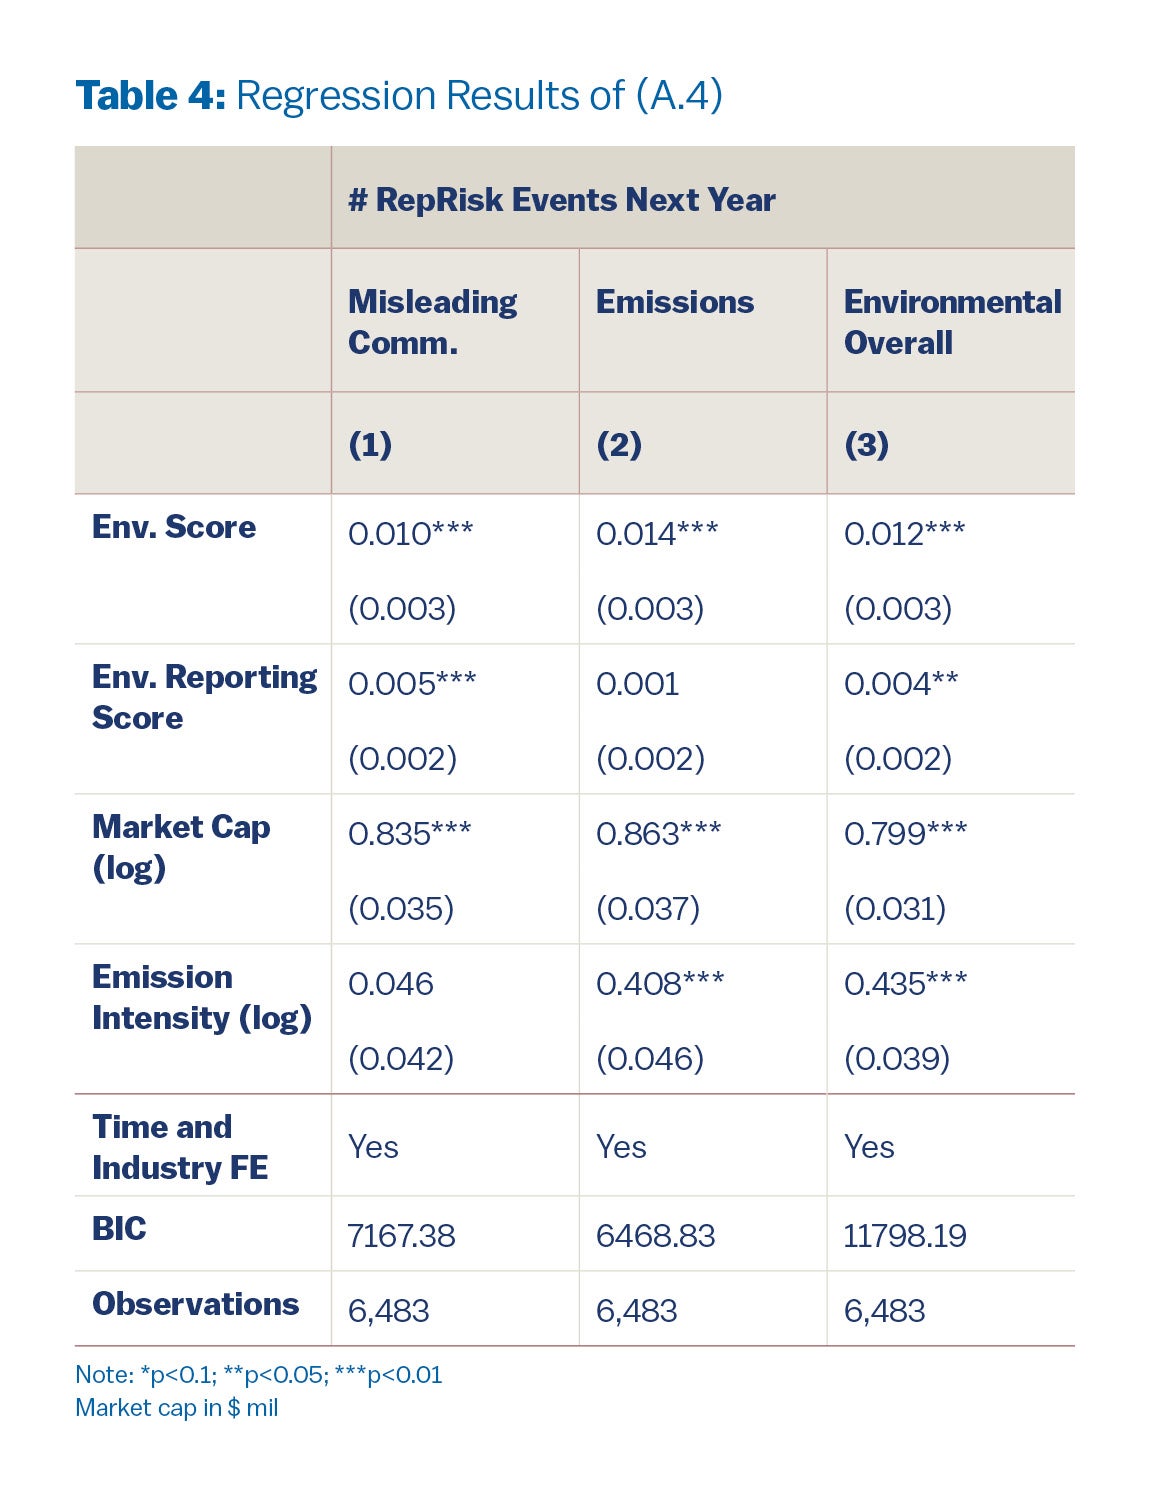
Fact 4: scores predict more misleading communication, emissions, and environmental issues. To measure misleading communication, emissions, and environmental issues, I use the RepRisk dataset. For each firm in a given year, I calculate the number of RepRisk events that belong to these categories: misleading communication, GHG emissions, and environmental issues overall, where the first two are subcategories of the last. I investigate whether firms with high scores are associated with a higher count of RepRisk events in the following year. I then estimate a negative binomial regression (since the dependent variable consists of count data):
![# RepRisk events_{i,t+1} = exp [β₁ market cap_it + β₂ score_it + β₃ reporting score_it + β₄ emission intensity_it + γ_industry FEᵢ + γ_time FEₜ]](https://kleinmanenergy.upenn.edu/wp-content/uploads/2025/07/A4.png)
I include market cap as a control, to account for the possibility that larger firms may receive more attention. reporting score is a pillar score (that contributes to the Environmental score just as the emission intensity scores) that measures the quantity and quality of environmental reporting. I include reporting score as a control, to account for the possibility that firms that report more have more to be examined. Since the correlation between emission intensity and scores is weak, as shown in previous facts, I include emission intensity not as a control, but as an informal validation check. For example, if emission intensity predicts misleading communication events but not emissions events, it suggests that RepRisk may not be reliable.
Regression results in Table 4 show that firms with high scores will lead to more RepRisk events in the following year, after controlling for market capitalization and reporting scores. Furthermore, the coefficients on reporting score and emission intensity suggest that RepRisk reasonably captures events in these three categories. reporting score does not predict emissions events, but predicts misleading communication, whereas emission intensity does not predict misleading communication events, but predicts emissions events.
For a firm that normally records one RepRisk incident per year, a 10-point rise in its Environmental score boosts its expected number of negative events by roughly 0.105 misleading communication incidents, 0.150 emissions incidents, and 0.128 overall environmental incidents per year. While 0.128 incidents may sound small, most firms start at zero incidents annually – so even a fractional increase means that a non-trivial share of previously incident-free firms will begin experiencing negative events over time.
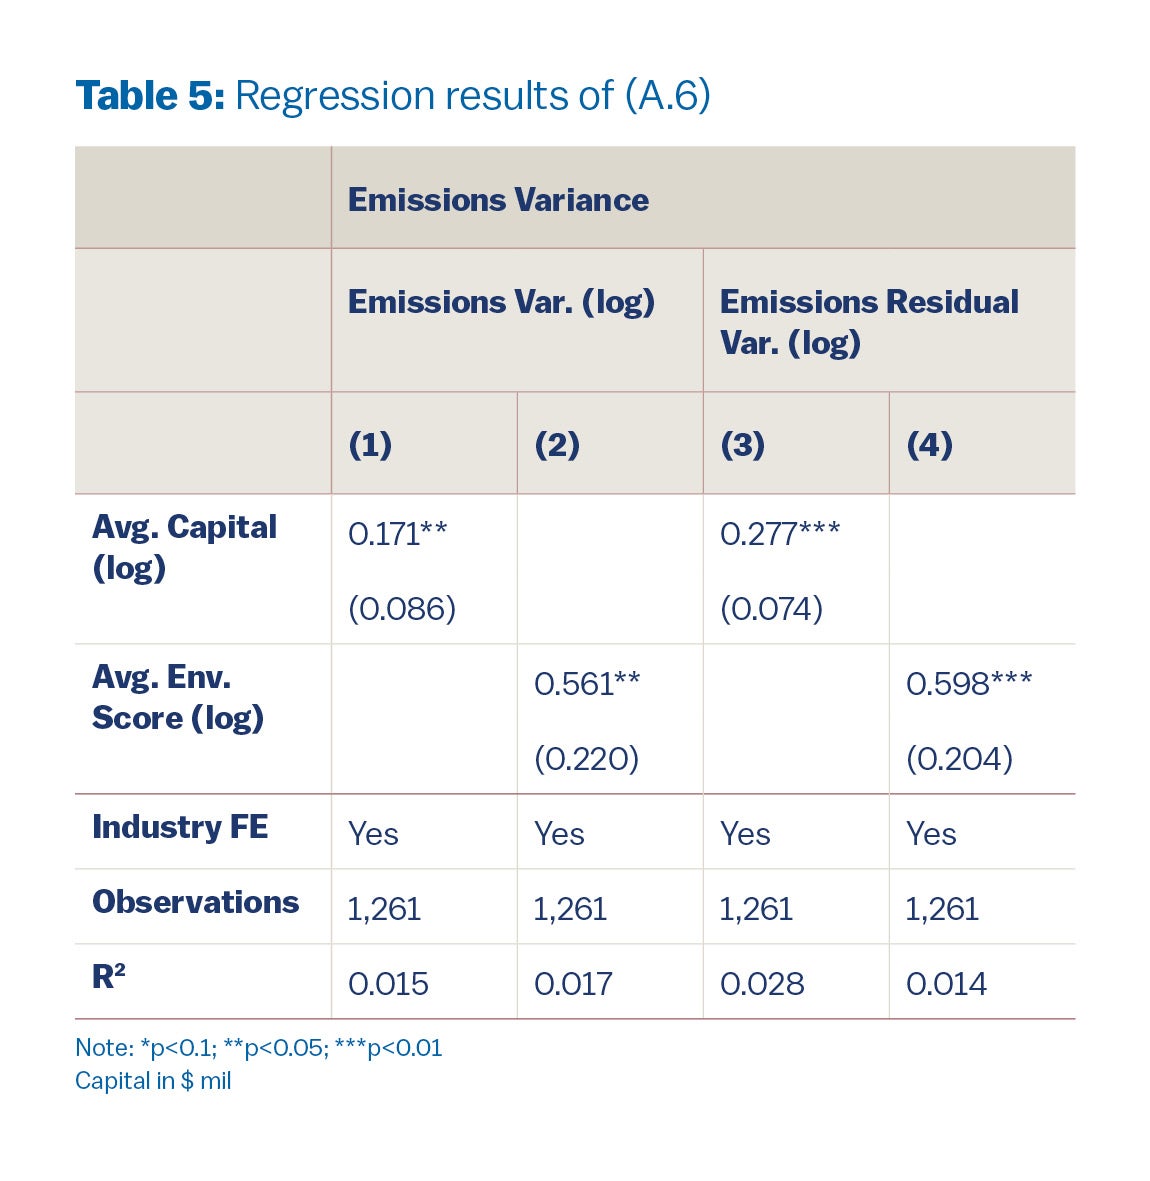
Fact 5: larger firms tend to report noisy emissions. I develop two ways to measure the variance of reported emissions. First, for a given firm i, I use the variance of the reported emissions of the firm in the entire sample over time. Second, I estimate the following time series model
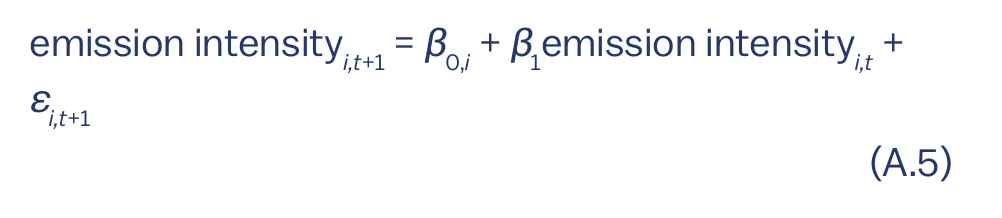
(A.5) is similar to an AR(1) model, but has the same AR(1) coefficient β1 for all firms and the intercept β0,i serves as the firm fixed effect. I use the same β1 for all firms due to the limited time span of reported emissions. The variance of εi,t+1 is then the second way to measure reported emission variance.
I then regress these two measures of emission variance on size and scores:
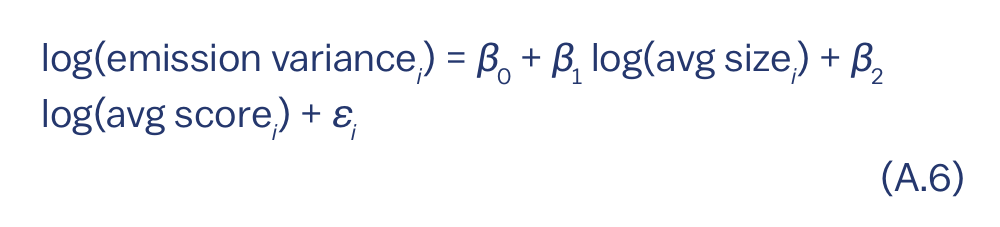
where avg sizei and avg scorei are the average reported emissions and scores of the firm over the sample period. Notice that since both measures of emission variance is computed over time, (A.6) is a cross-sectional regression (without the t subscript).
Model
I will briefly describe the model in my paper so that it helps me present my policy recommendations.
Model Overview
The economic model starts with the assumption that the economy is initially in a good climate state. However, it has the potential to shift to a bad climate state, where production is negatively impacted by climate change, leading to reduced consumption.
Firms in the economy possess two types of capital: green capital (kG) and brown capital (kB). Green capital is environmentally friendly but less productive compared to brown capital, which generates emissions.
In the event of a bad climate state, the government imposes a tax on brown capital (such as a carbon tax) to mitigate emissions. Consequently, firms with a higher proportion of green capital (referred to as green firms) incur lower taxes in the bad climate state, which increases their valuation compared to firms with predominantly brown capital (referred to as brown firms) in the good climate state.
Assumptions (Sources of Financial Frictions)
- Observation of Aggregate Capital: Households can observe the total capital (k = kG + kB) but cannot distinguish between the types of capital. The greenness ratio (g = kG) remains hidden (latent) to households.
- Use of Reported Emissions: Households can observe reported emissions and utilize a Kalman filter to make inferences about the greenness ratio (g).
- Incentive for Greenwashing: Firms have a motivation to manipulate the Kalman filter through greenwashing, as appearing greener reduces their cost of
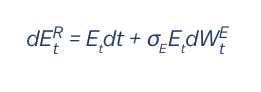
In essence, the average emissions (Et) are directly proportional to the amount of brown capital (kBt). However, the emissions reported (ER) include a noise component:
Households use the noisy reported emissions (ER) to run a Kalman filter, assuming the following model:
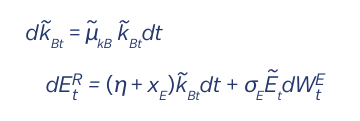
Here, ~kBt represents the latent brown capital inferred by the households.
The mean of the posterior distribution of brown capital (CkBt) is described by the equation:
![d𝑘̂_{Bt} = μ̃_{kB} 𝑘̂_{Bt} dt + [2μ̃_{kB} / (η + x_E)] dE_t^R](https://kleinmanenergy.upenn.edu/wp-content/uploads/2025/07/EQ3.png)
In this context, xE denotes the extent of greenwashing, which is the degree to which firms distort the drift or the probability measure of dWE as per the Girsanov theorem. Firms incur a quadratic cost for greenwashing.
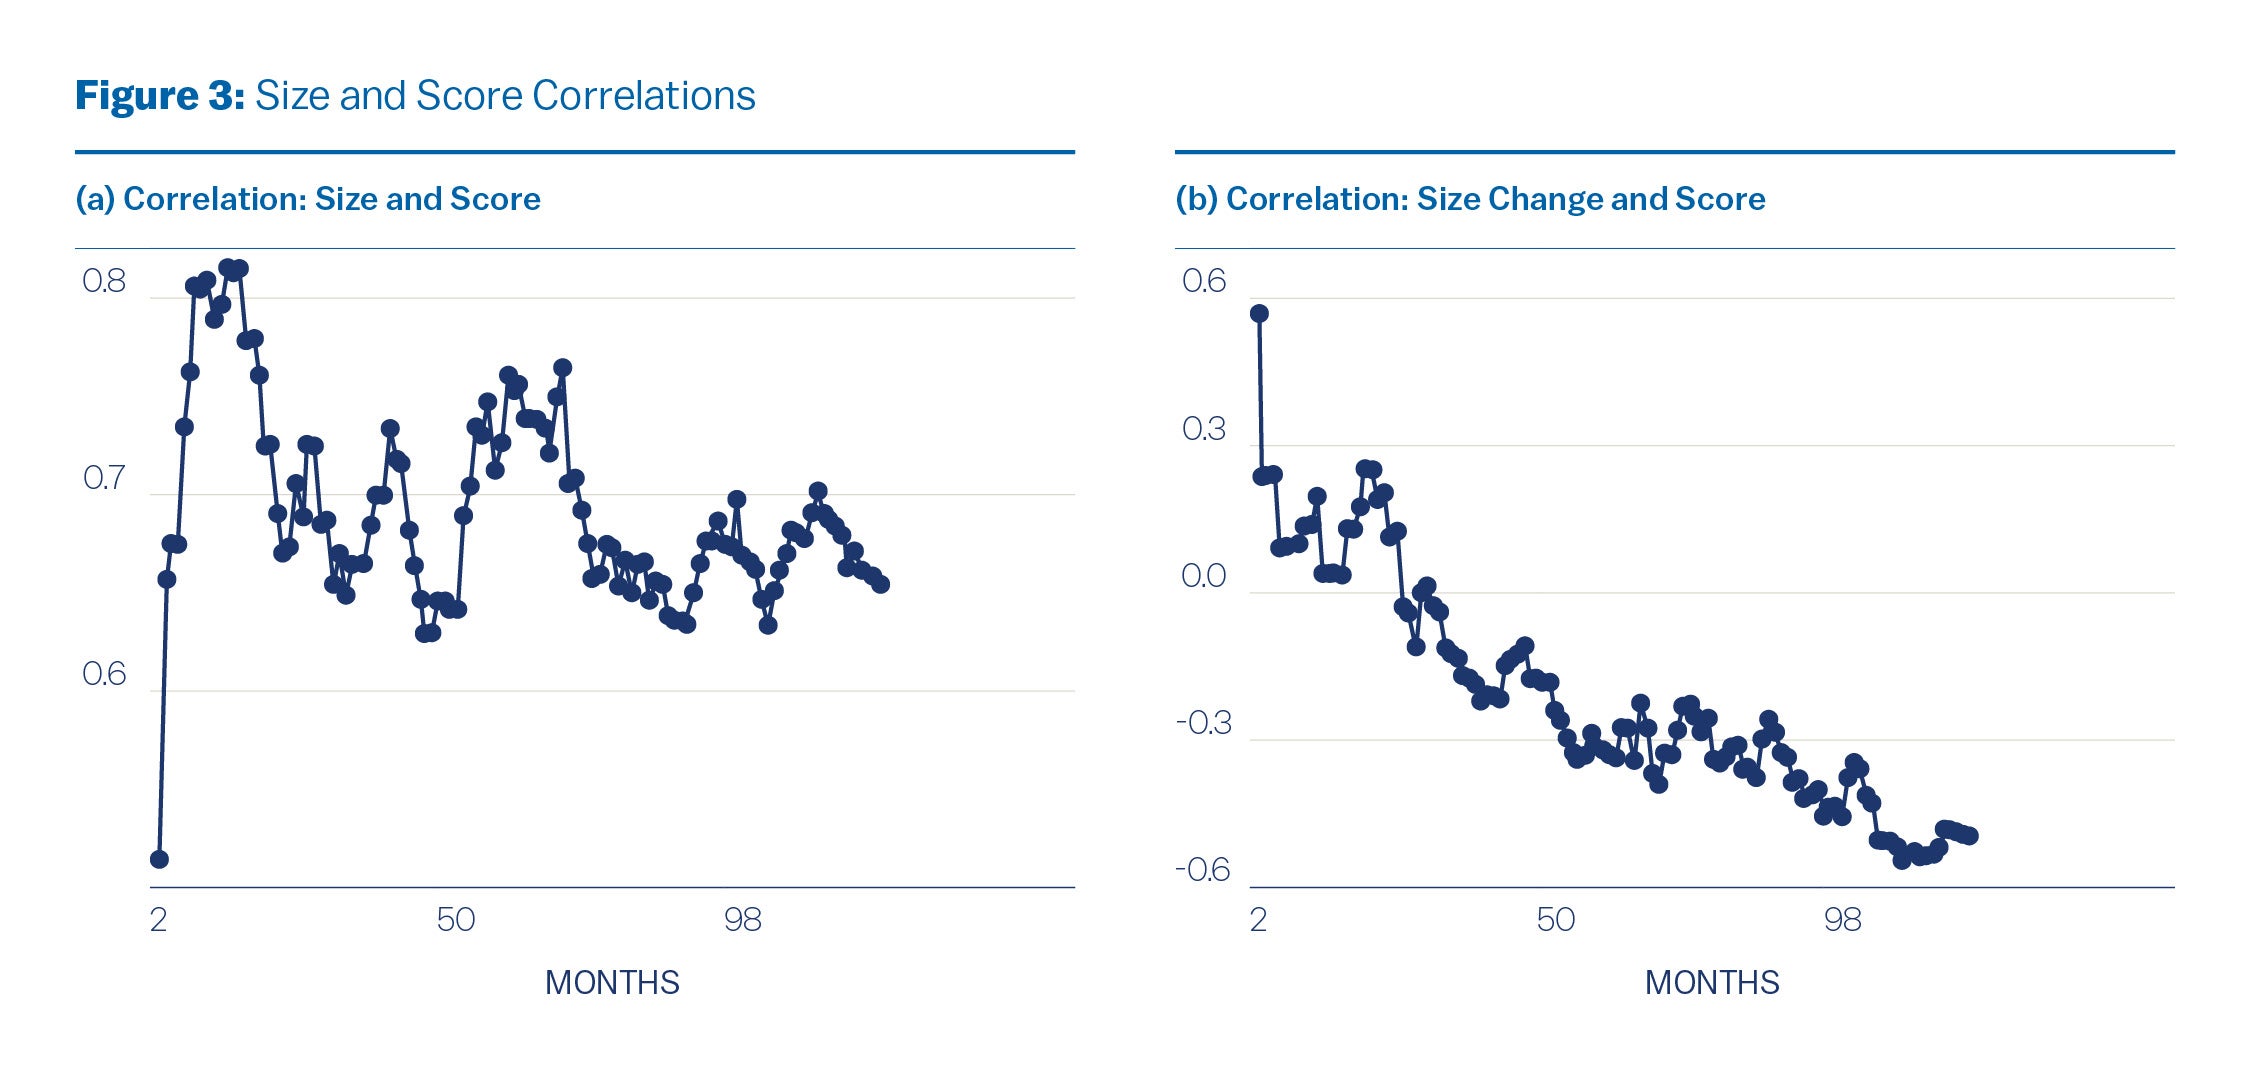
After solving the model, I simulate the economy to analyze the impact of greenwashing. In Figure 3, I show that in my model, larger firms receive higher scores, whereas a reduction in firm size predicts high scores.
Alternative regression specifications
In this section, I include results from different regression specifications.
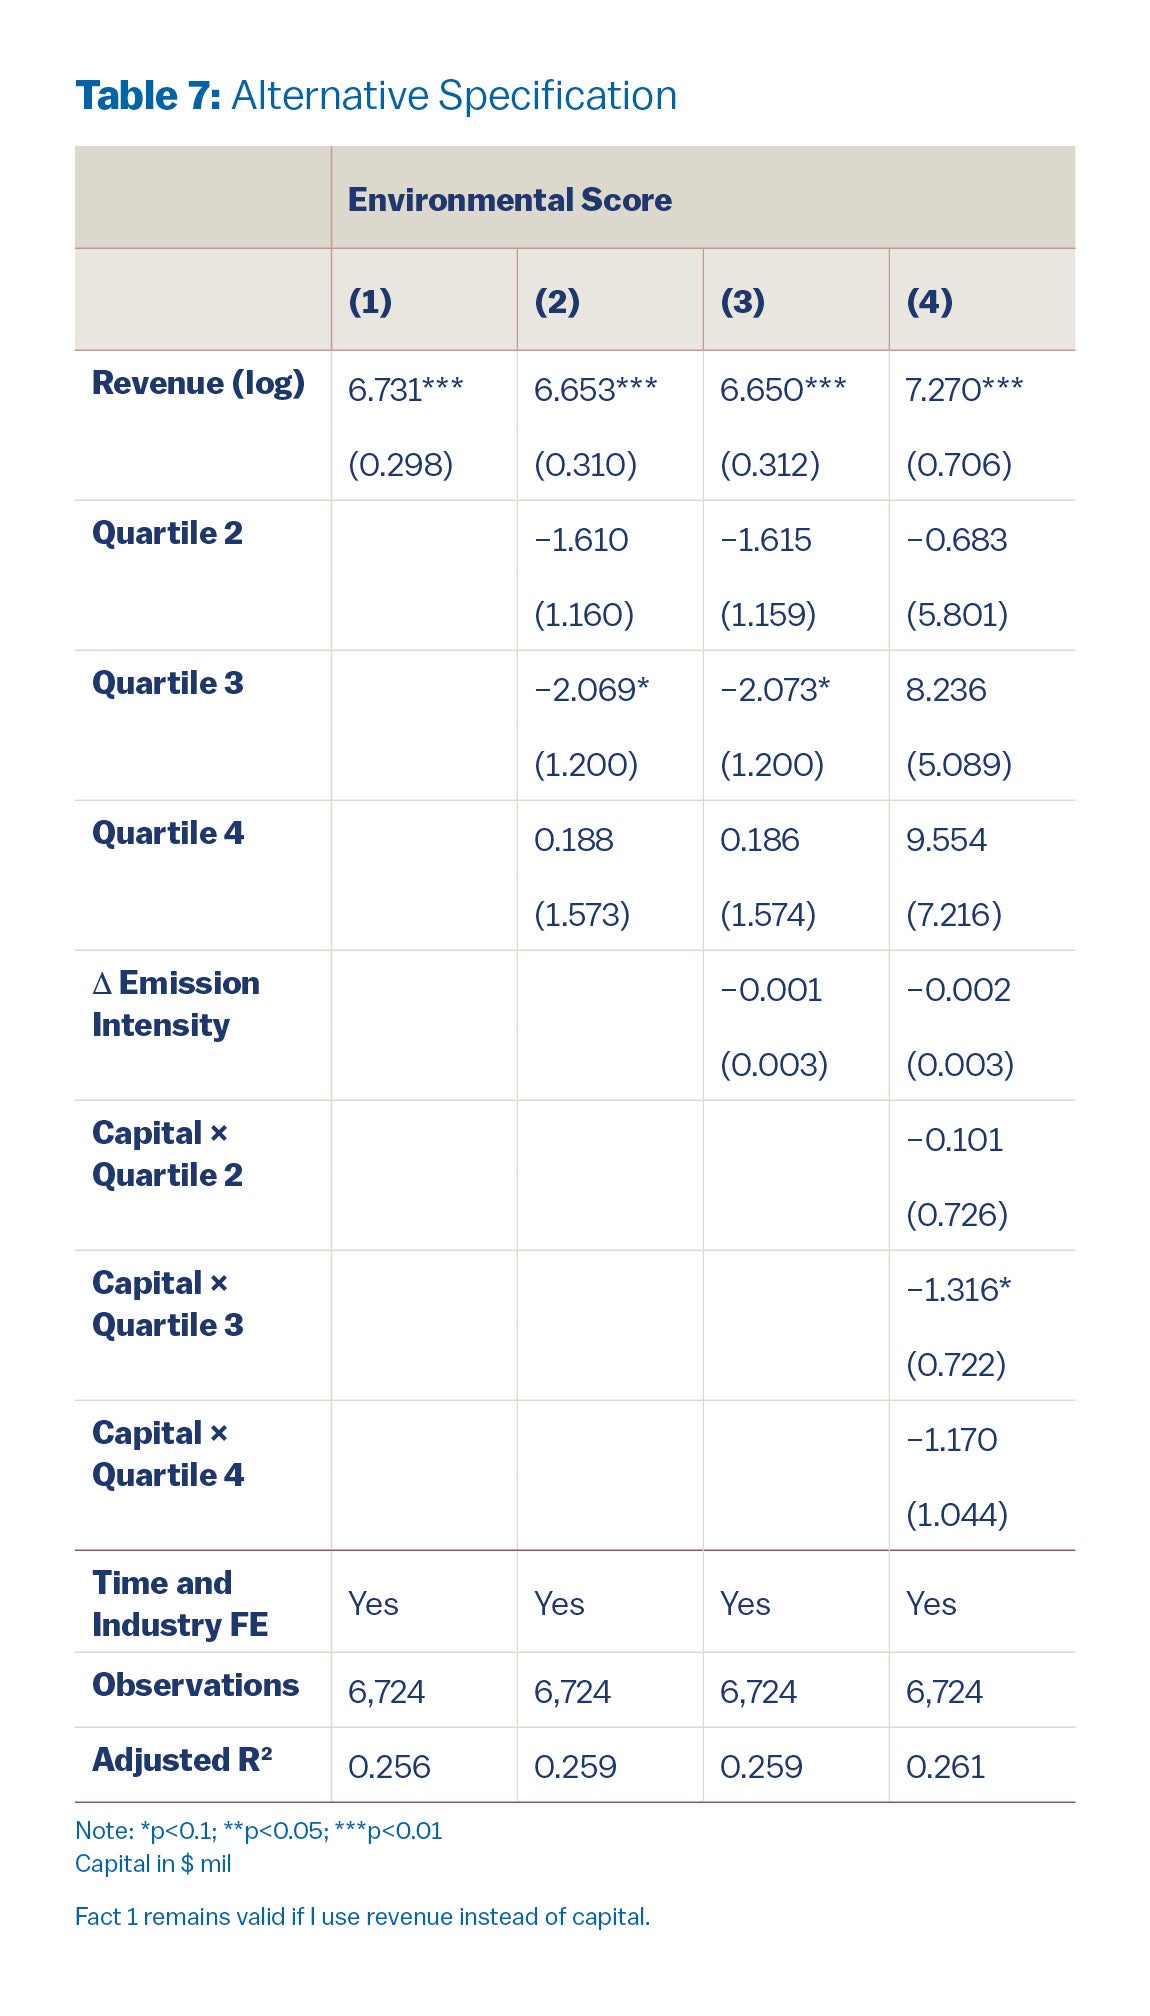
Next, I show that fact 1 remains valid when I use revenue to measure size.
Berg, Florian, Julian Kolbel, and Roberto Rigobon. 2019. “Aggregate Confusion: The Divergence of ESG Ratings.” Publisher: Elsevier BV, SSRN Electronic Journal (August). Accessed June 6, 2022. https://doi.org/10.2139/SSRN.3438533. https://papers.ssrn. com/abstract=3438533.
Bolton, Patrick, and Marcin Kacperczyk. 2021. “Do investors care about carbon risk?” Journal of Financial Economics 142, no. 2 (November): 517–549. issn: 0304-405X, accessed June 6, 2024. https://doi.org/10.1016/j.jfineco.2021.05.008. https://www.sciencedirect. com/science/article/pii/S0304405X21001902.
Glossner, Simon. 2017. ESG Risks and the Cross-Section of Stock Returns [in en]. SSRN Scholarly Paper. Rochester, NY, June. Accessed March 30, 2024. https://doi.org/10. 2139/ssrn.2980917. https://papers.ssrn.com/abstract=2980917.
Hartzmark, Samuel M., and Kelly Shue. 2022. Counterproductive Sustainable Investing: The Impact Elasticity of Brown and Green Firms [in en]. SSRN Scholarly Paper. Rochester, NY, November. Accessed November 28, 2023. https://doi.org/10.2139/ssrn.4359282. https://papers.ssrn.com/abstract=4359282.
- I include a technical appendix at the end of this document. [↩]
- The CSA Handbook released by S&P Global states that the question rationale as “Producing more with less material is essential for many industries affected by the increasing scarcity of natural resources. Operational Eco-Efficiency can enhance companies’ competitiveness through reduced costs and environmental liabilities. It can also mean companies are better prepared for future environmental regulations. The key focus is on the inputs and outputs of business operations, and the assessment of trends in the consumption of natural resources and the production of environmental waste products specific to each industry.” [↩]
