COVID-19 opens the door to stimulus packages based on renewable energy and a healthy climate. The falling costs of clean energy also open the door for the recovery to address social justice.
At a Glance
Key Challenge
Current trends show national emissions rapidly rising back to pre-COVID-19 levels.
Policy Insight
Today’s market forces, a federally endorsed desire for social justice, and stimulus packages and plans, give us an incredible opportunity to peak greenhouse gas emissions today (or even in the recent past).
Has the world reached peak carbon emissions?
Depending on how nations manage their COVID-19 stimulus plans, the answer may well be “yes.”
The thought-experiment itself is revolutionary given that up until a few months ago all we could see were a few states and countries making progress with the backdrop of a world still exponentially increasing in greenhouse gas pollution. COVID-19, of course, opens the opportunity to not only take advantage of the drop in emissions, but to #BuildBackBetter, namely with renewable energy and not fossil-fuel infrastructure.
While the dialog around a Green Deal in Europe and Green New Deal in the U.S. is cause for optimism, the actual trends we are seeing of national emissions rapidly rising back to pre-COVID-19 levels is dispiriting (Zheng et al. 2020).
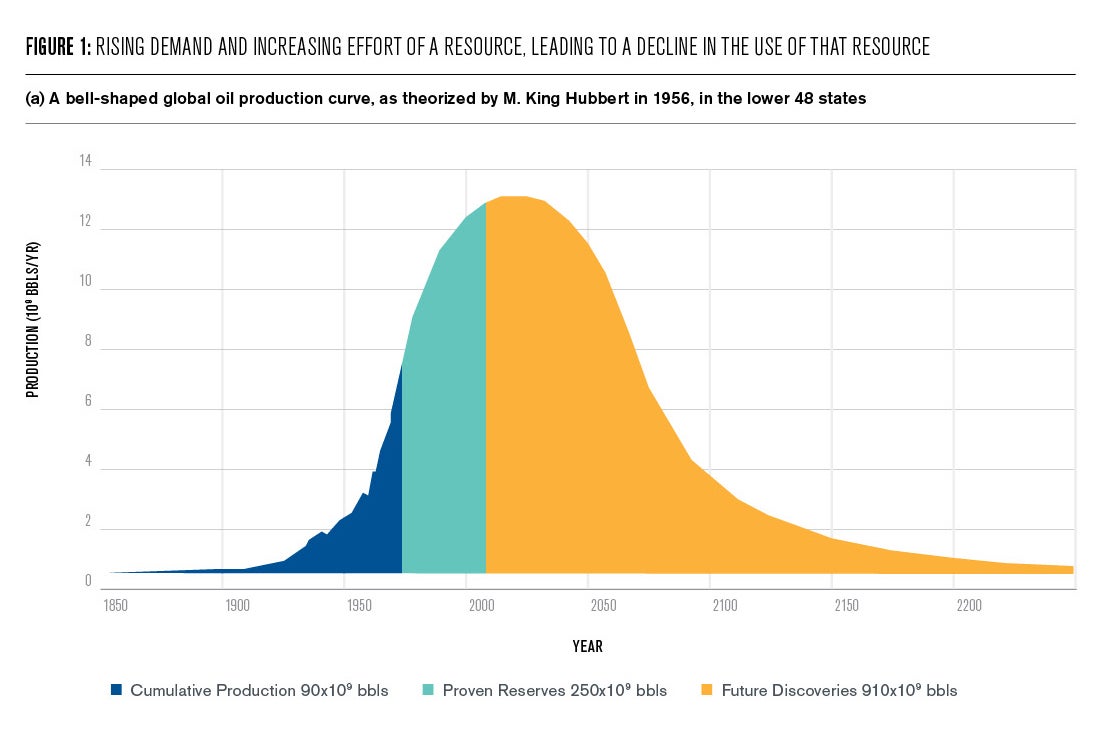
Answering this question is not simply a case of exploring the famous “Hubbard Curve” of increasing fossil fuel resource consumption, and then an eventual, smooth bell-curve (Gaussian) decline (Figure 1a) driven by resource scarcity (no), environmental sensibility (some, but not enough), or superior replacements becoming available at competitive cost (yes).
There is tremendous explanatory power in understanding the interplay between the rising demand and increasing effort to access a resource (be it whale oil, sardines, tuna, timber, appetite to watch American football, or in this case fossil fuels), which is then followed by a point of peak demand, and then decline in the use of that resource.
We have seen important scholarship and both theoretical and practical advances from the use of this theory not just for oil, as M. King Hubbard posited (Hubbard 1962; Deffeyes 2001), and some of the important generalizations to peak coal, gas, and even the capacity to watch American football (Carter 2019).
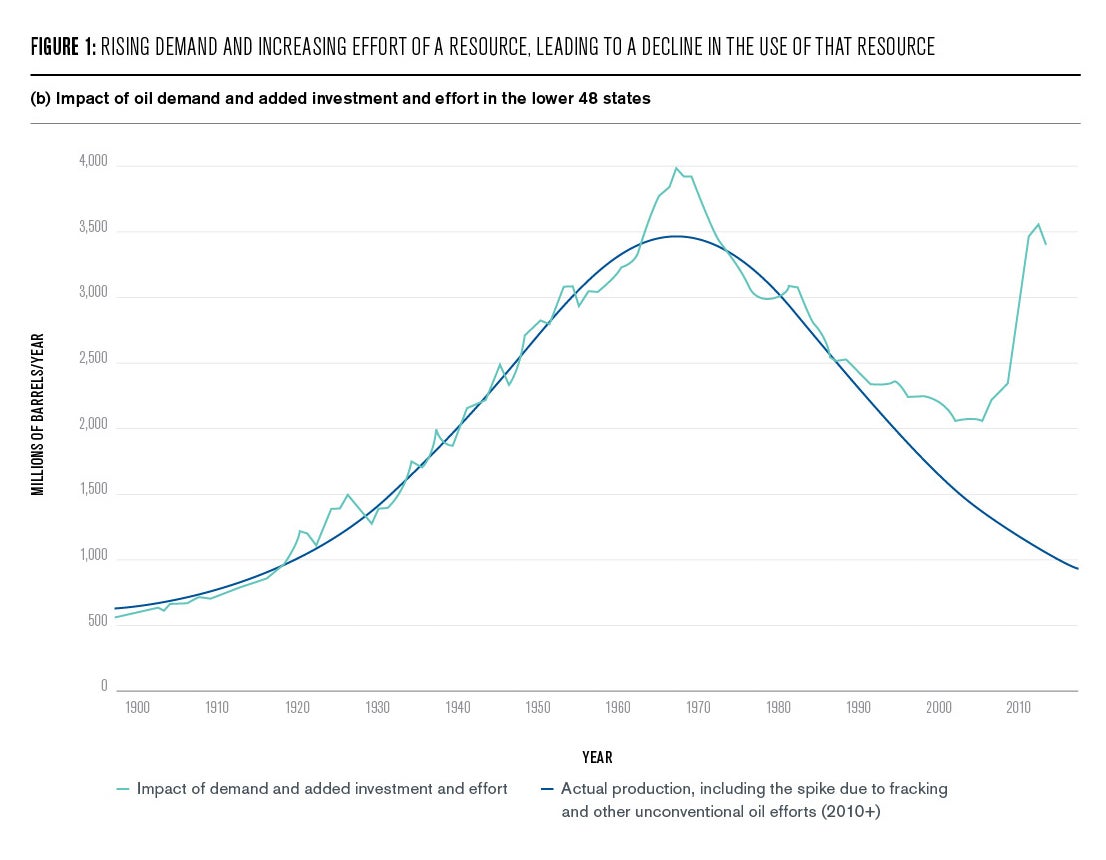
However, as we can see, strange things can happen in the evolution of what was once thought to be a normal, or Gaussian distribution (Figure 1b). In the case of Hubbard’s Peak, greatly expanded effort to identify and extract increasingly unconventional oil from more and more extreme environments (including arctic oil, deep undersea resources, and tar sands) can change the production curve dramatically (Figure 1b).
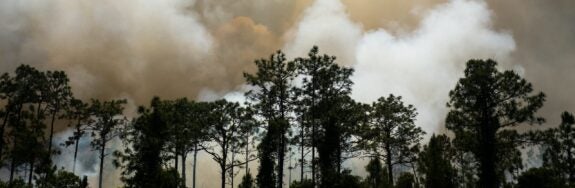
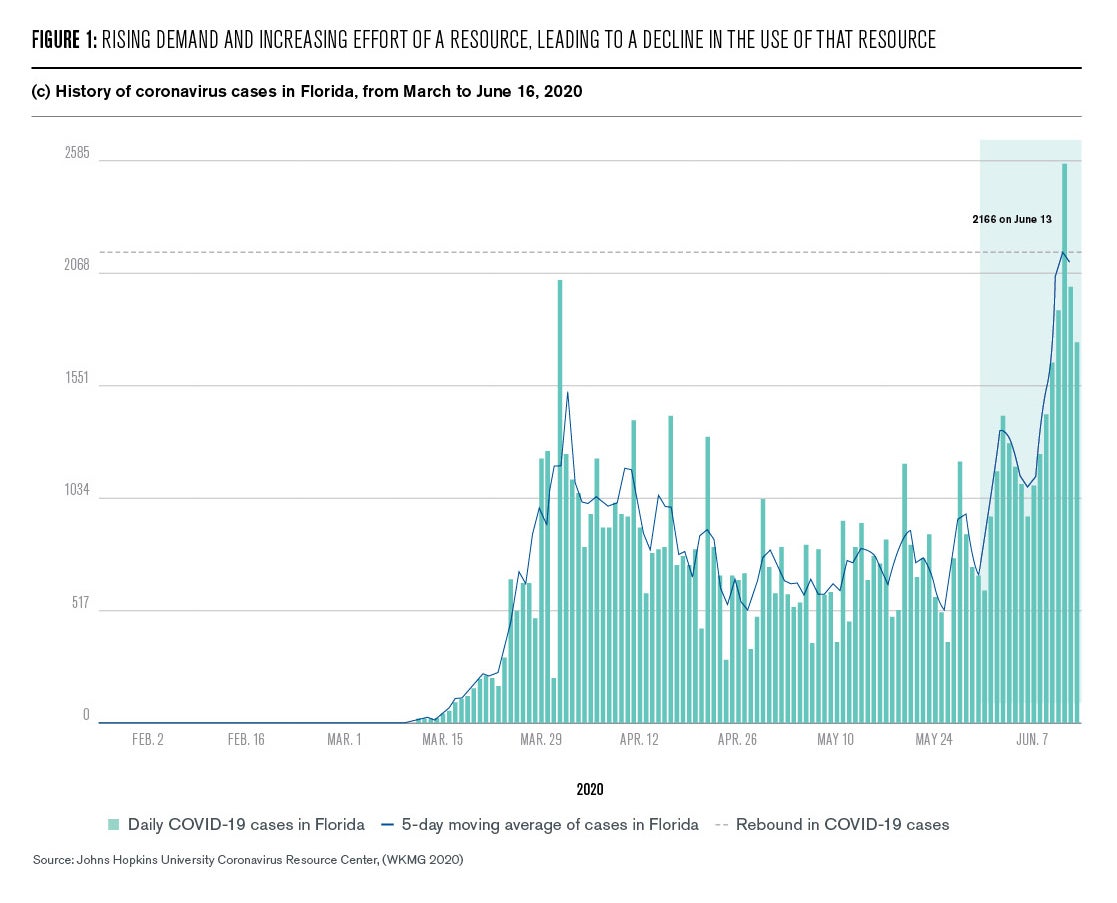
In fact the current U.S. Hubbard curve for oil now reminds us most strongly—sadly—of the “peak COVID-19” situation that disastrous policy missteps and failures to act have generated states such as Florida where the active measures—social distancing and mask wearing—were relaxed (Figure 1c, bottom right).
A more complete assessment of the question “have we reached peak carbon emissions?” requires a bit of additional back-story, but the answer is “quite possibly, yes.” In the fossil fuel case, more ominously, as seen in Figure 1(b), technology plays a role, but most critical is the role of political and financial forces. Here demand and subsidies for fossil fuels have extended the reign of fossil fuels. The resulting cost comes in many forms, notably of pollution, loss of jobs, and a lack of social and racial justice.
Decades ago this question was of serious interest only to a small community of sustainability scholars, championed by a number of truly notable pieces of work, including such path-breaking studies as Energy Strategy: The Road Not Taken by Amory Lovins (1976) and The Art of Energy Efficiency by Art Rosenfeld (1999). To honor these achievements, Jon Koomey organized a collection of first and second generation energy-efficiency scholars to quantify and name a new unit of energy-efficiency based avoided coal fired emissions: a Rosenfeld (Koomey et al. 2009). I had the pleasure of both participating in this project as an author and seeing the launch of Environmental Research Letters, an open access journal for which I’ve served as editor-in-chief since its founding fifteen years ago. Fittingly, the Rosenfeld is defined as the electricity savings of 3 billion kilowatt-hours per year, the amount needed to replace the annual generation of a typical 500-megawatt coal-fired power plant.
As both energy efficiency and renewable energy technologies matured and costs declined, more and more integrative pictures became possible to examine the extent of the present and then future substitution potential of renewable energy and energy efficiency for fossil fuels (see e.g. Duke and Kammen 1999; Azevedo et al. 2013). Today a wide range of tools and models exist to examine both the energy efficiency and renewable energy potential at the household, city, state, national, and regional levels.
One such national U.S. database produced by the American Council for an Energy-Efficient Economy (ACEEE) details the state-by-state energy efficiency standards and levels of implementation (https://database.aceee.org/state/energy-efficiency-resource-standards), while another, the DSIRE data base (https://www.dsireusa.org) tracks the incentives and barriers to renewable energy and energy efficiency. These and many other researchers and resources track the dramatic decline in costs of renewable energy and energy efficiency relative to fossil fuel costs.
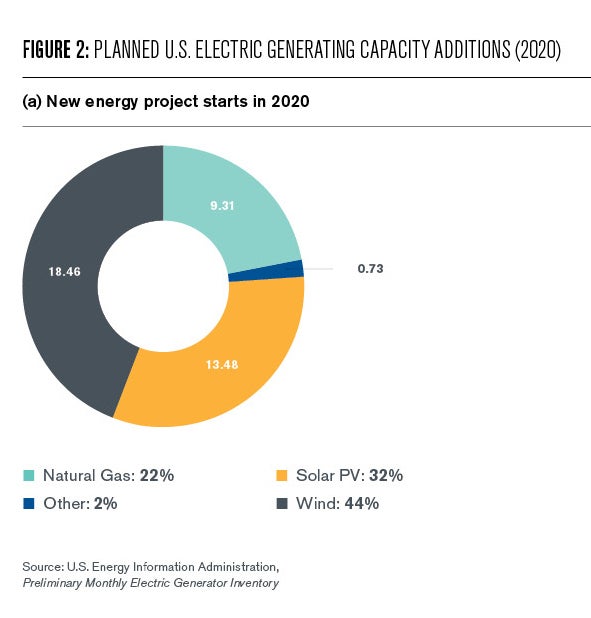
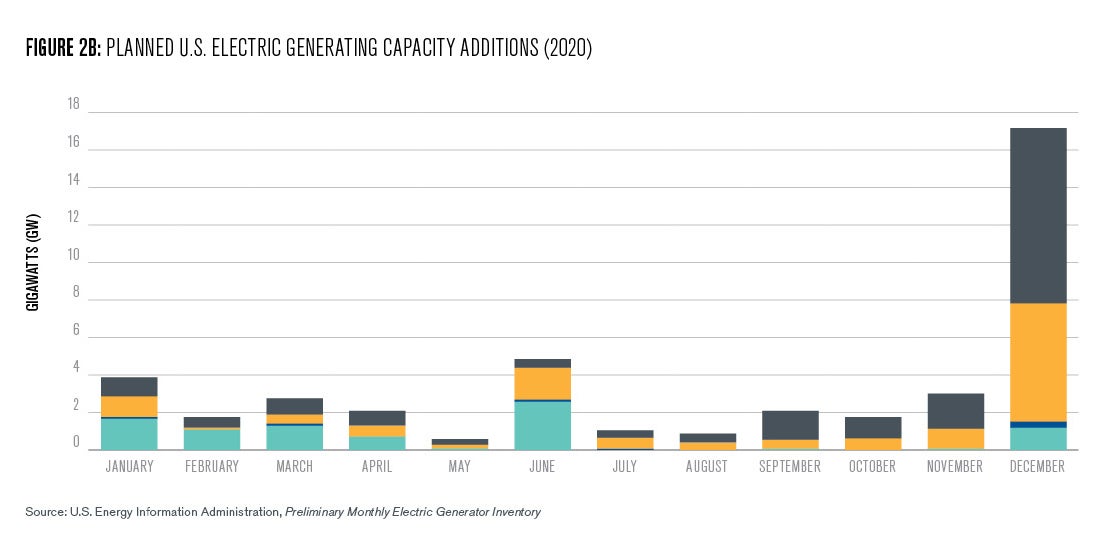
Progress has been so dramatic that the least cost new energy technology across much of the United States is now solar and wind power. Solar energy projects have fallen in cost by close to 90% over the past decade, and wind by 70% (Marcacci 2020, and Figure 2, below). Energy storage is now innovating and falling in cost as fast as solar and wind energy ever have (Kittner, Lill, and Kammen 2017).
These cost trends have been transformative both in the U. S. and globally. Recent solar projects in Mexico, Dubai, India, and China have all reported solar projects with previously unheard of and for even most experts, unimaginably low clean energy costs of under 1 cent per kWh. This has driven a clean energy construction boom that is resetting the energy landscape.
The declines in solar and wind energy costs, and now storage costs too, are so dramatic that the California Public Utilities Commission (CPUC) has made a major change in the way the benefits of behind-the-meter resources will be calculated. The CPUC now calculates the avoided generation capacity cost based on the Net Cost of New Entry (CONE) of a new battery storage resource instead of a gas combustion turbine. Essentially, California has moved from using the price of a kilowatt-hour of electricity generated from a typical gas turbine, to a cost based on solar or wind power (depending on the location) that is stored in a lithium ion battery or a pumped-hydro dam and then delivered to the consumer as the reference cost of electricity.
This change will have major implications for the cost-effectiveness of behind-the-meter investments in solar, storage, demand response, and energy efficiency and how they are considered against supply-side resources. In making this move, the decision reinforces the growing consensus among parties that renewable generation will become California’s primary energy source—and not just in the middle of the day.
In many ways the shift from carbon based to renewably powered energy pricing is only the beginning. The costs quoted here so far are for electricity delivered for a new generation facility, one that is both unsubsidized and, most critically, un-penalized by pollution charges. In California and in the Northeast states a carbon cap-and-trade market price exists, as it does across Europe and soon in the world’s largest energy market, China1.
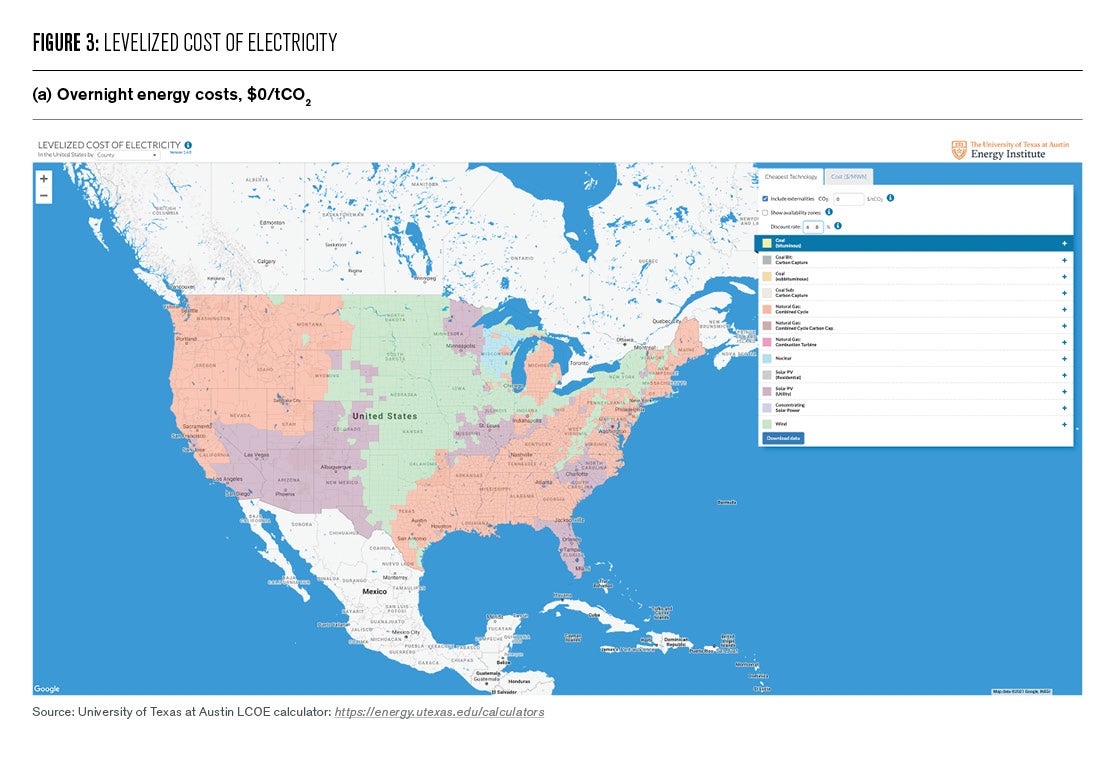
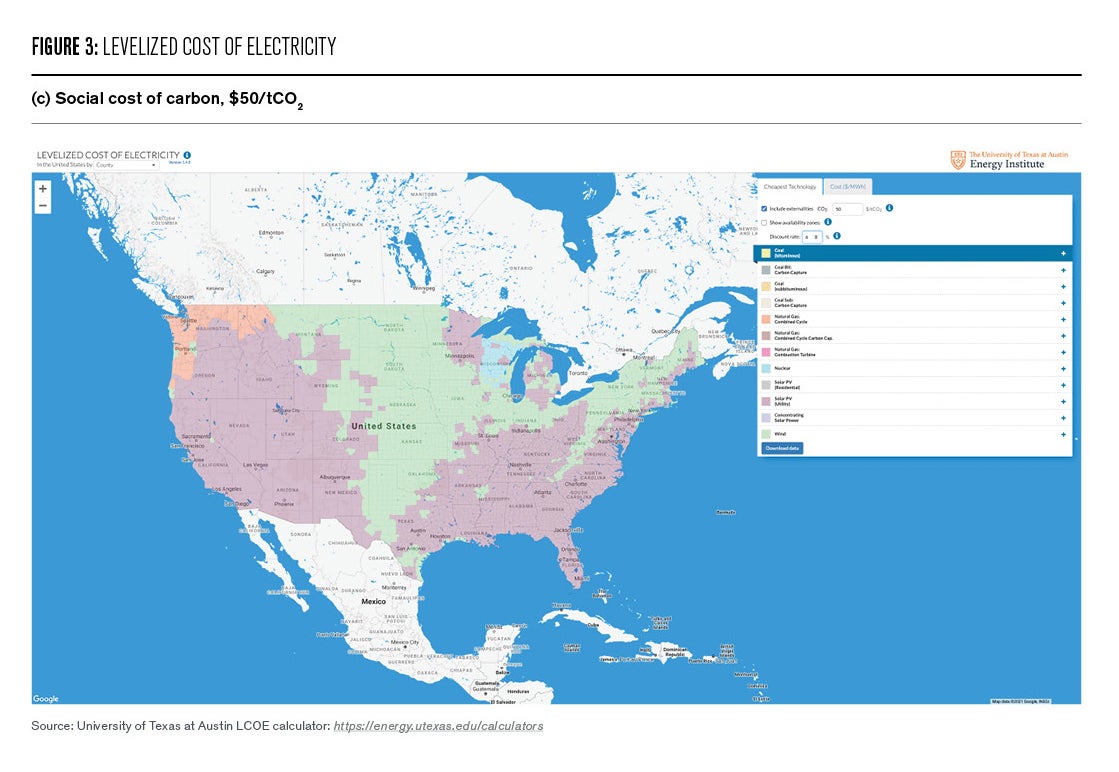
In the U. S., while solar and wind are already the least-cost forms of energy for much of the country, this calculation does not take into account a price on carbon (Figure 3a). If we include those costs at the California level of $20/ton of CO2 emissions, the map changes significantly, with solar gaining at the expense of natural gas (Figure 3b). And if we move further, to including a Social Cost of Carbon, currently estimated at roughly $50/tCO2, the map transforms further (Figure 3c).
Of course a range of perspectives exists on how best to implement, and to allocate or rebate a price on carbon. While the radical restructuring of energy costs we have seen already barely require this component, it is most assuredly coming in some form, and likely to everyone, everywhere.

These assessments—done by many different research groups using diverse methodologies—are consistent across the U.S. and for essentially every nation. My own research group has developed and expanded greatly the use of a model—SWITCH3—pioneered by one of my doctoral students, Matthias Fripp, to examine optimal expansions of the energy infrastructure in a wide range of nations—Bangladesh, Chile, the U.S., China, Kenya, Mexico, Nicaragua (Carvallo et al. 2017; Mileva et al. 2013 & 2016; He et al. 2016; Nelson et al. 2012; Ponce de Leon et al. 2015) to study the interacting forces of technology price changes, and the costs of both energy efficiency programs and grid expansions to bring these new energy technologies to market (http://rael.berkeley.edu/project/SWITCH).
Consistently across all of these cases a decade or so is needed for the transition if technology choices were coordinated and optimized by a central planning agency such as the Federal Energy Regulatory Commission, or as we are more accustomed to thinking, like a nation such as China, with a stronger central planning and regulatory apparatus.
This theoretical construct: a cost-benefit directive to make “all the right moves” during the decade to transform energy systems sounds astounding to many. But with clean energy and storage costs where they are, the real need is now to reflect these new costs in planning decisions and to push regulators to maximize energy efficiency investments and to build transmission to take advantage of large-scale renewables and to incentivize 2-way sales between residential and commercial customers.
Further, these lost costs and high flexibility for renewable energy and energy storage are not only largely without the benefits of carbon pricing, but are prevailing even with the massive levels of fossil-fuel subsidies that exist worldwide, which total anywhere from $0.5 trillion to 5 trillion annually (IEA 2020). There are few ways to put that level of subsidy for pollution in context, but one measure may be to note that renewable energy investment worldwide for the past decade is about 2.5 trillion, or the mid-level estimate of fossil fuel subsidies worldwide for one year (IISD 2019). Quite simply, that level of subsidy is obscene given the current costs of clean energy.
All of this leads to the present: the COVID-19 crisis and the emergence of the social re-awakening around Black Lives Matter and the systematic discrimination against people of color in the U.S., and worldwide. These colliding crises open the door for a peak in carbon emission far earlier than many “experts” predicted.
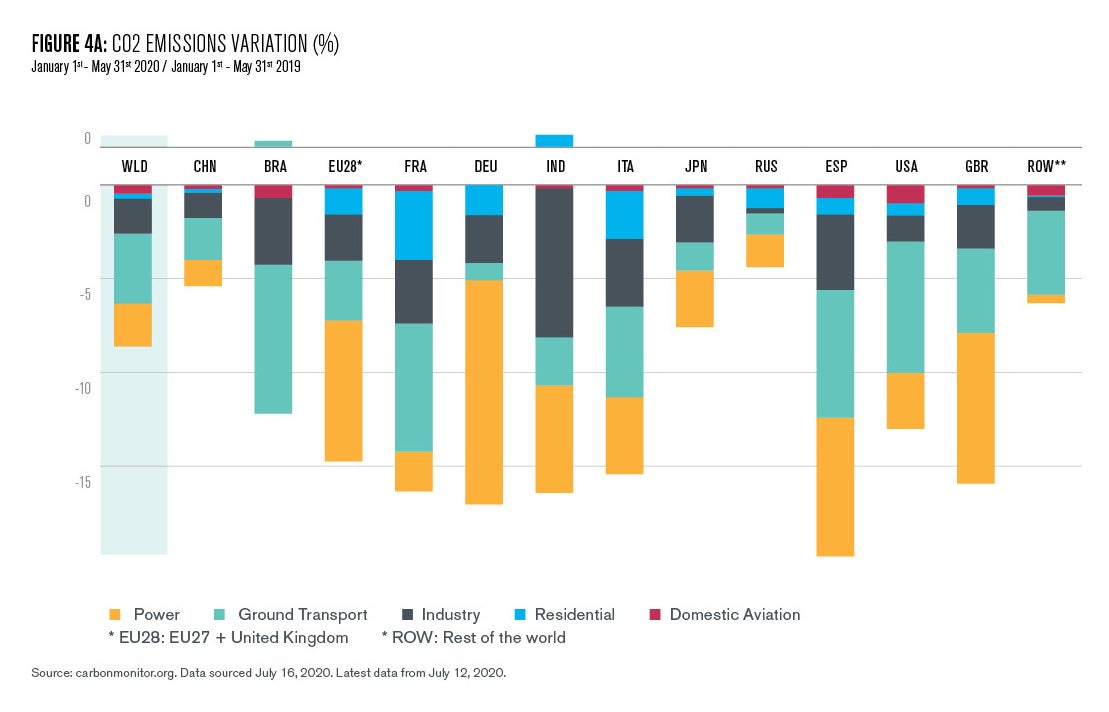
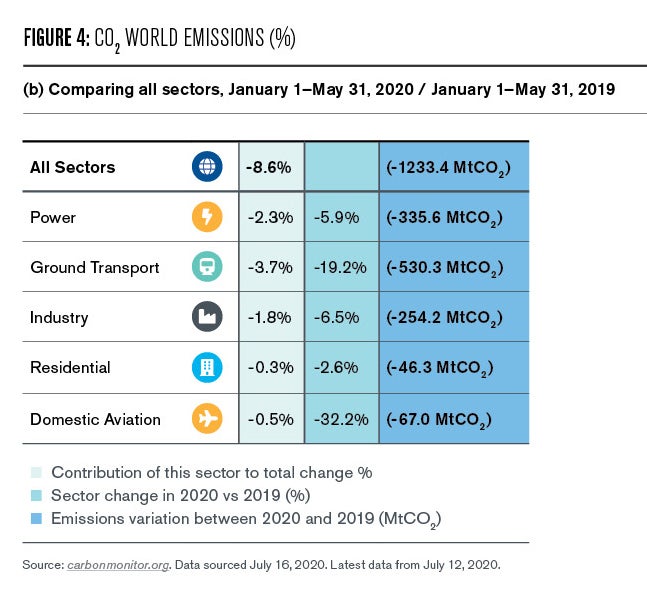
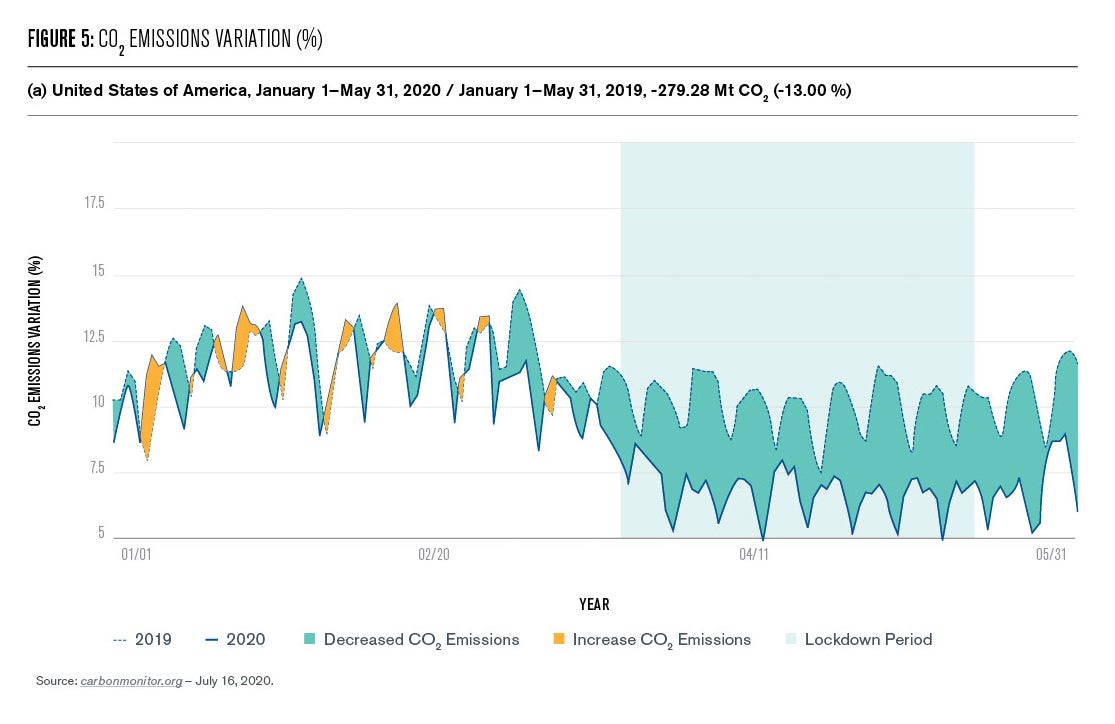
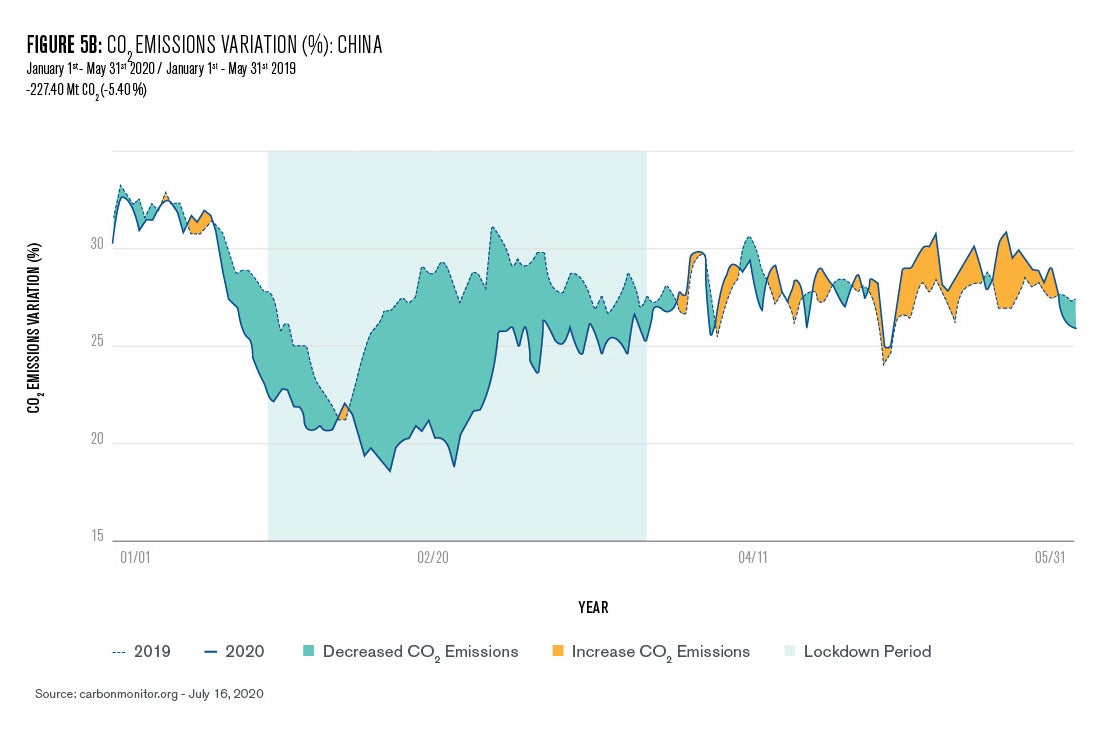
First, the unprecedented drop in energy use that accompanied the first wave of responses to COVID has been eye-opening. In a series of papers (Zhu et al. 2020) and an open-access data website, https://carbonmonitor.org, myself and a number of colleagues, led by a team at Tsinghua University, the University of California, Irvine, and the Laboratoire des Sciences du Climat et de l’Environnement (LSCE), tracked and updated in verified and open access format the changes in carbon emissions worldwide and nation by nation (Figures 4 & 5). The data are dramatic. Emissions both fell rapidly and consistently, and as policies relaxed, emissions rebounded, in many cases with stimulus/subsidy packages that rewarded existing polluters at far higher levels than the clean energy competitors.
In the U.S., the estimate is that just 0.2% of the COVID-19 stimulus package was directed to clean energy and energy efficiency (Bloomberg 2020). For comparison, solar and wind a decade ago amounted to under 2% of total U.S. generation, but today, two-thirds of all energy investments in the U.S. and worldwide are for renewable energy and energy storage4.
Thus, we are left with a stark contrast in energy and climate costs and impacts, and set of options. Before moving to the opportunities, however, one more element of the economic benefits of the clean transition needs to enter the conversation: jobs.
Often lost in the assessment of transition costs and stranded assets are the huge and diversely situated job benefits of clean energy.
In a series of market assessments and company interviews my laboratory and others have conducted, we find that the jobs multiplier of clean versus dirty energy is, well, transformative.
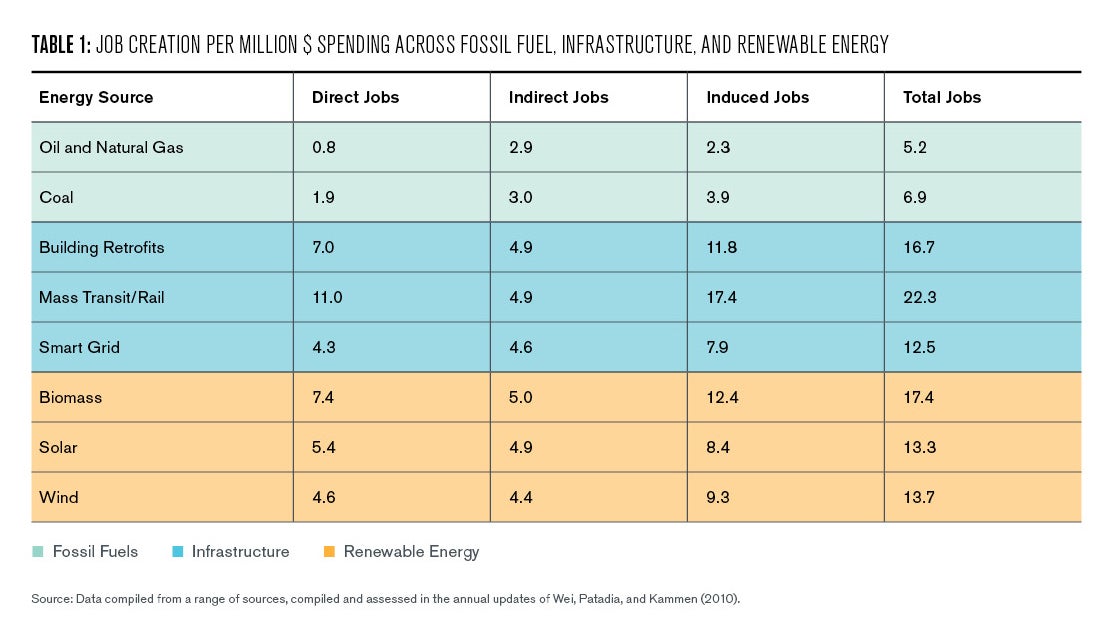
The jobs story is both striking, and unsurprising. Any time an industry is built on mining a fossil fuel, a significant fraction of the cost—up to 70% in case of the life-cycle of a natural gas power plan—is simply to pay for fuel. Whereas infrastructure and renewable energy is an investment in companies, innovation, and people. It is the pursuit of human capital and can be spread as widely as the need for energy services exists—to communities rich and poor, rural and urban.
Thus, back to the initial question, have we seen peak carbon emissions and pollution? At the 2014 APEC summit Presidents Obama and Xi committed to a “G2” of climate: the U.S. would cut emissions by one third on a state-by-state basis by 2024 under the Clean Power Plan. China would peak emissions by 2030; which was at the time exceedingly bold. Many analysts worried and complained that this was not an emissions based target, but simply a statement about the slope of the emissions curve.
In fact, China more recently indicated that peaking by 2025 is possible, and just recently, announced that with COVID-19, Chinese emissions may have peaked in late 2019, or early 2020 (Meredith 2020).
China has set a national target to become “carbon neutral” by 2060, with industrial transportation and other energy uses netting out to zero through a combination of zero-carbon electricity, advances in other sectors, and natural and human-engineered carbon sinks balancing out any remaining emissions. I am personally skeptical about banking on the land to absorb “extra” emissions, particularly as climate change impacts ecosystems. Still this is a grand plan, and an excellent place to begin.
While the U.S. abandoned the Clean Power Plan with the change in administration, in July Vice President Biden made the announcement that his administration would set 2035 as the date for a 100% clean electricity sector (in keeping with the SWITCH model results described above), and would devote 40% of spending on socially and environmentally disadvantaged areas. Both of these announcements are exceptional, but 40% of funds for “environmental justice” areas and issues even increases the levels over the California “floor” of 35% of cap-and-trade funds to be spent on EJ. Large-scale shifts to electric vehicles have a number of direct benefits, including reducing emissions in inner city areas, cutting vehicle operating costs, and providing a market for clean energy generation from solar—when supplies are high and net demand is low.
In September 2020, California announced that the sales of new internal combustion engine vehicles would be banned by 2035. Within a month, the U.S. and the State of Massachusetts announced they would end ICE sales by 2030.
A recent paper written by an international team of Chinese and U.S. researchers (of which I am a participant) found that a massive increase in electric vehicle use in China——scaling from 4 million today to 80 million by 2030—would enable China to meet their peak carbon goals far more easily and at lower cost (Li et al. 2021). U.S. Senator Schumer has proposed a “Clean Cars for America” plan that President Biden may adopt. It calls for the U.S. to scale from about 2 million electric vehicles today to over 60 million by 20305.
Thus, we are clearly at a point where strong clean energy market forces, a federally endorsed desire for social justice, and stimulus packages and plans give us an incredible opportunity to peak greenhouse gas emissions today (or even in the recent past).
While the Biden Administration has set 2035 as the date for a carbon-neutral electricity sector (and as noted at the beginning of this essay, the data is showing a number of nations are relaxing back to their pre-COVID-levels), the potential for more aggressive action is not only available to us, but increasing climate costs and the benefits of investing in a more equitable society may be just the combination needed to tip the scales.
Peaked carbon emissions is now, for the first time, arguably a social policy and ideology choice, not just a technical or economic one. The jobs, justice, and environmental quality all line up on the side of a new, green energy economy. Our actions in the coming months and very few years will determine if we choose a shared, healthy future, or quite literally destroy the world of our children.
Daniel Kammen
Professor of Energy, University of California BerkeleyDaniel Kammen is the Class of 1935 Distinguished Professor of Energy at the University of California Berkeley. Kammen was a 2019-2020 visiting scholar at the Kleinman Center.
Azevedo, Inês Lima, M. Granger Morgan, Karen Palmer, & Lester B. Lave. 2013. “Reducing U.S. Residential Energy Use and CO2 Emissions: How Much, How Soon, and at What Cost?” Environ. Sci. Technol. 2013, 47, 6, 2502–2511. https://doi.org/10.1021/es303688k
Bloomberg New Energy Finance. 2020. https://www.bloomberg.com/features/2020-green-stimulus-clean-energy-future/
Bo Li, Ziming Ma, Patricia Hidalgo-Gonzalez, Alex Lathem, Natalie Fedorova, Gang He, Haiwang Zhong, Minyou Chen & Daniel M. Kammen. 2021. “Modeling the Impact of EVs in the Chinese Power System: Pathways for Implementing Emissions Reduction Commitments in the Power and Transportation Sectors.” Energy Policy, 149, 111962.
Carter, Stephen A. 2016. “Behind the NFL’s Sinking Ratings: Have We Reached ‘Peak Football?’ New York Post, October 15, https://nypost.com/2016/10/15/behind-the-nfls-sinking-ratings-have-we-reached-peak-football/
Carvallo, Juan Pablo, Brittany J. Shaw, Nkiruka I. Avila, and Daniel M. Kammen. 2017. “Sustainable Low-Carbon Expansion for the Power Sector of an Emerging Economy: The Case of Kenya.” Environmental Science & Technology (ES&T), 51 (17), pp 10232–10242 DOI: 10.1021/acs.est.7b00345
Deffeyes, Kenneth S. 2001. Hubbert’s Peak: The Impending World Oil Shortage (Princeton University Press).
Duke, R. D., and Kammen, D. M. 1999. “The Economics of Energy Market Transformation Initiatives.” The Energy Journal, 20 (4), 15 – 64.
Farrell, Alex E. and Adam R. Brandt. 2006. “Risks of the Oil Transition.” Environmental Research Letters 1(1). DOI: 10.1088/1748-9326/1/1/014004
Fripp, Matthias. 2012. “Switch: A Planning Tool for Power Systems with Large Shares of Intermittent Renewable Energy.” Environmental Science & Technology, 46 (11), 6371 – 6378.
Gang He, Anne-Perrine Avrin, James H. Nelson, Josiah Johnston, Ana Mileva, Jianwei Tian, and Daniel M. Kammen. 2016. “SWITCH-China: A Systems Approach to Decarbonizing China’s Power System.” Environmental Science & Technology (ES&T), 50(11): 5467–5473. DOI: 10.1021/acs.est.6b01345
Grove, Noel. 1974. “Oil, the Dwindling Treasure.” National Geographic, June.
Hubbert, M. King. 1962. “Energy Resources.” National Academy of Sciences, Publication 1000-D.
International Institute for Sustainable Development (IISD) https://sdg.iisd.org/news/renewable-energy-investment-to-surpass-sd-2-5-trillion-for-2010-2019-unep-report-finds/
International Energy Agency (IEA). https://www.iea.org/articles/low-fuel-prices-provide-a-historic-opportunity-to-phase-out-fossil-fuel-consumption-subsidies
Kammen, Daniel M. 2020. “How Electric Vehicles Can Help Advance Social Justice.” June 22, 2020. https://www.sfchronicle.com/opinion/article/How-electric-vehicles-can-help-advance-social-15351293.php
Kittner, Noah, Lil, Felix, and Daniel M. Kammen. 2017. “Energy Storage Deployment and Innovation for the Clean Energy Transition.” Nature Energy, 2, 17125.
Koomey, Jonathan, Marilyn Brown, Richard Brown, Chris Calwell, Ralph Cavanagh, Rick Diamond, Joseph H. Eto, Ashok Gadgil, Howard Geller, José Goldemberg, Chuck Goldman, David Goldstein, Steve Greenberg, Holmes Hummel, Dan Kammen, Skip Laitner, Mark Levine, Amory Lovins, Gil Masters, Jim McMahon, Alan Meier, Evan Mills, Steve Nadel, Bruce Nordman, Lynn Price, Marc Ross, Jayant Sathaye, James Sweeney, Diana Vorsatz, John Wilson, and Ernst Worrell. 2009. “Defining a Standard Metric for Electricity Savings.” Environmental Research Letters, 5, 1 – 10. doi:10.1088/1748-9326/5/1/014017
Lovins, Amory. 1976. “Energy Strategy: The Road Not Taken”, Foreign Affairs, 55(1): 65–96.
Marcacci, S. 2020. “Renewable Energy Prices Hit Record Lows: How Can Utilities Benefit from Unstoppable Solar and Wind?” Forbes, 21 January. https://www.forbes.com/sites/energyinnovation/2020/01/21/renewable-energy-prices-hit-record-lows-how-can-utilities-benefit-from-unstoppable-solar-and-wind/#50c0a2e62c84
Meredith, Sam. 2020. “The Coronavirus Crisis Means We May Have Already Reached Peak Carbon.” https://www.cnbc.com/2020/04/20/the-coronavirus-crisis-means-we-may-have-already-reached-peak-carbon.html
Mileva, A., Nelson, J. H., Johnston, J., and Kammen, D. M. 2013. “SunShot Solar Power Reduces Costs and Uncertainty in Future Low-Carbon Electricity Systems.” Environmental Science & Technology, 47 (16), 9053 – 9060. dx.doi.org/10.1021/es401898f
Mileva, A., Johnston, J., Nelson, J. H., and Kammen, D. M. 2016. “Power System Balancing for Deep Decarbonization of the Electricity Sector.” Applied Energy 162, 1001–1009. DOI: dx.doi.org/10.1016/j.apenergy.2015.10.180
Nelson, J. H., Johnston, J., Mileva, A., Fripp, M., Hoffman, I., Petros-Good, A., Blanco, C., and Kammen, D. M. 2012. “High-resolution modeling of the western North American power system demonstrates low-cost and low-carbon futures.” Energy Policy, 43, 436–447.
Ponce de Leon Barido, Diego, Josiah Johnston, Maria V. Moncada, Duncan Callaway and Daniel M. Kammen. 2015. “Evidence and Future Scenarios of a Low-Carbon Energy Transition in Central America: A Case Study in Nicaragua.” Environmental Research Letters, 10, doi:10.1088/1748-9326/10/10/104002
Recurve. 2020. “California Changes Marginal Energy Source Standard from Natural Gas to Energy Storage.” April 15. https://www.recurve.com/blog/the-cpuc-just-changed-marginal-energy-source-natural-gas-to-battery-storage#.XxBHEzizX74.twitter
Reuters. 2020. “China to Make National Carbon Trading ‘Breakthrough’ by Year-End.” January 13, https://www.reuters.com/article/us-china-carbon/china-to-make-national-carbon-trading-breakthrough-by-year-end-official-idUSKBN1ZD05N
Rosenfeld Arthur H. 1999. “Art of Energy Efficiency: Protecting the Environment with Better Technology,” Annual Review of Energy and the Environment, 24: 33 – 82. DOI: 10.1146/annurev.energy.24.1.33
Wei, M., Patadia, S. and Kammen, D. M. 2010. “Putting renewables and energy efficiency to work: How Many Jobs Can the Clean Energy Industry Generate in the U. S.?” Energy Policy, 38, 919 – 931.
Zhu Liu, Zhu Deng, Philippe Ciais and Ruixue Lei, Steven J. Davis, Sha Feng and Bo Zheng and Duo Cui and Xinyu Dou and Pan He and Biqing Zhu and Chenxi Lu and Piyu Ke and Taochun Sun and Yuan Wang and Xu Yue and Yilong Wang and Yadong Lei and Hao Zhou and Zhaonan Cai and Yuhui Wu and Runtao Guo and Tingxuan Han and Jinjun Xue and Olivier Boucher and Frederic Chevallier and Eulalie Boucher and Yimin Wei and Qiang Zhang and Dabo Guan and Peng Gong and Daniel M. Kammen and Kebin He and Hans Joachim Schellnhuber. 2020. “COVID-19 Causes Record Decline in Global CO2 Emissions,” Nature Communications, submitted and available on the open access preprint site: arXiv:2004.13614
Zheng, Bo, Guannan Geng, Philippe Ciais, Steven J. Davis, Randall V. Martin, Jun Meng, Nana Wu, Frederic Chevallier, Gregoire Broquet, Folkert Boersma, Ronald van der A, Jintai Lin, Dabo Guan, Yu Lei, Kebin He and Qiang Zhang. 2020. Satellite-based estimates of decline and rebound in China’s CO2 emissions during COVID-19 pandemic”, Sci Adv, 6 (49). DOI: 10.1126/sciadv.abd4998
- Establishing a nationwide emissions trading scheme (ETS) was one of the pledges made by China ahead of the Paris climate change agreement of 2015, but implementation has been repeatedly delayed amid concerns about transparency and the quality of the nation’s emissions data. “We will strive to make a breakthrough in progress before the year-end,” said Li Gao, head of the climate office at the Ministry of Ecology and Environment, speaking on the sidelines of a conference in Beijing (Reuters 2020). [↩]
- https://www.whitehouse.gov/briefing-room/presidential-actions/2021/01/20/executive-order-protecting-public-health-and-environment-and-restoring-science-to-tackle-climate-crisis/ [↩]
- SWITCH: Solar and Wind Integrated with Transmission and Conventional Generation. [↩]
- International Energy Agency, World Energy Investments 2020; https://www.iea.org/reports/world-energy-investment-2020. [↩]
- https://www.democrats.senate.gov/newsroom/press-releases/leader-schumer-unveils-new-clean-cars-for-america-climate-proposal-a-transformative-plan-to-reduce-number-of-carbon-emitting-cars-on-the-road-create-jobs-and-accelerate-transition-net-zero-carbon-emissions- [↩]
