Communicating Climate Policy: Raising Public Awareness through Trusted Sources

Studying public perception of previously enacted legislation can inform future climate policy communication efforts. We surveyed Philadelphians to gather insights about their perceptions related to benefits in the IRA (specifically, benefits meant to reduce the cost of making energy efficiency upgrades to homes), and aimed to understand how energy policy might be better communicated to the general public using sources or messengers people trust.
At A Glance
Key Challenge
When the success of implementing a policy requires action from the public, communication efforts will be needed to raise awareness and provide people with information they need to make policy-relevant decisions. Yet, efforts may be ineffective if people do not trust the source conveying information.
Policy Insight
Encouragingly, study participants were receptive to information about the IRA from multiple sources, including a utility company and national nonprofit. Ensuring sources like these provide accessible information related to energy policies in the future may increase public action toward policy goals.
The Inflation Reduction Act (IRA), signed into law in 2022 and now largely dismantled by the recently enacted One Big Beautiful Bill Act (OBBBA), directed funding to a variety of initiatives meant to address climate change by reducing greenhouse gas emissions. For example, to tackle emissions from household energy consumption, the IRA offered financial incentives for people to make energy efficiency and electrification upgrades to their homes (The White House 2023a). Depending on household income, the IRA offered tax credits and rebates to help people weatherize and improve insulation, install energy efficient appliances, improve space heating and cooling, and more.
These types of credits and homeowner incentives have recently been curtailed with the early phase-outs and restrictions outlined in OBBBA. Despite this, studying public perception surrounding previously enacted legislation can serve to inform future climate policy efforts. This research, which was conducted prior to the 2024 election, studied public perception related to the IRA, and aimed to understand how energy policy might be better communicated to the general public using sources or messengers people trust.
Trusted Sources
When the success of implementing a policy requires action from the public (as is in the case of the IRA, where members of the general public would have needed to decide to make changes to their homes), it is essential to ensure that people have the information they need to make decisions related to the policy’s goals. Research shows that people are more accepting of information that comes from sources they view as credible, which are generally sources people perceive to be experts on a relevant subject, trustworthy, and caring or well-intentioned (Maibach et al. 2023). Therefore, to raise awareness of a policy and interest in its benefits, careful consideration should be given to which messengers are conveying information about the policy to the public.
Government agencies and administrations, nonprofit organizations, and utility companies are all groups that communicate with the public about energy or energy issues, and in some cases, have already served as public resources for learning about policies like the IRA. Therefore, the public may naturally encounter information related to energy policy from such sources, so it is important to explore if the public responds well to these types of organizations.
In this research, we consider how receptive people may or may not be to messages about the IRA coming from the organizations below:
The White House. At the time of the IRA’s passing, the White House created a webpage1 to highlight the benefits (i.e., tax credits and rebates) available through the IRA for homeowners. With the IRA being a product of the Biden administration, some may have viewed the White House as a reliable source of information about these benefits. Yet, political polarization surrounding the Biden administration may have made this source less effective, particularly among Republicans. Understanding how people felt about IRA messaging coming from the White House is especially important considering many people likely first heard of the IRA while Democrats were promoting the accomplishment of passing this legislation.
Nonprofit organizations. Nonprofits in the climate change, energy, or justice spaces may have sought ways to share information about IRA benefits to increase benefit uptake from homeowners, especially in low-income communities, and drive national electrification efforts. People may view nonprofit organizations favorably and trust these organizations. Indeed—in a 2023 study from Indiana University’s Lilly Family School of Philanthropy—nearly 4 in 10 (39%) of Americans trust nonprofit organizations, with far fewer trusting the President/executive branch (13.6%), Congress/legislative branch (5.9%), and large corporations (5.8%) (Clark et al. 2023). However, despite this trust, nonprofits could also struggle with name recognition or lack of familiarity, negatively impacting trust or reach of their information.
Utility companies. Utility companies are the primary electricity providers for Americans, and many utilities include information on their websites that aim to connect people to energy savings tips and energy appliance rebates available to them. As such, people may be used to seeing this type of information from utility companies, which would have made them a natural platform to communicate with customers about IRA benefits.
At the same time, people who have had negative experiences with utilities (e.g., billing or otherwise), may be less receptive to their messages. Further, because utility companies make money from people using energy, consumers may be skeptical as to why they would encourage people to use less energy (Glavan 2021).
However, some states (including Pennsylvania, New Jersey, New York, Maine, Colorado, and New Mexico) have laws that require companies to use less energy over time, so it is also in some utility companies’ best interest for people to reduce energy consumption (American Council for an Energy-Efficient Economy 2019). Despite these types of challenges, industry and academic research has suggested that utility companies can play an important role in helping people save energy and make energy efficiency upgrades to their homes (Glavan 2021; Uplight 2021; and Ramirez, Oloriz, and Simović 2023).
Given that people could have encountered information about the IRA from multiple sources, we conducted an online survey experiment to explore the potential for each of these communication avenues to drive awareness and uptake. We measured participants’ perceptions of sources that might convey information about the IRA, participants’ intentions to use or learn more about IRA benefits, and more, to provide insights that may inform strategies for communicating about legislation with the public.
Methods
The online survey experiment was fielded in June and July of 2024 via Qualtrics, an online survey vendor, where participants (n = 1,087) read about IRA benefits available to homeowners and answered questions about their intentions and perceptions related to the IRA and its benefits. All participants read the same general information about IRA benefits, with slight differences between the information provided to renters versus homeowners to ensure it was relevant to participants’ living situation.
Immediately prior to reading about the benefits, we varied the source from which we told participants the information on the benefits came from. This enabled us to compare participants’ receptivity to hypothetical messaging from the White House, a nonprofit organization (Rewiring America2 ), and a utility company (PECO3, a utility company local to Philadelphia).

Participants
To ground our testing of IRA messengers in a local context, we chose to sample Philadelphians. First and foremost, choosing a specific location allowed us to test the efficacy of using a local utility company as a messenger of IRA information. Secondly, with a population of approximately 1.6 million people, Philadelphia is one of the largest yet poorest cities in the United States, is economically and racially diverse, and has many older residential buildings that may need improvements (Kramer 2018; Benson 2023; U.S. Census Bureau. n.d.).
Given this, many Philadelphia neighborhoods meet the criteria to be considered a disadvantaged community under the Justice40 Initiative (which aimed to direct 40% of benefits to communities that are overburdened by pollution or marginalized by underinvestment) meaning strong uptake of the IRA benefits could be particularly impactful to some Philadelphia communities (Council on Environmental Quality n.d., The White House 2023b).
The demographic characteristics of our pool of participants roughly matched Philadelphia census demographics (Table 1), and we also split our survey between homeowners and renters, with one arm of the survey including questions for homeowners and another for renters. Because most IRA benefits were only available for homeowners or property owners, we ensured that the majority of participants in our study (60%) considered themselves homeowners in Philadelphia.
However, to represent the needs and perspectives of Philadelphia renters (a large share of the population in Philadelphia), it was important to also include renters in the survey (Pew Charitable Trusts 2024). Insights derived from renters’ responses may be useful in demonstrating a policy gap or informing future policy that considers this population more directly.
Experimental Design
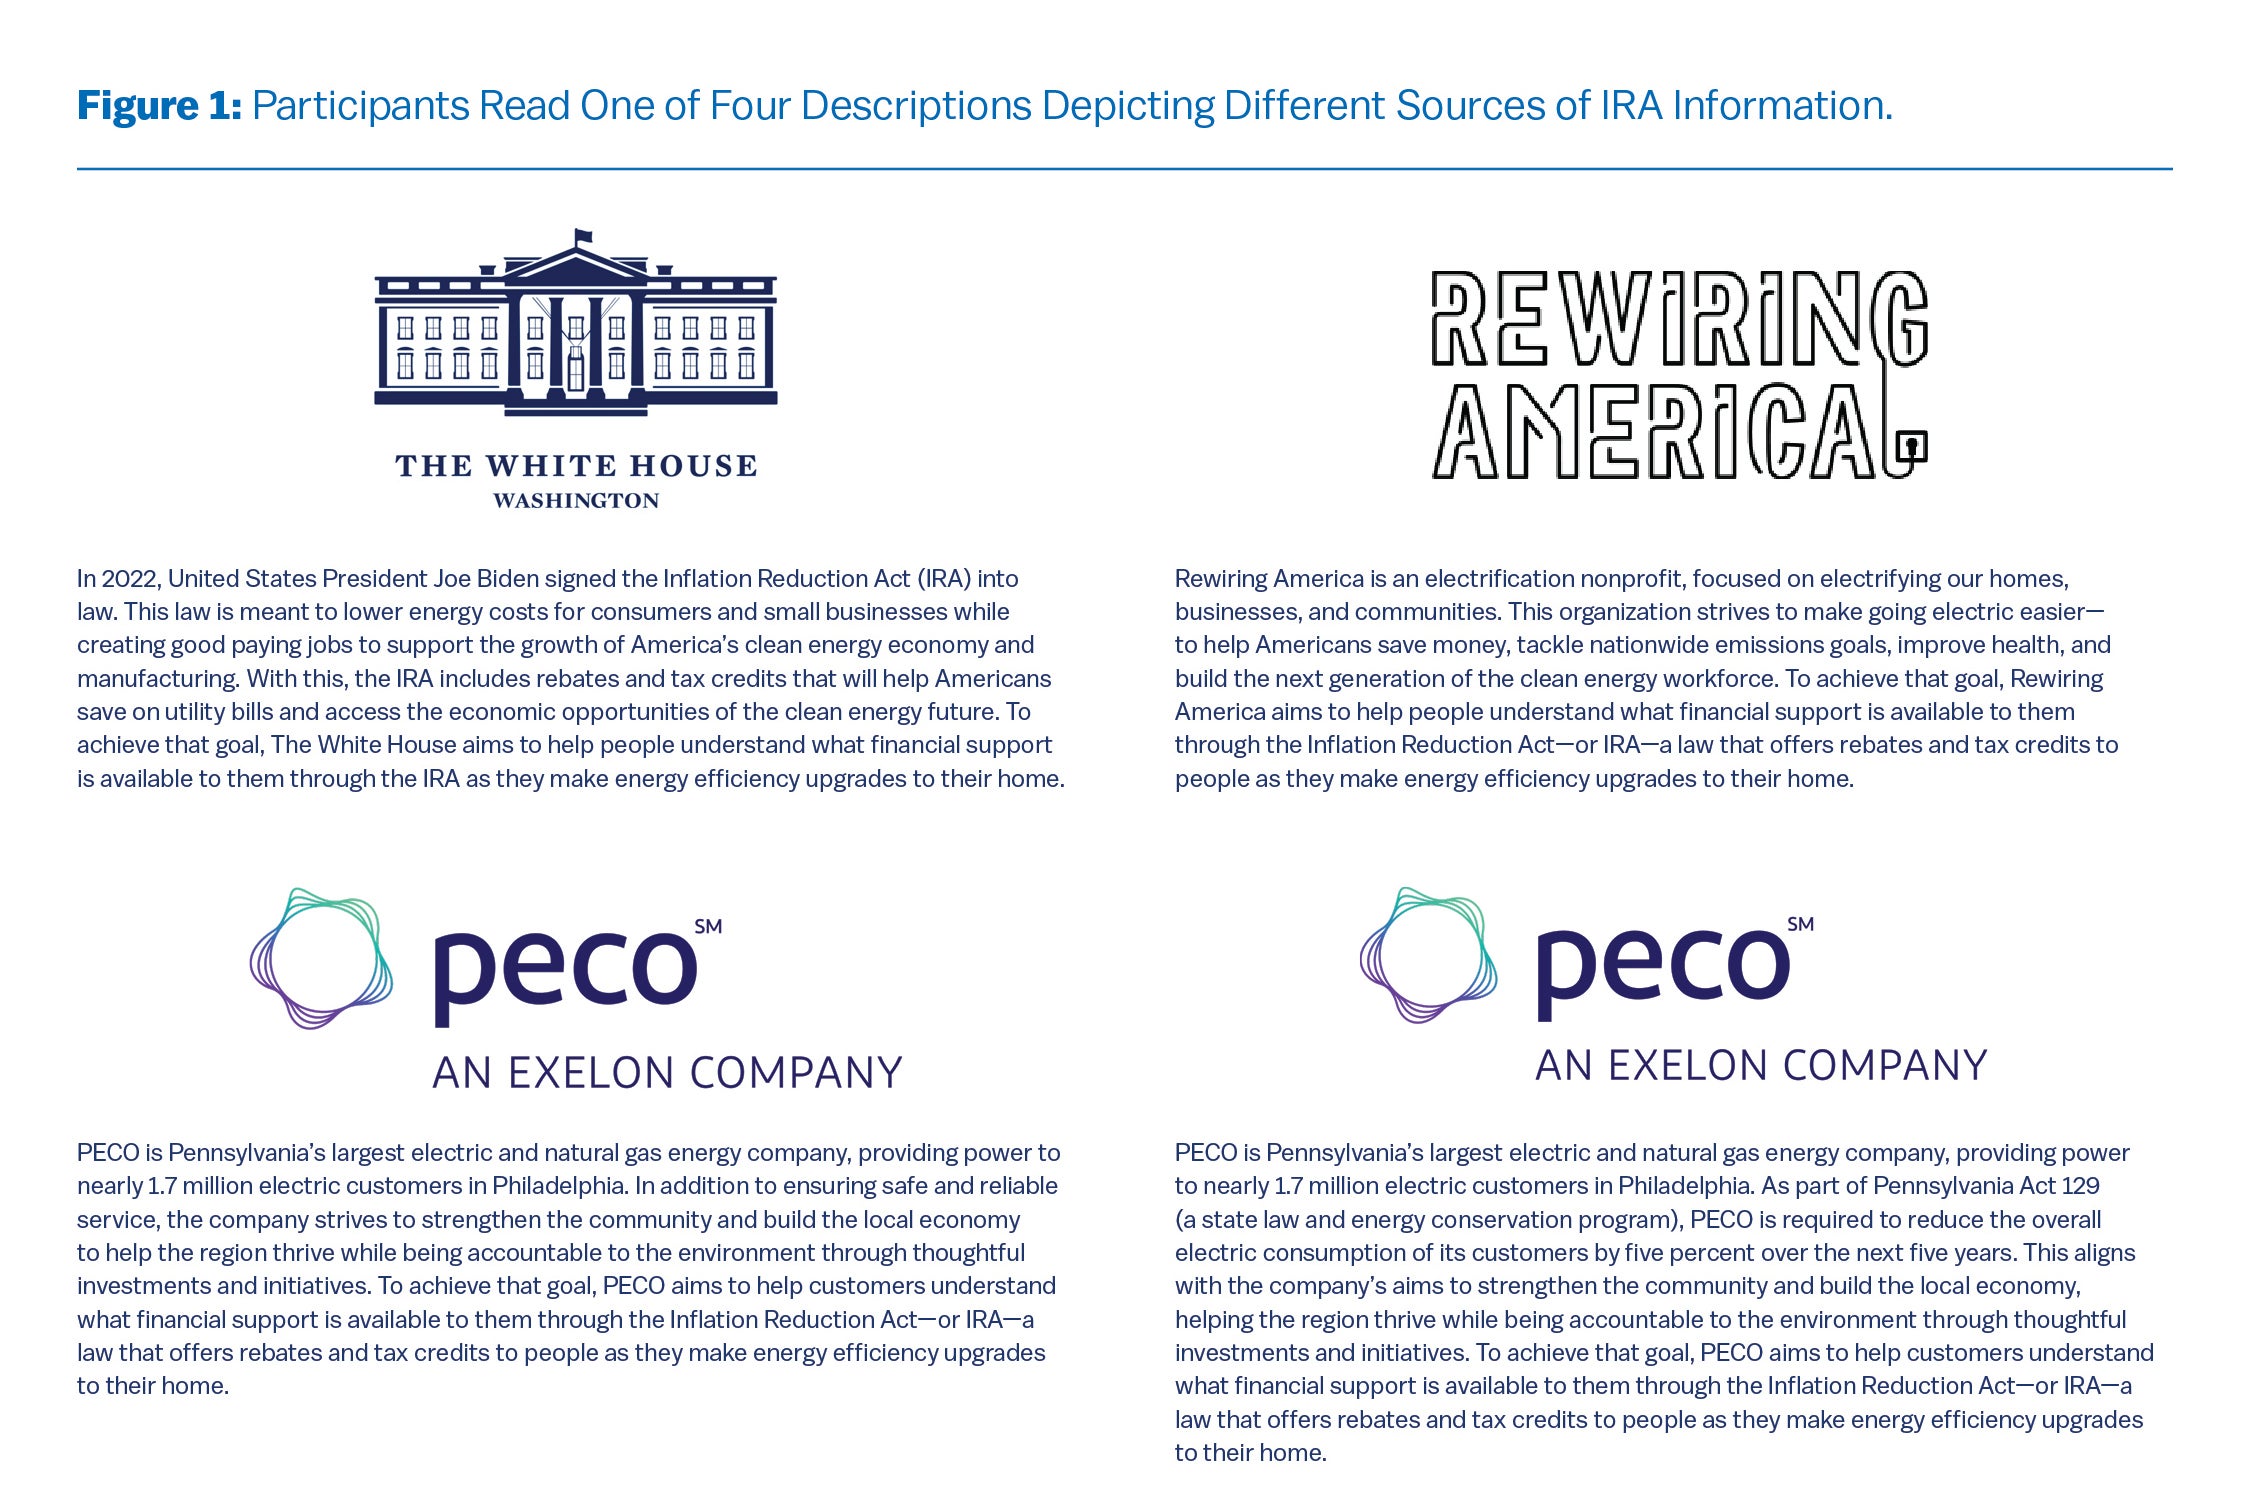
Prior to reading any information about the IRA, we asked participants if they were homeowners or renters, what improvements their home needed, and if they had ever heard of the IRA or its benefits. After these initial questions, we randomly sorted participants into one of four groups, where they read short descriptions about the White House, Rewiring America (a nonprofit organization), PECO (Philadelphia’s local utility), or PECO with an added mention of a Pennsylvania state law that requires the company to lower energy use over time, which could help explain to Philadelphian’s why the company would be sharing information on the IRA.
Given that the policy originated in the White House during the Biden administration, we included it as one of our information sources to serve as a baseline to compare its effectiveness as an information source to that of non-partisan sources, like nonprofits and utility companies.
We chose Rewiring America to represent a nonprofit organization in our experiment because their website offers comprehensive information to help people clearly understand which IRA benefits they were eligible for and how much money they might save.
Lastly, with PECO being the utility provider for Philadelphia, and by localizing the study, we were able to test the effectiveness of such providers as IRA messengers (both with and without the added justification related to the Pennsylvania state law). Each source description shown to participants described the source itself and explained how they aimed to inform the public about the IRA benefits for home upgrades (Figure 1).
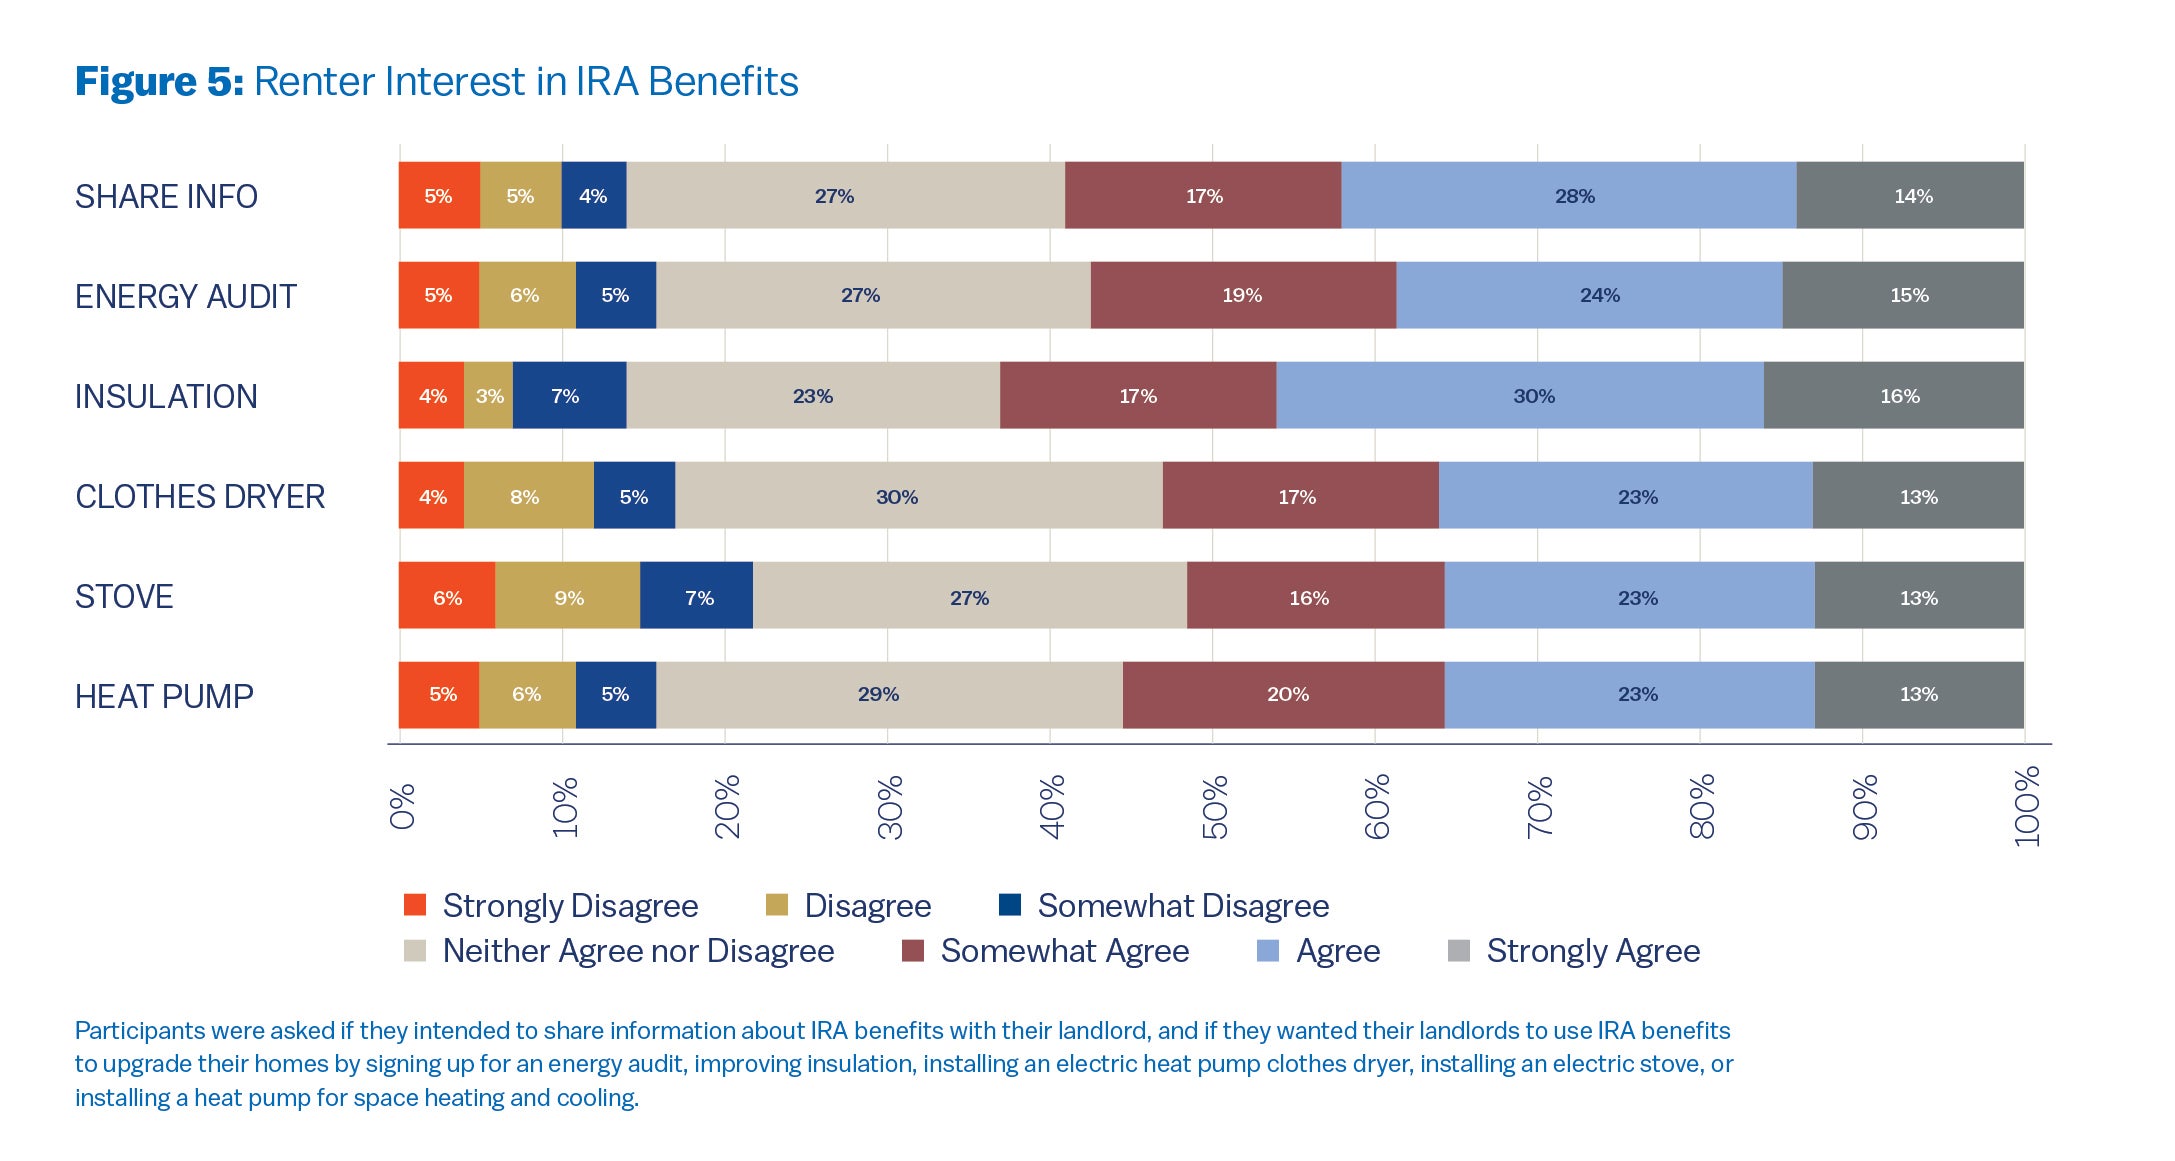
After learning about the information source, all participants read the same information about IRA tax credits and rebates available for weatherization/improving home insulation, getting a free or discounted energy audit to identify areas of poor insulation, installing energy-efficient clothes dryers and stoves, and improving space heating and cooling with a heat pump. Information given to homeowners and renters only differed in that renters were informed that while they could not take advantage of these benefits personally, landlords and property owners would qualify (Figure 2).
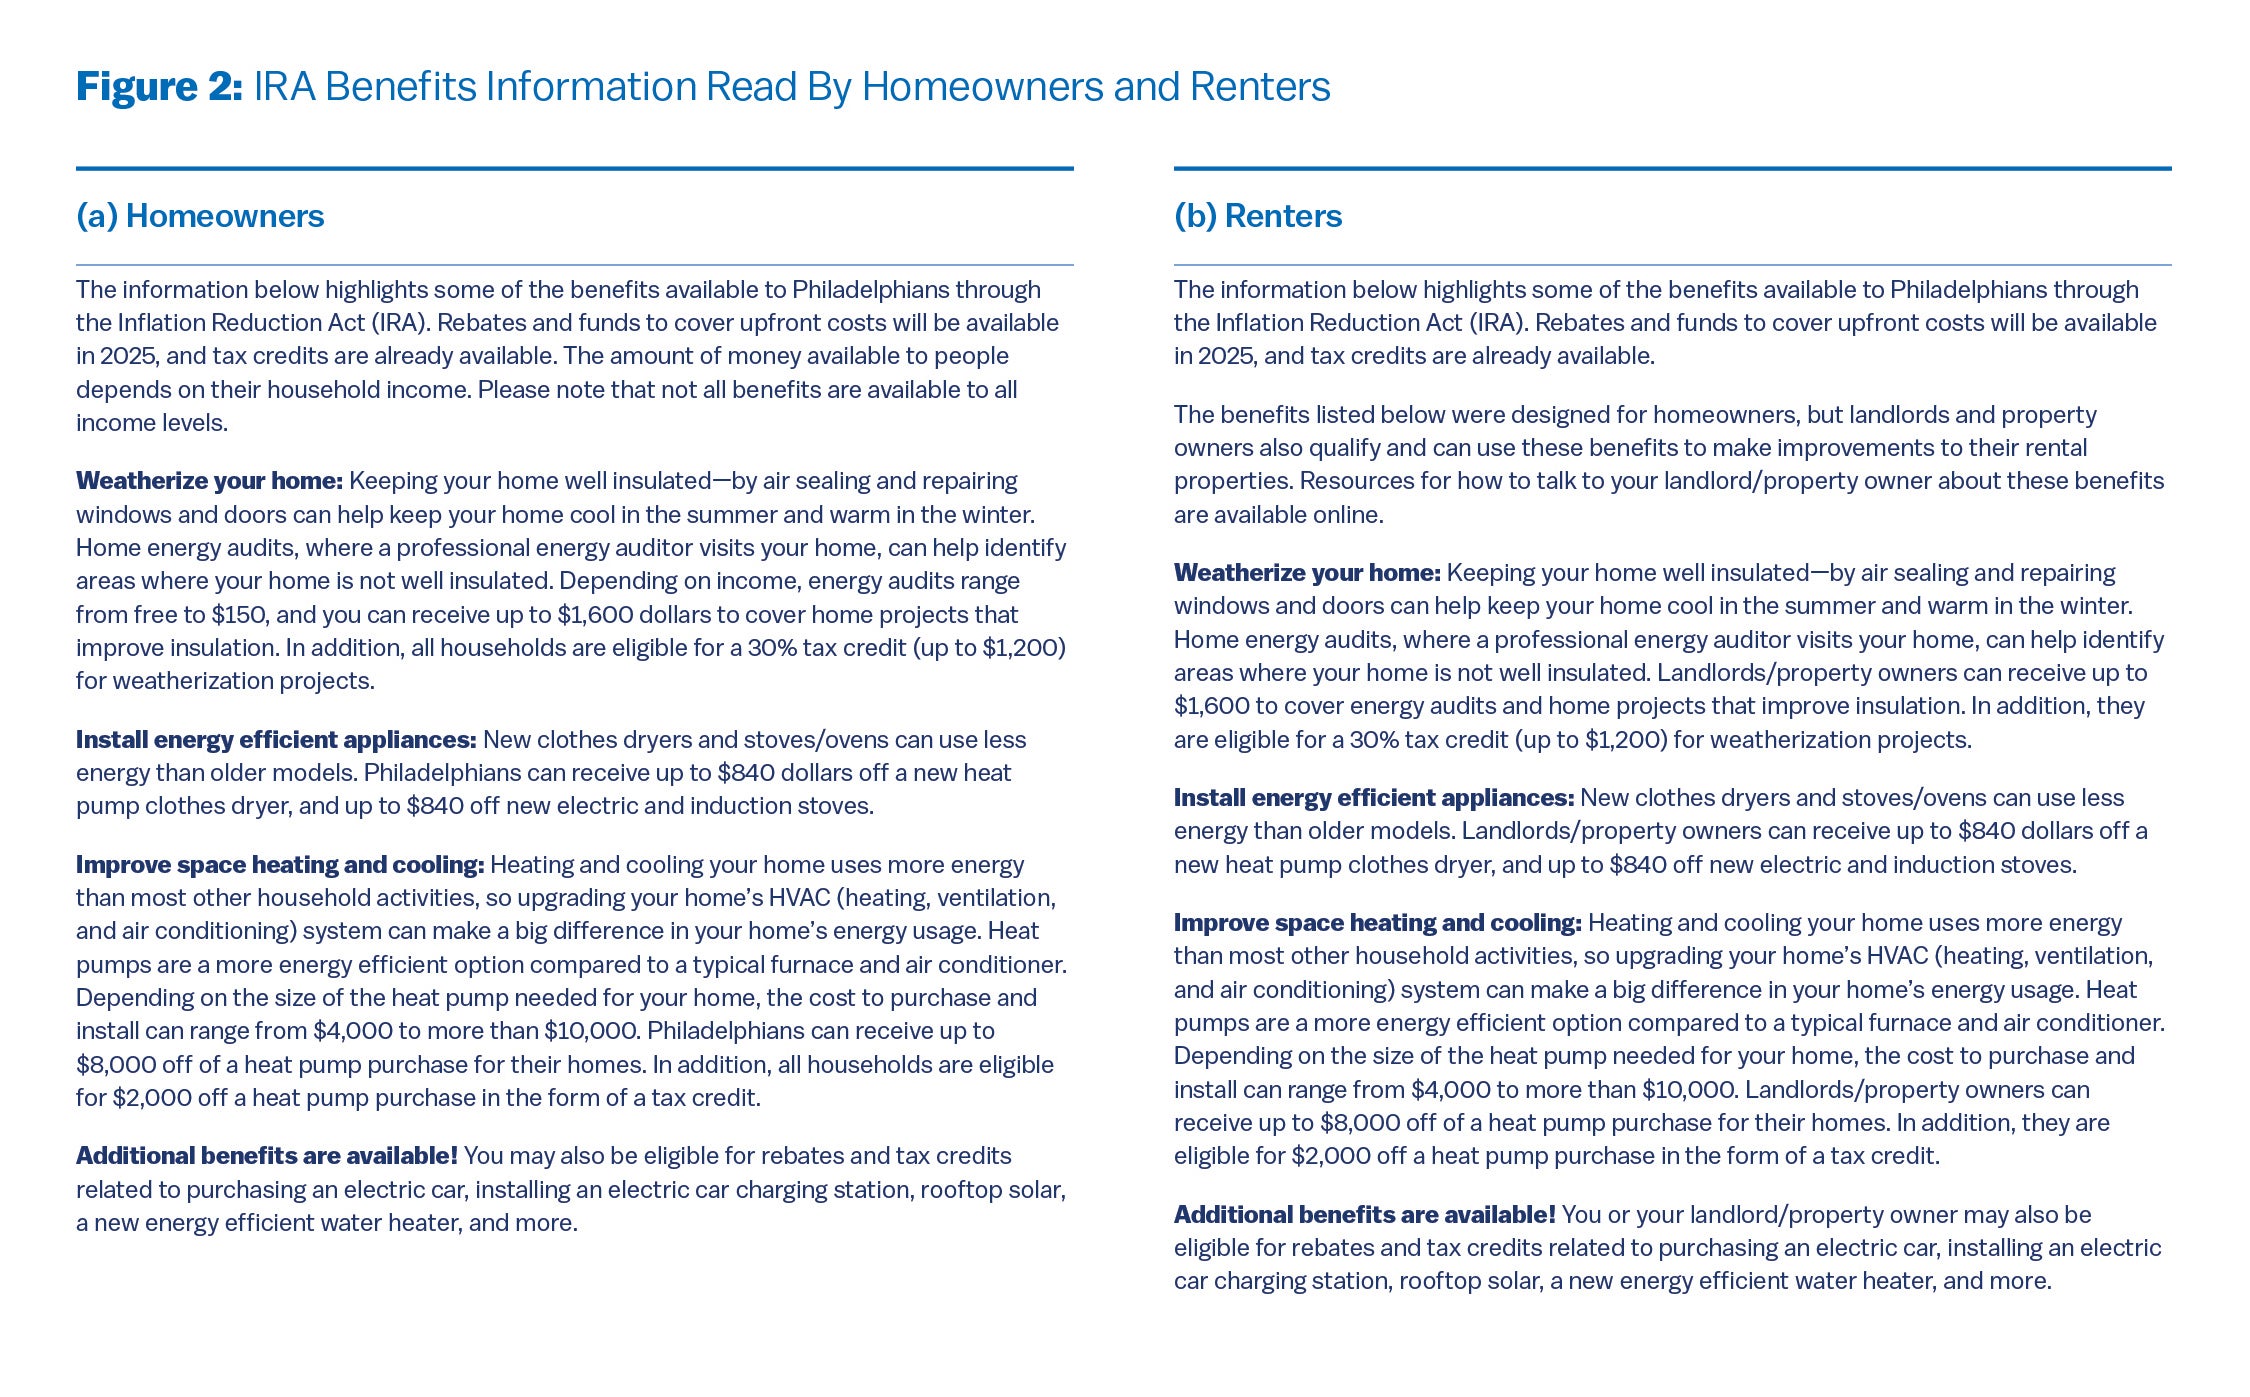
Participants were also informed that rebates would be offered “up to” a certain dollar amount, depending on household income. Thus, we did not ask participants to calculate exactly how large their eligible benefit would be for each home upgrade. It is important to note that participants’ interest in the upgrades, reported later, could vary once they became aware of exactly what they qualified for.
We measured participants’ receptivity to sources by asking homeowners how likely they would be to take advantage of each of the IRA benefits described within the next few years, along with their likelihood of seeking out more information about the benefits (α = .91). We asked renters if they would like their landlord to use IRA benefits to make each of these home improvements (α = .88).
In addition, we asked how much they agreed that the source they read about: “is a reliable source of information about the IRA”; “cares about helping Americans improve the value of their home”; and simply “is trustworthy.” Responses to these and several other statements were combined to represent how much participants trust each source (α = .94).
Findings
Awareness of the IRA and Need for IRA Benefits
More than three-fourths (77%) of our sample was aware that there were “financial benefits available to homeowners through the government to make energy efficiency or electrification upgrades to their homes,” and more than half (62%) had heard about the Inflation Reduction Act (IRA) prior to the start of the survey.4
Despite high overall awareness in our sample, we found that some groups of people were more aware than others. People who have a higher income, identify as white and non-hispanic, and are homeowners had greater awareness of the IRA and the availability of homeowner benefits (see Appendix Section 1). Therefore, to ensure this type of information reaches lower income and racially diverse populations, it is important to evaluate if receptivity to sources varies specifically among these groups. For example, the most effective source among lower income participants may not be the same as the most effective source for the overall sample.
When asked about the current state of their homes, results support the idea that there’s high need in Philadelphia among both homeowners and renters (Table 2) and that those who are most worried about being able to meet their basic needs (e.g., pay for housing, food, etc.) are also more likely to indicate their home may need a greater number of improvements (r = .34). In addition, nearly 8 in 10 participants (78%) in our sample at least somewhat agree that other houses or apartment buildings in their community could use improvements.

It is important to note that high prior awareness of the IRA and high need for home improvements among participants suggests Philadelphians may be a particularly receptive audience to learning about IRA benefits, potentially impacting their responses to the information in the survey. Nationally representative samples or samples from other cities might have been less aware of the IRA or less receptive to information about the benefits.
Receptivity to Sources and Interest in Benefits
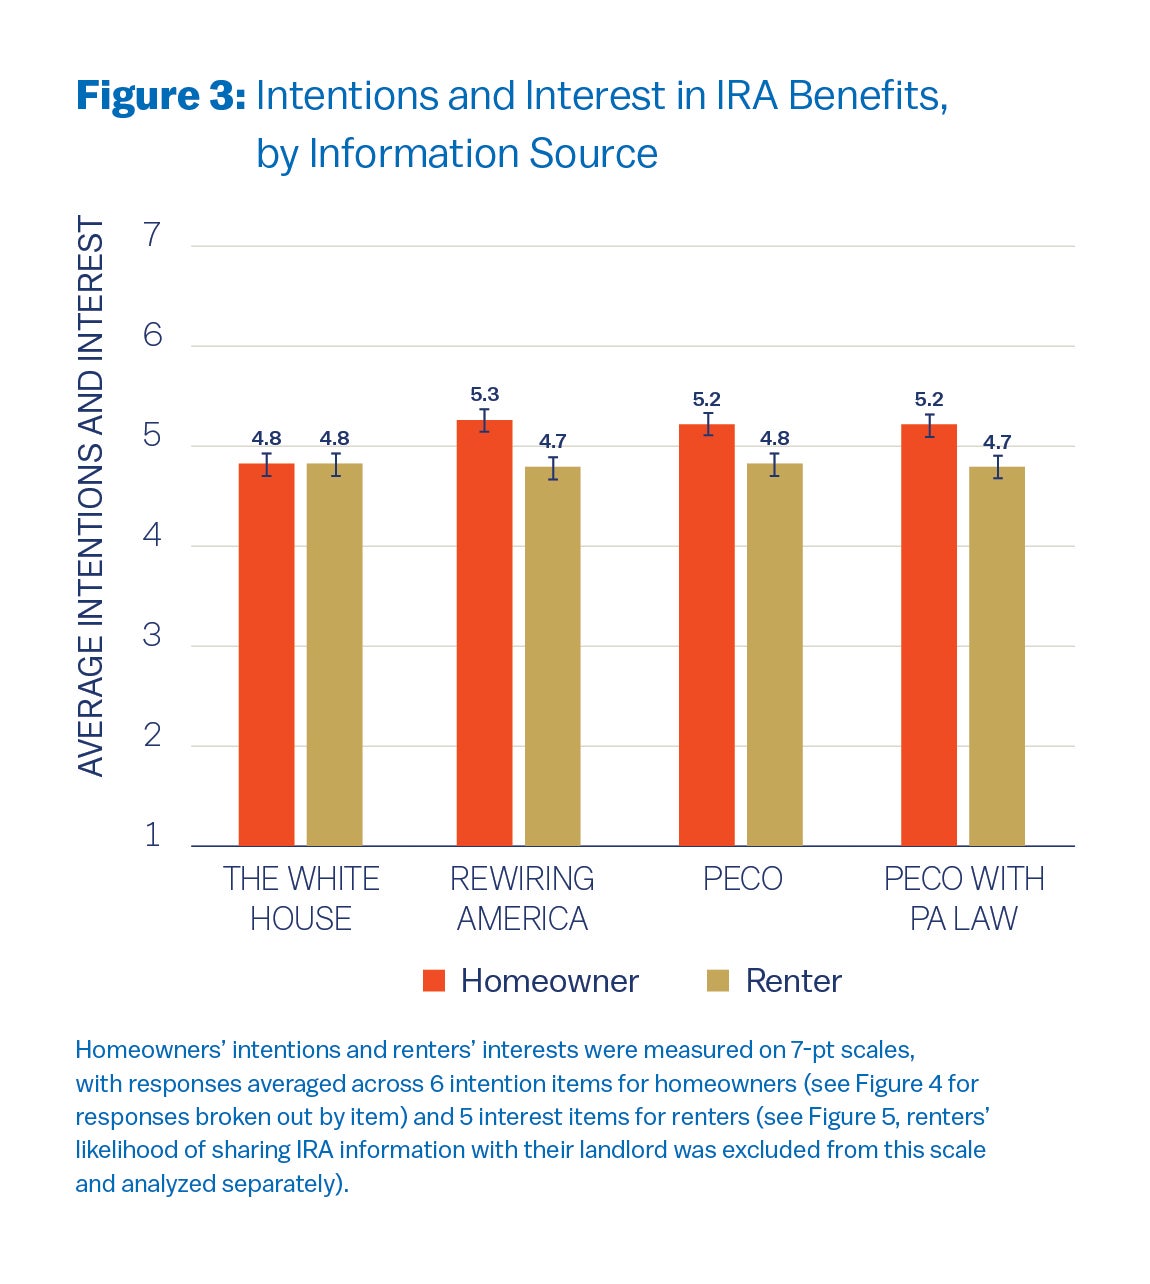
Overall, we found that participants were least receptive to IRA messaging from the White House, in that homeowners were slightly less likely to indicate an intention to use IRA benefits when participants received information from that source (Figure 3). This was true regardless of the homeowner’s political ideology, meaning the White House was a slightly less effective messenger for both more liberal and more conservative participants. See Appendix Section 2 for statistical tests.
Renters were not impacted by the source of the information in terms of how likely they were to want their landlords to use IRA benefits, however, both homeowners and renters also viewed the White House as the least trustworthy source (Appendix Section 2).
Aside from the White House, renters and homeowners were equally receptive to all other sources. Meaning, there were no significant differences in how participants responded to PECO regardless of whether or not information was included that explained how Pennsylvania requires PECO to reduce energy use, and no significant differences between either of these groups and Rewiring America (Appendix Section 2). In addition, accounting for participants’ income and race/ethnicity did not change these results, meaning no source stood out as resonating exceedingly well among lower-income and racially/ethnically diverse participants as compared to the rest of the sample (See Appendix Section 3).
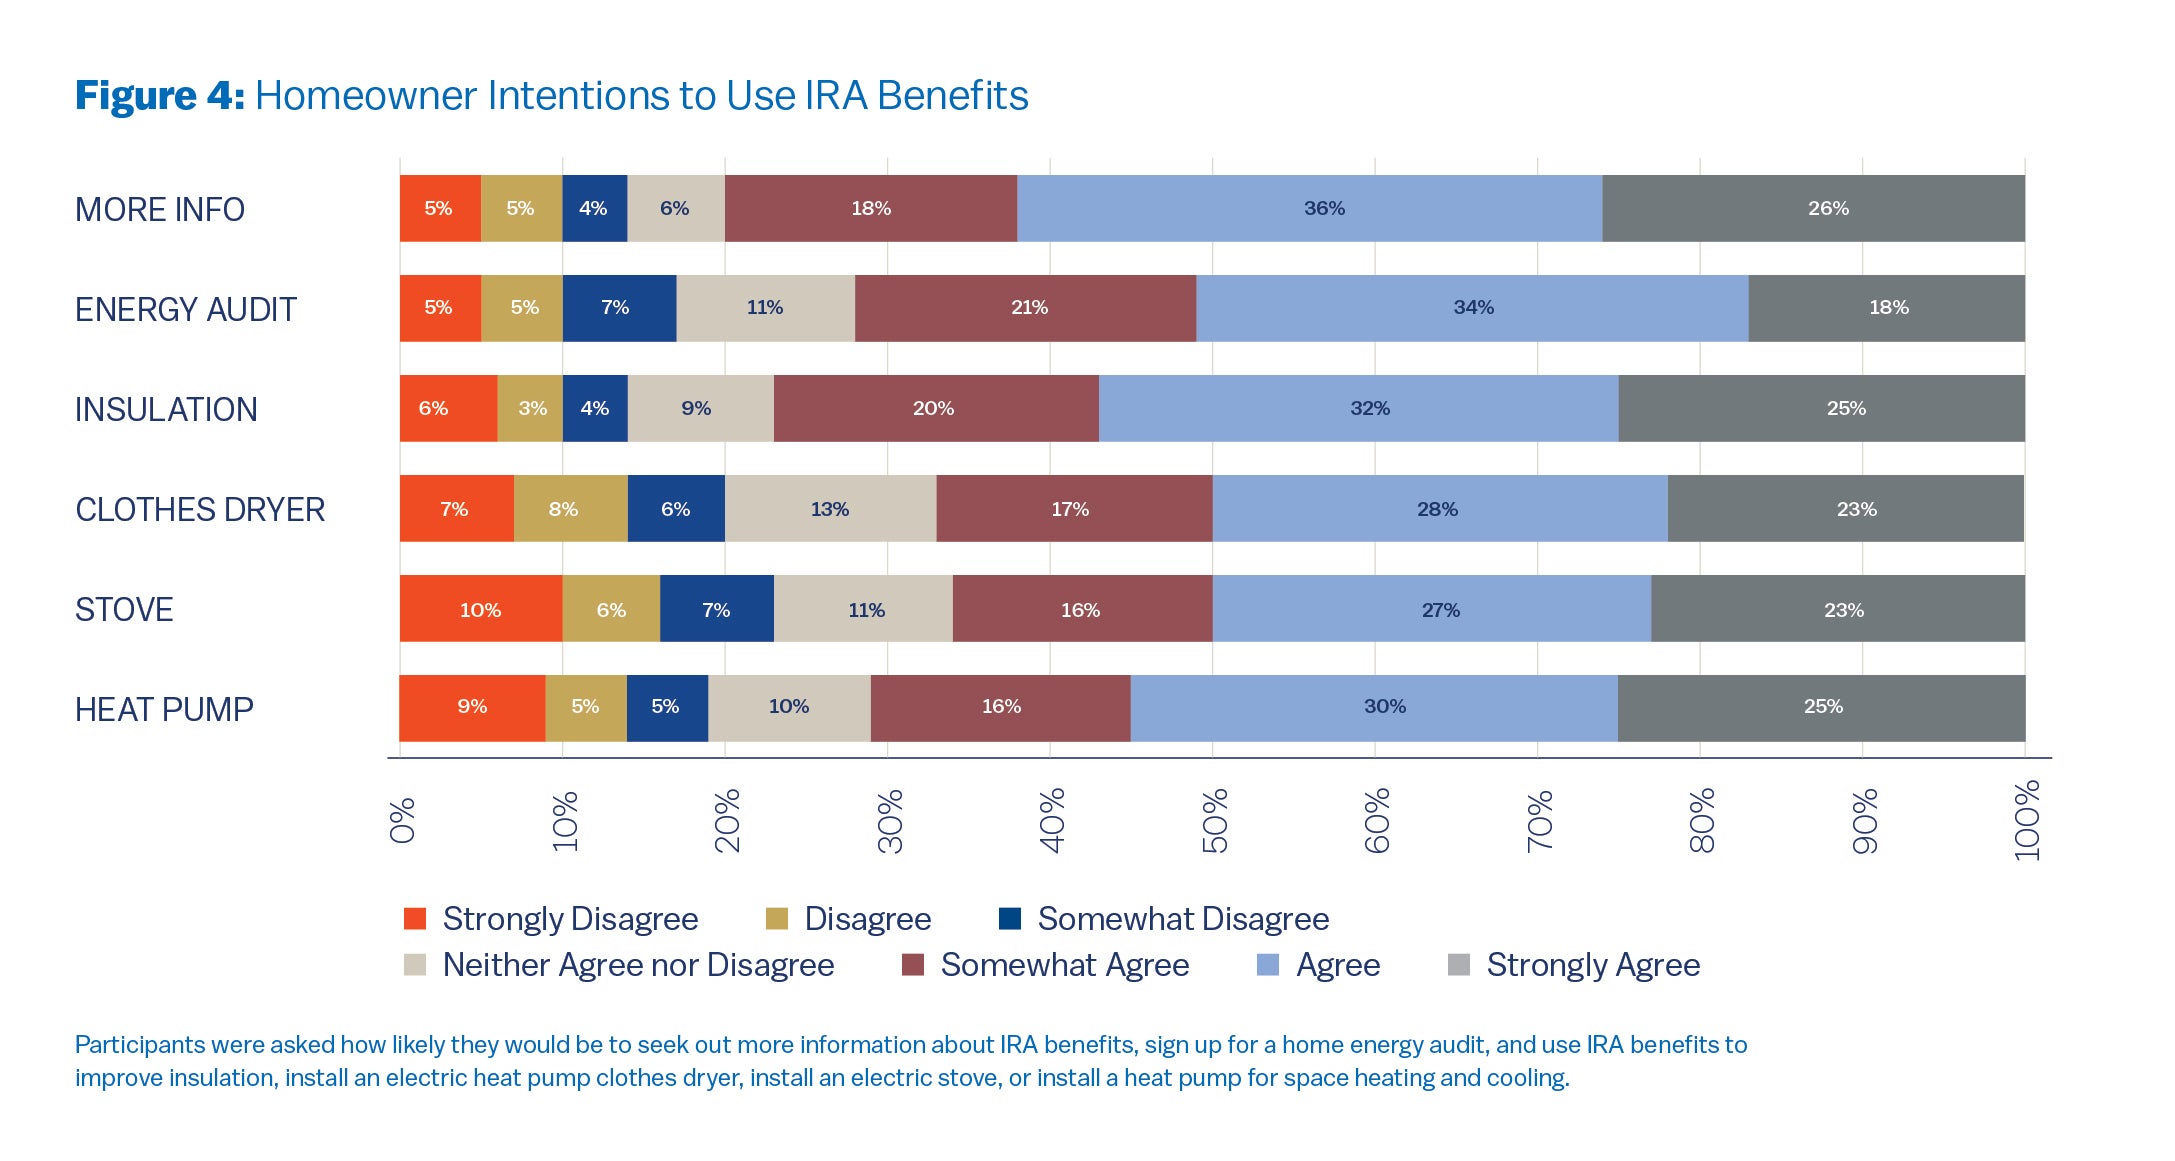
Importantly, regardless of the source conveying the information, both homeowners and renters largely expressed intentions to use (or interest in) the IRA benefits (Figures 4 and 5). No single IRA benefit stood out as exceptionally popular, with all energy efficiency and electrification upgrades receiving fairly high interest. Levels of interest in IRA benefits corresponded well to participants’ needs for home improvements. For example, 64% of homeowners said their home has drafty windows and doors, and 76% said they would be at least somewhat likely to use IRA benefits to weatherize or better insulate their home.
Along with reporting strong interest in the benefits, participants had other favorable opinions of the IRA as well. Of homeowners, 81% at least somewhat agreed that making the home upgrades supported by the IRA would lower their energy bill, and 79% at least somewhat agreed that making the home upgrades would improve the value of their home. Among all participants, 73% at least somewhat agreed that the IRA would benefit their community, and this agreement was high regardless of participants’ income, race, or political ideology.
Taken together, our results show that people may be receptive to learning more about policies like the IRA through coordinated communication efforts, and that multiple sources have the potential to serve as effective avenues for increasing awareness. Our results also support the idea that generating awareness is indeed an important component of expanding public use of IRA-type benefits—when participants were aware of the IRA prior to the start of the survey, they were more trusting of the sources conveying IRA information, and more likely to intend to use or be interested in the benefits, compared to participants who had not heard of the IRA (Appendix Section 4).
Given this, ensuring sources that are best positioned to raise awareness of household energy policies offer clear information about the benefits on their websites or communication materials is an important step when relevant legislation is enacted. For example, if policies like the IRA were to move forward, then since participants responded well to information from PECO, those most familiar with the legislation should collaborate with PECO (or other utilities nationally) to update their website specifically with information about the legislation most relevant to Philadelphians (or other cities).
Low Income Households and Renters
It is important to note that lower income homeowners were less likely to indicate they intended to use the IRA benefits (r = .19), further highlighting the need for policy outreach efforts to intentionally focus on reaching lower income and disadvantaged populations. For example, for low-income households, many of the IRA benefits would cover the total cost of the upgrade, so outreach materials for these groups should make these comprehensive benefits particularly clear.
In addition, a sizable share of renters in our survey (59%) indicated an intention to share information about IRA benefits with their landlords. As would be expected, participants with better relationships with their landlords (α = .80) were more likely to intend to take this action (r = .29). However, the onus should not be on renters to cultivate a positive relationship with their landlord in order to receive these types of benefits. Thus, to more directly address the needs of renters, practitioners should develop strategies for directly connecting landlords with relevant policy information.
Because people with low incomes are often also cost-burdened by rent (i.e, a large share of their income goes toward housing costs) (Pew Charitable Trusts 2020), a renewed focus on renters may further contribute to addressing the energy and housing needs of overburdened populations (previously an aim of the Justice40 Initiative under the Biden administration).
To help low-income homeowners and renters take advantage of these types of benefits, those aiming to increase awareness of relevant policy information should work with local organizations to help connect these underserved communities with this information and advocate for policy changes that would better reflect the needs of these communities.
For example, Philadelphia (like many other cities) has local resources, services, and organizations—including the Philadelphia Energy Authority (PEA), Energy Coordinating Agency (ECA), and the city’s energy office—that may be important to engage with on issues relevant to renters or low-income community members. Communicators, therefore, should explore how these types of local organizations can connect high-need communities directly to benefits or explore ways to incentivize landlords to utilize them.
Climate Connections
This survey did not experimentally test how participants respond to messaging that relates the IRA to climate change. However, to understand if perceptions of climate change relate to likelihood of using the IRA benefits, we asked participants: 1) how personally important climate change is to them, 2) how worried they are about climate change, 3) how aware they are of the climate impacts that the Philadelphia region will face in the coming years, and 4) if they believe the IRA benefits for home updates will help address climate change.
Each of these climate-related beliefs were related to homeowner intentions to use the IRA benefits—such that greater personal importance (r = .40), worry (r = .32), awareness of climate impacts (r = .22), and belief in the IRA helping the climate (α = .84, r = .53) corresponded to increased intentions. Of these climate-related beliefs, how personally important climate change is to participants, and how much they agreed that implementing IRA home benefits helps address climate change, were the most strongly related to homeowner intentions. These two beliefs were similarly important among renters (rimportance = .21, rIRA climate = .35) and their interest in IRA home benefits.
Interestingly, we also found that believing the IRA home benefits will help the climate was just as important as believing that the benefits will improve home values and reduce energy bills, in terms of their ability to predict homeowners’ intentions to use the IRA benefits (Appendix Section 5).
In sum, rather than forewarning of climate impacts, or using messaging meant to foster worry about climate change, focusing on the positive—how policies like the IRA can benefit the climate—may be an effective communication angle, in addition to communication about improved home values and lower energy bills.
Conclusion
Because people may encounter energy policy benefits information from sources like the White House, nonprofits, and local utility companies, we explored whether each of these sources had differing impacts on people’s intentions to use those benefits. Our findings suggest that multiple sources could be effective in conveying information to the public, and that greater awareness of policies like the IRA is positively associated with trust in the sources of the information and intention to use those benefits.
Overall, participants indicated a high level of interest in the benefits and held positive views of how those benefits might impact their energy bill, the value of their home, their community, and the climate. While most IRA benefits have been dismantled by the current administration, these findings bode well for public receptivity to communication efforts surrounding future energy and climate policies.

Lauren Lutzke
Post-Doctoral Research FellowLauren Lutzke is the Kleinman Center for Energy Policy Post-Doctoral Research Fellow at the Penn Center for Science, Sustainability, and the Media.

Eryn Campbell
Former Post-Doctoral Researcher, PCSSM/APPCEryn Campbell is a former post-doctoral researcher at PCSSM/APPC and is currently a research analyst at Action for the Climate Emergency and a visiting scholar at PCSSM. Her research focuses on climate advocacy, media and social influences on climate perceptions, and climate and health disparities.

Heather Kostick
Associate Director, PCSSMHeather Kostick is the associate director at PCSSM. She manages the research and programming at PCSSM to further the mission of communicating climate science to the public and policymakers. Her research interests include climate misinformation and disinformation, urban ecology, and biodiversity.

Julia Pampush
Student Advisory Council MemberJulia Pampush is a recent graduate, majoring in environmental studies and minored in design. She is a student advisory council member. Her research focuses on climate communication strategies, equitable clean energy solutions, and urban resilience.

Michael E. Mann
Presidential Distinguished ProfessorMichael E. Mann is the Presidential Distinguished Professor in the Department of Earth and Environmental Science. He is a faculty fellow with the Kleinman Center and the director of the Penn Center for Science, Sustainability, and the Media (PCSSM).
Section 1
- Awareness of IRA by Income: t = -9.103, df = 897.99, p-value < 2.2e-1
- Awareness of Benefits by Income: t = -8.6501, df = 443.43, p-value < 2.2e-1
- Awareness of IRA by Race: X-squared = 6.3847, df = 1, p-value = 0.0115
- Awareness of Benefits by Race: X-squared = 5.4666, df = 1, p-value = 0.0193
- Awareness of IRA by Homeownership: X-squared = 71.728, df = 1, p-value < 2.2e-1
- Awareness of Benefits by Homeownership: X-squared = 40.449, df = 1, p-value = 2.018e-10
Section 2
![Table titled “Fixed-Effects ANOVA Results Using Homeowner Intentions as the Criterion.”
It displays statistical results with the following columns: Predictor, Sum of Squares, df, Mean Square, F, p, partial η², and partial η² 90% CI [LL, UL].
(Intercept): Sum of Squares = 4404.75, df = 1, Mean Square = 4404.75, F = 2086.45, p = .000
Condition: Sum of Squares = 24.85, df = 3, Mean Square = 8.28, F = 3.92, p = .009, partial η² = .02, 90% CI [.00, .03]
Error: Sum of Squares = 1378.56, df = 653, Mean Square = 2.11
A note below explains that LL and UL represent the lower-limit and upper-limit of the partial η² confidence interval, respectively.](https://kleinmanenergy.upenn.edu/wp-content/uploads/2025/10/KC-Digest-80-Section2-1.jpg)

![Table titled “Fixed-Effects ANOVA Results Using Homeowner Intentions as the Criterion.”
It displays predictors, sum of squares, degrees of freedom (df), mean squares, F values, p values, partial η², and 90% confidence intervals.
(Intercept): Sum of Squares = 228.00, df = 1, Mean Square = 228.00, F = 113.38, p = .000
Condition: Sum of Squares = 10.40, df = 3, Mean Square = 3.47, F = 1.72, p = .161, partial η² = .01, CI [.00, .02]
Ideology: Sum of Squares = 9.91, df = 1, Mean Square = 9.91, F = 4.93, p = .027, partial η² = .01, CI [.00, .02]
Condition × Ideology: Sum of Squares = 4.72, df = 3, Mean Square = 1.57, F = 0.78, p = .504, partial η² = .00, CI [.00, .01]
Error: Sum of Squares = 1305.15, df = 649, Mean Square = 2.01
A note explains that LL and UL represent the lower and upper limits of the partial η² confidence interval, respectively.
The only statistically significant effect (p < .05) is Ideology (p = .027).](https://kleinmanenergy.upenn.edu/wp-content/uploads/2025/10/KC-Digest-80-Section2-3.jpg)
![Table titled “Fixed-Effects ANOVA Results Using Renter Intentions as the Criterion.”
The table presents results for predictors, including sum of squares, degrees of freedom (df), mean square, F statistic, p value, partial η², and 90% confidence intervals.
(Intercept): Sum of Squares = 2365.54, df = 1, Mean Square = 2365.54, F = 1382.20, p = .000
Condition: Sum of Squares = 0.53, df = 3, Mean Square = 0.18, F = 0.10, p = .958, partial η² = .00, CI [.00, 1.00]
Error: Sum of Squares = 729.07, df = 426, Mean Square = 1.71
A note clarifies that LL and UL represent the lower-limit and upper-limit of the partial η² confidence interval, respectively.
No statistically significant effects were found (p > .05).](https://kleinmanenergy.upenn.edu/wp-content/uploads/2025/10/KC-Digest-80-Section2-4.jpg)
![Table titled “Fixed-Effects ANOVA Results Using Trust as the Criterion.”
It presents predictors, sum of squares, degrees of freedom (df), mean square, F statistic, p value, partial η², and 90% confidence intervals.
(Intercept): Sum of Squares = 7195.82, df = 1, Mean Square = 7195.82, F = 5235.88, p = .000
Condition: Sum of Squares = 21.57, df = 3, Mean Square = 7.19, F = 5.23, p = .001, partial η² = .01, CI [.00, .03]
Homeowner: Sum of Squares = 43.89, df = 1, Mean Square = 43.89, F = 31.94, p = .000, partial η² = .03, CI [.01, .05]
Error: Sum of Squares = 1485.65, df = 1081, Mean Square = 1.37
A note explains that LL and UL represent the lower-limit and upper-limit of the partial η² confidence interval, respectively.
Both Condition (p = .001) and Homeowner (p = .000) effects are statistically significant.](https://kleinmanenergy.upenn.edu/wp-content/uploads/2025/10/KC-Digest-80-Section2-5.jpg)

Section 3
![Table titled “Fixed-Effects ANOVA Results Using Homeowner Intentions as the Criterion.”
The table lists predictors with values for sum of squares, degrees of freedom (df), mean square, F statistic, p value, partial η², and 90% confidence intervals.
(Intercept): Sum of Squares = 370.35, df = 1, Mean Square = 370.35, F = 181.36, p = .000
Condition: Sum of Squares = 3.18, df = 3, Mean Square = 1.06, F = 0.52, p = .669, partial η² = .00, CI [.00, .01]
Income: Sum of Squares = 13.99, df = 1, Mean Square = 13.99, F = 6.85, p = .009, partial η² = .01, CI [.00, .03]
Condition × Income: Sum of Squares = 0.22, df = 3, Mean Square = 0.07, F = 0.04, p = .991, partial η² = .00, CI [.00, 1.00]
Error: Sum of Squares = 1325.30, df = 649, Mean Square = 2.04
A note explains that LL and UL represent the lower-limit and upper-limit of the partial η² confidence interval, respectively.
Only Income (p = .009) shows a statistically significant effect.](https://kleinmanenergy.upenn.edu/wp-content/uploads/2025/10/KC-Digest-80-Section3-1.jpg)
![Table titled “Fixed-Effects ANOVA Results Using Homeowner Intentions as the Criterion.”
It summarizes statistical results for predictors, including condition, race (White, Non-Hispanic), and their interaction. Columns show sum of squares, degrees of freedom (df), mean square, F statistic, p value, partial η², and 90% confidence intervals.
(Intercept): Sum of Squares = 2322.40, df = 1, Mean Square = 2322.40, F = 1124.78, p = .000
Condition: Sum of Squares = 3.75, df = 3, Mean Square = 1.25, F = 0.61, p = .612, partial η² = .00, CI [.00, .01]
White, Non-Hispanic: Sum of Squares = 4.78, df = 1, Mean Square = 4.78, F = 2.32, p = .129, partial η² = .00, CI [.00, .02]
Condition × White, Non-Hispanic: Sum of Squares = 8.35, df = 3, Mean Square = 2.78, F = 1.35, p = .258, partial η² = .01, CI [.00, .02]
Error: Sum of Squares = 1340.02, df = 649, Mean Square = 2.06
A note at the bottom states that LL and UL represent the lower-limit and upper-limit of the partial η² confidence interval, respectively.
No predictors show statistically significant effects (all p > .05).](https://kleinmanenergy.upenn.edu/wp-content/uploads/2025/10/KC-Digest-80-Section3-2.jpg)
![Table titled “Fixed-Effects ANOVA Results Using Renter Interest as the Criterion.”
It shows predictors, sum of squares, degrees of freedom (df), mean square, F statistic, p value, partial η², and 90% confidence intervals.
(Intercept): Sum of Squares = 662.08, df = 1, Mean Square = 662.08, F = 406.94, p = .000
Condition: Sum of Squares = 8.39, df = 3, Mean Square = 2.80, F = 1.72, p = .162, partial η² = .01, CI [.00, .03]
Income: Sum of Squares = 2.92, df = 1, Mean Square = 2.92, F = 1.80, p = .181, partial η² = .00, CI [.00, .02]
Condition × Income: Sum of Squares = 11.10, df = 3, Mean Square = 3.70, F = 2.27, p = .079, partial η² = .02, CI [.00, .04]
Error: Sum of Squares = 686.57, df = 422, Mean Square = 1.63
A note below the table explains that LL and UL represent the lower-limit and upper-limit of the partial η² confidence interval, respectively.
None of the predictors show statistically significant results (p > .05).](https://kleinmanenergy.upenn.edu/wp-content/uploads/2025/10/KC-Digest-80-Section3-3.jpg)
![Table titled “Fixed-Effects ANOVA Results Using Renter Interest as the Criterion.”
It reports the results for predictors, including condition, race (White, Non-Hispanic), and their interaction. Columns display sum of squares, degrees of freedom (df), mean square, F statistic, p value, partial η², and 90% confidence intervals.
(Intercept): Sum of Squares = 2142.96, df = 1, Mean Square = 2142.96, F = 1242.76, p = .000
Condition: Sum of Squares = 0.77, df = 3, Mean Square = 0.26, F = 0.15, p = .931, partial η² = .00, CI [.00, .00]
White, Non-Hispanic: Sum of Squares = 0.43, df = 1, Mean Square = 0.43, F = 0.25, p = .618, partial η² = .00, CI [.00, .01]
Condition × White, Non-Hispanic: Sum of Squares = 1.03, df = 3, Mean Square = 0.34, F = 0.20, p = .896, partial η² = .00, CI [.00, .00]
Error: Sum of Squares = 727.68, df = 422, Mean Square = 1.72
A note clarifies that LL and UL represent the lower-limit and upper-limit of the partial η² confidence interval, respectively.
No predictors are statistically significant (all p > .05).](https://kleinmanenergy.upenn.edu/wp-content/uploads/2025/10/KC-Digest-80-Section3-4.jpg)
Section 4
- Awareness of IRA by Trust: t = -6.786, df = 849.85, p-value = 2.162e-11
- Awareness of Benefits by Trust: t = -8.0656, df = 411.57, p-value = 8.044e-15
- Awareness of IRA by Homeowner Intentions: t = -4.9077, df = 301.02, p-value = 1.513e-06
- Awareness of Benefits by Homeowner Intentions: t = -6.0308, df = 146.13, p-value = 1.275e-08
- Awareness of IRA by Renters Interest: t = -3.029, df = 420.53, p-value = 0.002605
- Awareness of Benefits by Renters Interest: t = -3.7463, df = 275.82, p-value = 0.0002185
Section 5
![Table titled “Regression Results Using Homeowners Intentions as the Criterion.”
It summarizes multiple regression results showing predictors, coefficients (b), confidence intervals, standardized beta weights, semi-partial correlations (sr²), and correlations (r).
Predictors and Results:
(Intercept): b = 0.50*, 95% CI [0.06, 0.95]
Home Value: b = 0.29**, 95% CI [0.20, 0.38]; β = 0.26, 95% CI [0.18, 0.34]; sr² = .04, 95% CI [.02, .06]; r = .53**
Reduce Bill: b = 0.25**, 95% CI [0.17, 0.34]; β = 0.23, 95% CI [0.15, 0.31]; sr² = .03, 95% CI [.01, .05]; r = .53**
IRA Climate: b = 0.30**, 95% CI [0.22, 0.39]; β = 0.26, 95% CI [0.19, 0.34]; sr² = .04, 95% CI [.02, .07]; r = .53**
Model summary: R² = .401, 95% CI [.34, .45].
A note states that a significant b-weight indicates that both the beta-weight and semi-partial correlation are significant.
Asterisks denote significance: *p < .05, **p < .01.](https://kleinmanenergy.upenn.edu/wp-content/uploads/2025/10/KC-Digest-80-Section5-1.jpg)
American Council for an Energy-Efficient Economy. 2019. “50-State Scorecard Reveals States are
Ramping Up Clean Energy.” Accessed April 24, 2025. https://www.aceee.org/press/2019/10/50-state-scorecard-reveals-states
Benson, Craig. 2023. “Poverty in States and Metropolitan Areas: 2022.” American Community
Survey Briefs, ACSBR-016.
Clark, Chelsea, John Bergdoll, Andrea Pactor, and Una O. Osili. 2023. “What Americans Think About
Philanthropy and Nonprofits.” Indiana University Lilly Family School of Philanthropy.
Council on Environmental Quality. n.d. “Climate and Economic Justice Screening Tool.” Climate
and Economic Justice Screening Tool. Accessed October 21, 2024. https://screeningtool.geoplatform.gov.
Gaur, Ankita Singh, Desta Z. Fitiwi, and John Curtis. 2021. “Heat Pumps and Our Low-Carbon
Future: A Comprehensive Review.” Energy Research & Social Science 71, (January):101764. https://doi.org/10.1016/j.erss.2020.101764.
Glavan, Nikola. 2021. “Understanding the Impact of Consumer Awareness of Utility Regulatory
Framework on Energy.” Harvard University ProQuest Dissertations and Theses, 2021. 28647781. https://www.proquest.com/docview/2571088190?pq-origsite=gscholar&fromopenview=true&sourcetype=Dissertations%20&%20Theses
Goldstein, Benjamin, Dimitrios Gounaridis, and Joshua P. Newell. 2020. “The Carbon
Footprint of Household Energy Use in the United States.” Proceedings of the National Academy of Sciences 117, (32): 19122–30. https://doi.org/10.1073/pnas.1922205117.
Kramer, Anna. 2018. “Old Homes, High Poverty Make Philadelphia Housing Less than Affordable for
Some.” WHYY. Accessed October 28, 2024. https://whyy.org/articles/old-homes-high-poverty-make-philadelphia-housing-less-than-affordable-for-some/.
Leiserowitz, Anthony, Edward W. Maibach, Seth Rosenthal, John Kotcher, Emily Goddard, Jennifer
Carman, Marija Verner, Matthew Ballew, Jennifer Marlon, Sanguk Lee, Teresa Myers, Matthew Goldberg, Nicholas Badullovich, and Kathryn Thier. 2023. “Climate Change in the American Mind: Politics & Policy.” Yale University and George Mason University. New Haven, CT: Yale Program on Climate Change Communication. Accessed October 21, 2024. https://climatecommunication.yale.edu/wp-content/uploads/2023/11/climate-change-american-mind-politics-policy-fall-2023.pdf
Maibach, Edward W., Sri Saahitya Uppalapati, Margaret Orr, and Jagadish Thaker. 2023.
“Harnessing the Power of Communication and Behavior Science to Enhance Society’s Response to Climate Change.” Annual Review of Earth and Planetary Sciences 51, (Volume 51, 2023): 53–77. https://doi.org/10.1146/annurev-earth-031621-114417.
Pew Charitable Trusts. 2024. “Philadelphia 2024: The State of the City.” Accessed October 21, 2024. https://www.pewtrusts.org/-/media/assets/2024/04/philadelphia-2024.pdf
Pew Charitable Trusts. 2020. “The State of Housing Affordability in Philadelphia”. Accessed October
21, 2024. https://www.pewtrusts.org/-/media/assets/2020/09/phillyhousingreport.pdf
Ramirez, Alyssa, Margaret Oloriz, and Uroš Simović. 2023. “Inflation Reduction Act Incentivizes
Utilities to Use Digital Tools for Participation in Energy Efficiency Programs.” Climate and Energy 39, (11): 1–8. https://doi.org/10.1002/gas.22347.
The White House. 2023a. “Inflation Reduction Act Guidebook | Clean Energy.”
Accessed original version October 21, 2024. Website archived February 2025. Archived version accessed April 24, 2025. https://bidenwhitehouse.archives.gov/cleanenergy/inflation-reduction-act-guidebook/.
The White House. 2023b. “Justice40 Initiative | Environmental Justice.” 2023. The White House.
Accessed original version October 21, 2024. Website archived February 2025. Archive version accessed April 24, 2025. https://bidenwhitehouse.archives.gov/environmentaljustice/justice40/.
Uplight. 2021. “Bridging the Gap: Keeping Up with Modern Customer Expectations.” https://uplight.com/resources/bridging-the-gap-keeping-up-with-modern-customer-expectations/
U.S. Census Bureau. n.d. “Philadelphia City, Pennsylvania – Census Bureau Profile.” Accessed
October 28, 2024. https://data.census.gov/profile/Philadelphia_city,_Pennsylvania?g=160XX00US4260000.
- cleanenergy.gov was archived following the change in administrations: https://web.archive.org/web/20250117224151/https://www.whitehouse.gov/cleanenergy/?utm_source=www.cleanenergy.gov [↩]
- rewiringamerica.org [↩]
- peco.com/ways-to-save/for-your-home [↩]
- This is high compared to a 2023 nationally representative survey from Yale and George Mason University that found 58% of registered US voters had heard at least “a little” about the IRA (Leiserowitz et al. 2023). Discrepancies in IRA awareness between the surveys may be due to our sample including a large number of liberals and the time of data collection (a year later than the Yale/Mason survey and during a Presidential election cycle). [↩]
