Black Market Crude: Organized Crime and Environmental Externalities in Nigeria’s Oil Sector

In oil-dependent Nigeria, the oil industry has been plagued with instability, organized crime, and illegal black markets. But have efforts to demobilize militant fighters affected oil and gas infrastructure attacks and oil-related criminal violence?
Introduction
Violent conflict in poor countries is often intertwined with natural resources (Dube and Vargas 2013, Berman et al. 2017), an important manifestation of the general political economy phenomenon known as the resource curse (Ross 2004). Rebels use natural resources to finance civil war, rising commodity prices may increase the incentive to capture the state in resource-rich nations, and unequal distribution of rents, or excessive rent-seeking by predatory governments, can generate grievance-driven insurgency.
In conflicts from Iraq to Democratic Republic of Congo, illegal black markets often emerge around the extraction, processing, and sale of natural resources. Yet little is known about how these markets operate during and after war, or the environmental costs they impose on host communities. In many internal conflicts, Disarmament, Demobilization, and Reintegration (DDR) are common feature of conflict resolution efforts. These programs typically aim to disarm fighters, demobilize rebel groups, and reintegrate ex-combatants into communities or the national armed forces through some combination of amnesty, cash grants, education, and other economic, social, and psychological support services. Such well-intentioned peace deals that seek to put an end to violence may generate perverse incentives, affecting black markets—and the environment —in unforeseen ways.
In an ongoing research project, I study the dynamics of organized crime and environmental damage in the context of Nigeria’s oil industry. Nigeria is a heavily oil-dependent country. It boasts the world’s 10th largest proven oil reserves (EIA 2017) and relies on oil for 95% of export earnings (World Bank 2017). But the sector has long been plagued by instability. From at least 2003 to the present, an array of militant groups, armed gangs, and ethnic militias have waged war against the Nigerian state, oil companies, and each other for control of the country’s roughly 300 oil fields, leaving the Niger Delta—Nigeria’s oil-rich southern region—in a state of low-grade anarchy.
Nigeria’s unsecured 5,000-kilometer pipeline network has remained vulnerable to vandalism and theft, in which crude oil is illegally tapped in a process colloquially known as “bunkering.” This theft fuels a thriving black market for stolen crude—including a downstream sector of local refineries—valued in 2011 at $4.4 billion annually in lost revenue for the Nigerian government and oil companies (NEITI 2011).
The black market is linked to militant groups—who often control pipelines in their areas of influence—criminal syndicates, and the arms trade (Hazen and Horner 2007, ICG 2015). These activities are associated with substantial environmental costs: sabotage accounted for 77% of the 2,057 oil spills experienced from 2015 to 2017.
In an effort to stem the flow of illegal crude, boost flagging oil production, and reduce violence in the region, in 2009 President Umaru Yar’Adua offered amnesty and cash grants to all militants willing to lay down arms and peacefully reintegrate into society. The program successfully demobilized roughly 20,000 militant fighters (Apikins-Maina 2015), disbanded numerous rebel camps, and is widely believed to have quelled the most visible aspects of armed uprising.
This study offers the first quantitative assessment of the effects of this policy on key outcomes of interest: large-scale attacks on oil and gas infrastructure, oil-related criminal violence, illegal theft of oil from pipelines, oil production volumes, and environmental pollution.
Data Sources
To understand the impacts of amnesty, I compiled data from several administrative sources. Estimating the effect of the amnesty requires detailed information on the municipalities likely to be affected by the policy. Areas controlled by militant groups, and in particular groups that took up the amnesty, form the “treatment” group. To identify these municipalities, I collected data on the location of militant group headquarters (camps) by consulting local Nigerian NGOs and researchers. This data collection procedure yielded the precise location and amnesty status of 35 militant camps led by 28 militant commanders. While location and amnesty status of these camps is clearly non-random, I explain below that the data support drawing causal inferences once fixed differences across municipalities and general time trends are accounted for.

Data on high-profile attacks on the oil sector perpetrated by militants from 1997-2017 comes from the Armed Conflict Location Event Dataset (ACLED). This primarily consists of bombings of major oil infrastructure, kidnappings and killings of oil workers, and battles against the Nigerian Navy, the military agency tasked with fighting militancy and theft in the coastal waterways of the Niger Delta. Additional data on oil-related violent criminal activity comes from Nigeria Watch, a local non-profit organization that collects crime data from local Nigerian newspapers. This data captures events that are likely to be unmeasured in ACLED, including internecine violence perpetrated by the local armed gangs and ethnic militias intimately involved in oil-related crime and often explicitly allied with political militant groups.
Information on the time, location, and details of roughly 11,000 oil spills comes from the administrative records of the National Oil Spill Detection and Response Agency (NOSDRA) at the Federal Ministry of the Environment. The causes of oil spills are recorded as either sabotage or equipment failure. Since pipeline sabotage often (though not always) signifies black market activity, this serves as a reliable proxy for oil theft. Lastly, data on environmental quality—including hydrocarbon content of soil and water—comes from Environmental Impact Assessment reports submitted by oil companies to the Nigerian government.
Additional data on the oil sector, including production levels and infrastructure locations, was provided by government regulatory agencies. Figure 1 maps the oil infrastructure and landscape of militant activity in the Niger Delta, indicating the location of the region within West Africa; the map scale is in kilometers.
The Impact of Amnesty
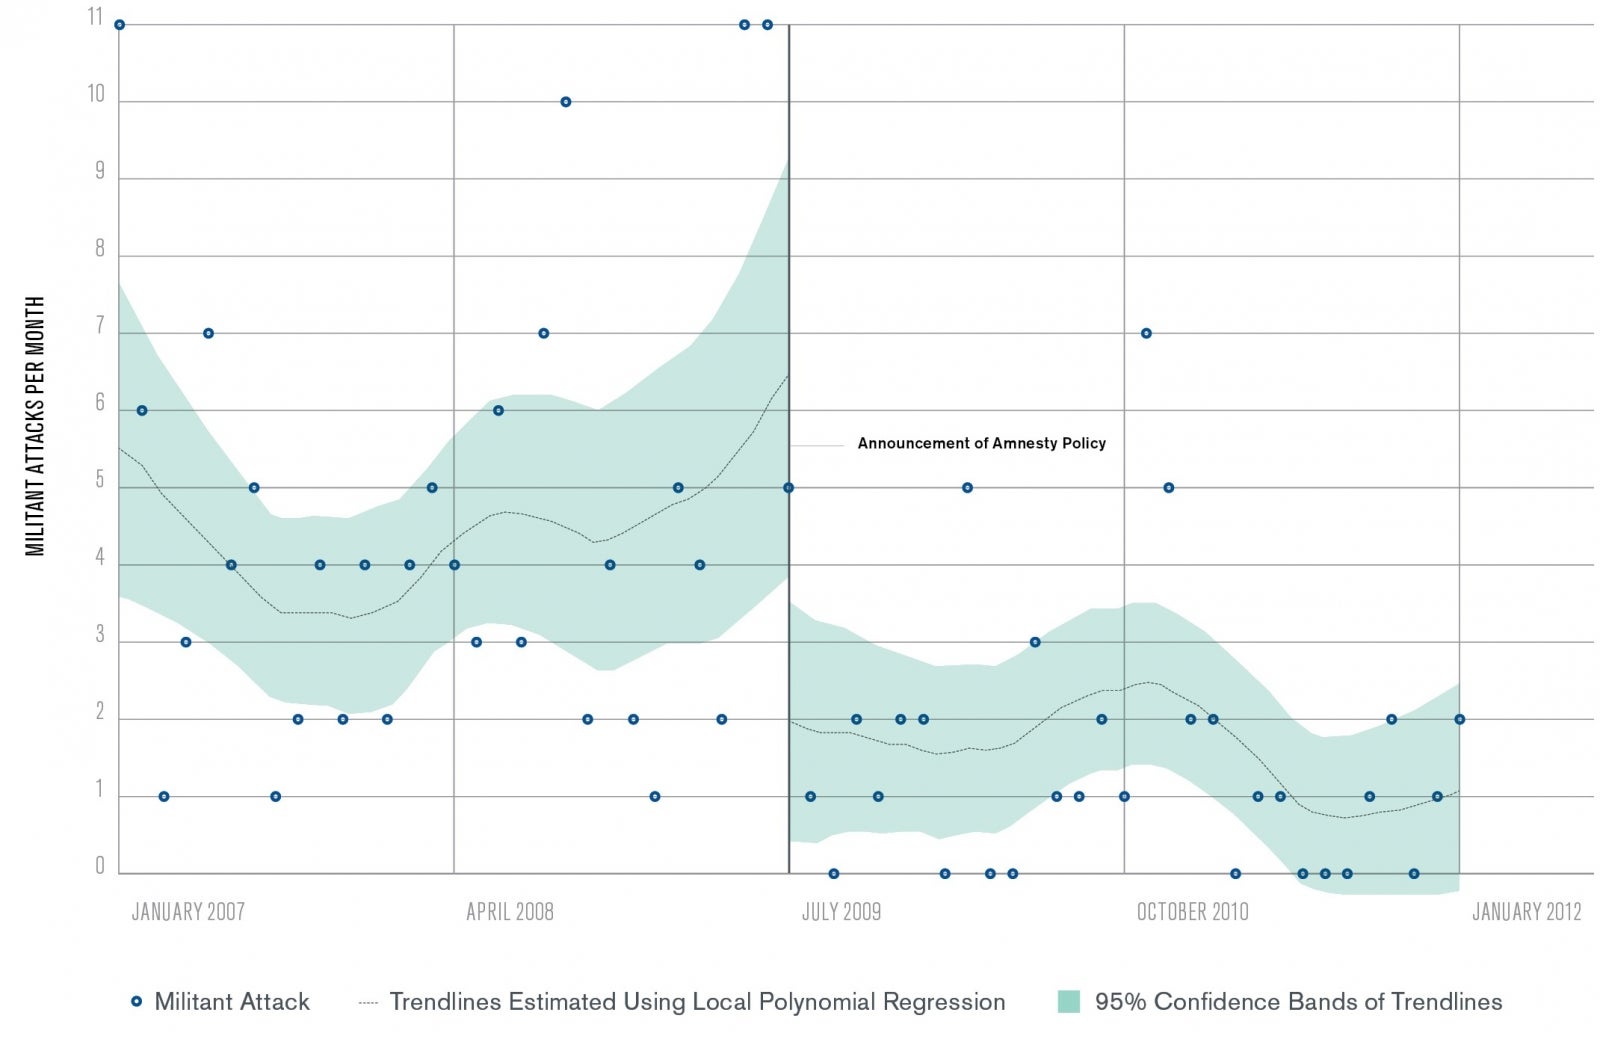
The primary goal of the amnesty policy was to boost oil production by curtailing high-profile militant attacks on the oil and gas sector, primarily bombings of oil facilities, sabotage of infrastructure, and kidnapping of oil workers. Simple descriptive analysis suggests that the amnesty was successful in this goal. According to ACLED data, average monthly militant attacks fall from 4.6 per month in the 30 months preceding the amnesty to 1.5 in the 30 months after. In addition, each of the 30 months prior to the amnesty witnessed an attack, while in the post-amnesty period 9 out of 30 months saw no attacks at all.
Figure 2 demonstrates the sharp drop in attacks just around the amnesty date. Here, I plot the number of militant attacks per month from January 2007 to January 2012 – a symmetric 30-month “window” around the event – with a vertical line indicating July 2009, the month of announcement of the amnesty policy. Nonparametric trendlines are plotted with 95% confidence intervals before and after the date to model the pre and post-amnesty trend in attacks. The results confirm the simple descriptive analysis: that the amnesty appears to be responsible for a structural break in the number of attacks per month.

I formalize this analysis using an event-study framework (Davis 2008, referred to by Hausman and Rapson (2018) as a regression discontinuity in time). The regression analysis allows me to accommodate numerous modeling assumptions about pre and post-amnesty trends, persistence in the time series, month and year effects, as well as varying windows around the event. Across several empirical specifications, I estimate that the amnesty reduced militant activity by approximately four to five attacks per month in the short run.
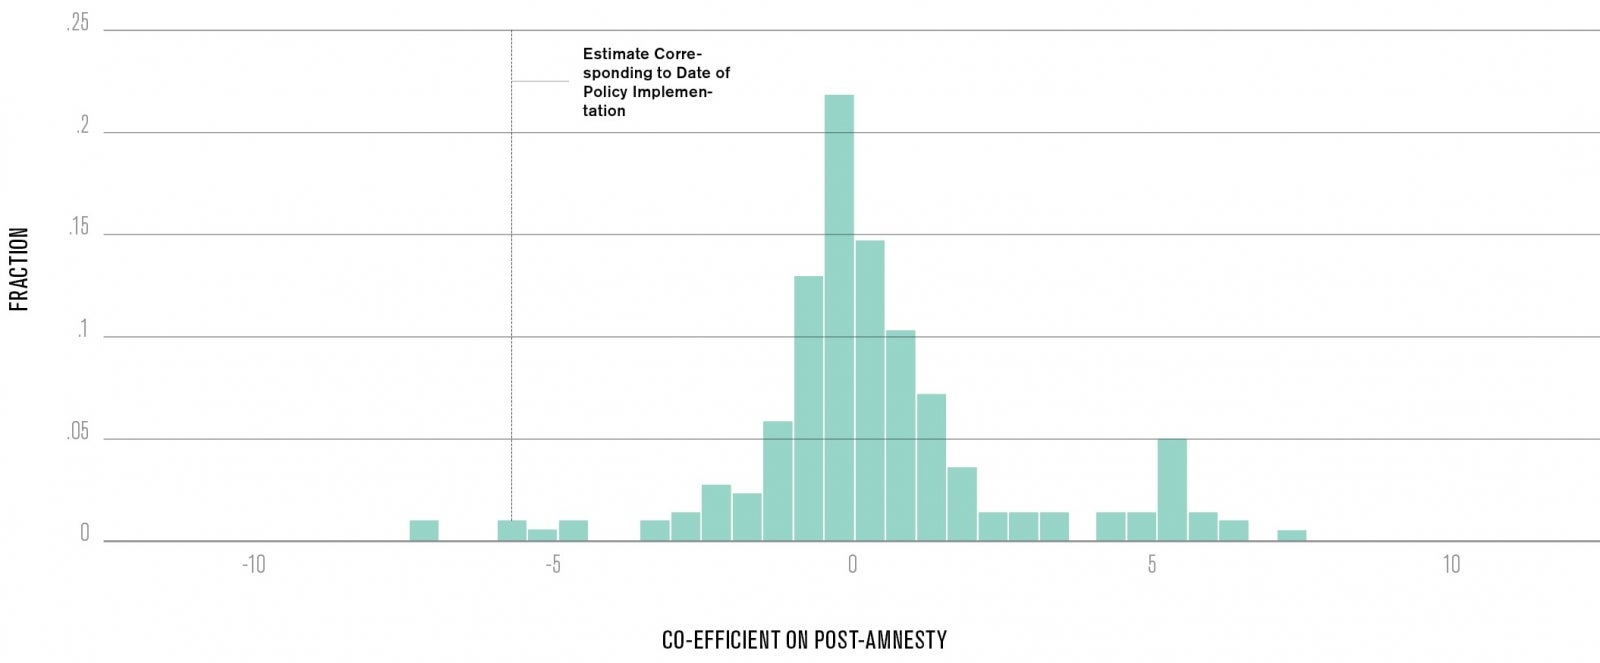
To test whether this estimate simply captures random month-to-month fluctuations in violence, I consider whether the results can be replicated with other placebo event dates. I re-estimate the event-study for 225 possible placebo dates from July 1997 to April 2016 and compare the main estimate to this distribution of estimates from each possible date. I plot the results in Figure 3, which gives a histogram of these placebo effects, as well as a dotted line indicating the estimate corresponding to the true date of policy implementation. As desired, the true effect is in the far left tail of the simulated distribution of placebo effects. This suggests that it is extremely unlikely for an effect of this magnitude to be generated regular fluctuations in violence.

Next, I estimate the effect of the amnesty on oil bunkering using a differences-in-differences approach that exploits the localized nature of oil bunkering. To generate income to finance the purchase of arms and recruitment of “boys” (the colloquial term for recruits), militants typically bunker pipelines primarily in areas under their immediate control.
Therefore, areas controlled by militants who took up amnesty should be more affected by the amnesty. Using newly collected data on the location and amnesty participation of militant camps to identify variation across municipalities in exposure to the policy, I find that municipalities within 50 kilometers of an amnestied militant camp experience substantially more bunkering events than areas outside of this radius as a result of amnesty. This counterintuitive result suggests that, despite its success in winding down the conflict, the amnesty policy generated negative unintended consequences. In the subsequent section, I offer several economic mechanisms that might explain this finding.
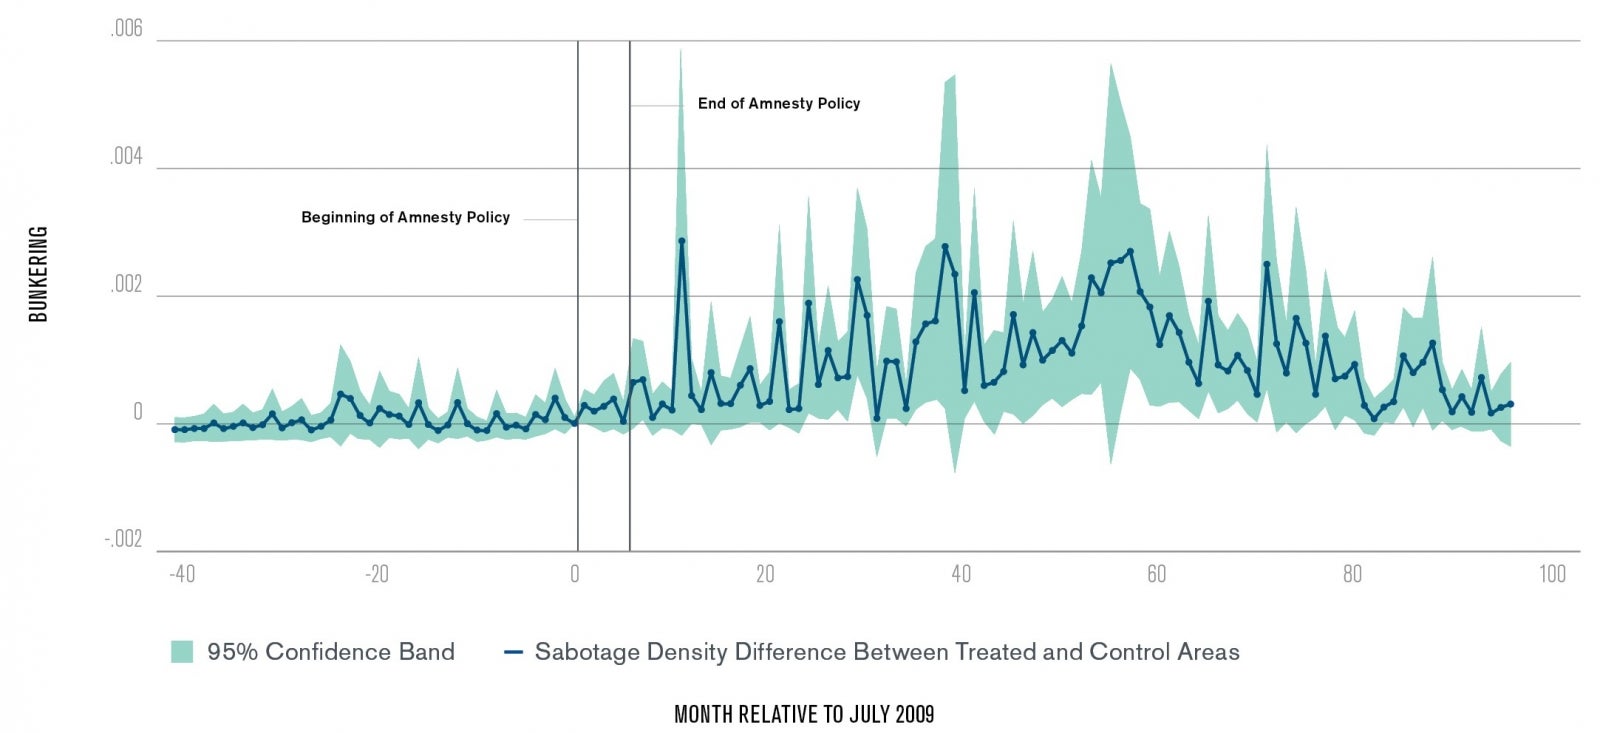
To visualize the effect of amnesty on bunkering rates, I plot the average monthly difference in the bunkering rate —normalized relative to July 2009—between amnestied and non-amnestied municipalities in Figure 4. I measure the bunkering rate as the number of pipeline vandalism incidents divided by the physical area of the municipality, that is, incidents per square kilometer.

Prior to the amnesty policy, there is essentially no difference between the two groups. After the amnesty, however, a large gap opens up as bunkering in formerly militant-controlled territories that accepted the policy surges, persisting for nearly nine years. At its height in 2013-14 the monthly effect represents more than a 1 standard deviation increase in bunkering in areas affected by the amnesty.
The assignment of amnesty status across municipalities is clearly non-random. Firstly, militants tend to locate in areas that are oil rich, coastal, riverine, and remote. Secondly, militants who accept amnesty may be different than those who do not; they may be losing the war of attrition, while those who hold out have better prospects.
Figure 4 suggests that these differences are unlikely to be driving the results, since amnestied areas exhibit similar bunkering trends to control areas prior to the amnesty. More detailed econometric analysis also demonstrates that controlling for the intensity of oil production and pipeline infrastructure, population density, river network, ethnic diversity, and distance to coast does not affect the results, nor does accounting for potentially correlated measurement error in the outcome. Finally, 2009 also saw historic drops in oil prices, which might differentially affect bunkering in amnestied areas; accounting for oil prices does not affect the main results.
A final piece of evidence suggests that this increase in sabotage of oil infrastructure is driven by the economic incentives generated by amnesty. I disaggregate vandalism across different types of infrastructure, including trunklines, flow lines, delivery lines, and wellheads. I find that nearly the entire observed increase in vandalism observed in Figure 4 is explained by incidents on trunklines. Because of their width, trunklines—which funnel large volumes of crude from intermediate inland flow stations to coastal export terminals—are by far the most economically valuable oil assets to bunkerers. In contrast, smaller flow and delivery lines require similar tapping techniques but yield less crude, while wellheads are of little value for criminals. These results suggest that organized criminal bunkering motivated by profit maximization—rather than unorganized acts of sabotage stemming from community discontent or attempts to gain compensation—is driving the observed effect.
Why Did the Amnesty Increase Oil Bunkering?
The amnesty was highly effective at its primary goal: reducing direct attacks on the oil industry. However, one unintended consequences appears to be that the amnesty program caused substantial growth in the illegal oil sector.
Three economic mechanisms could explain this phenomenon. First, changes in the competitive structure of the black market may have driven the increase in bunkering. If militant groups behave as local monopolists in their areas of control, then they should internalize the externalities that bunkering imposes both on oil company production decisions and on the local environment.
In particular, monopolist militants may take care not to kill the golden goose of oil production with too many pipeline attacks. They may even partially internalize the negative environmental effects of their activity given the need to win support from local villagers. If the amnesty policy effectively broke—or at least weakened—these monopolies, encouraging the entry of smaller groups, then in the new more competitive equilibrium the level of bunkering should rise. In other words, the demilitarization of the region created a governance void, which, unfilled by the Nigerian state, led to a tragedy of the commons.
Second, amnesty may have represented the outcome of a dynamic bargain between militants and government (as in Fearon 2013). Militants use acts of violence that reduce oil production—and thus government revenue—in the short-run to extract government concessions in the form of an amnesty that allows them to “tax” pipelines via bunkering. Since bunkering allows oil production to continue, albeit reduced, while large-scale violence can effectively shut it down, this arrangement may be second-best for governments if they believe militant threats are credible. Militant violence and criminal bunkering thus become substitute strategies: the rebel group uses more violence today, thus forgoing some current bunkering income, in order to bring government to the table, increasing opportunities for theft tomorrow. This pattern is indeed consistent with the fall in violence and rise in bunkering following the amnesty. However, in this case, the latter is not an unintended consequence, but rather by design.
Lastly, it is possible that the rise in bunkering was neither a shift in competitive conduct, nor a bargaining solution, but rather a liquidity effect. The amnesty entailed large transfers to militant leaders in the form of both waterway security contracts and misappropriation of funds using “ghost” fighters (i.e., extracting rents by inflating the number of militants). Both of these practices were reported extensively in the Nigerian press. Thus, militant commanders stood to benefit from a large windfall at the time of amnesty, which they may have reinvested in increased criminal activity. In future work, I hope to collect additional data to distinguish between these hypotheses.
Welfare Effects
In future research, I hope to more comprehensively assess the welfare consequences of the amnesty policy, as the social costs may be substantial. In particular, if the amnesty increased bunkering, it is likely that it also contributed to the significant environmental damage faced by the region in the past decade. Using newly digitized administrative data on biodiversity, and soil, water, and air quality, I plan to estimate the environmental costs of the amnesty policy.
Beyond the inherent value of environmental assets destroyed by oil pollution, environmental pollution may generate negative spillovers on labor productivity, human capital accumulation, and a variety of economic activities. For example, Bruderle and Hodler (2017) show that oil pollution in Nigeria is associated with greater infant mortality.
Finally, increased bunkering represents foregone government revenue, the opportunity costs of which can be considerably larger in a poor country where the returns to public investment are high. Still, the reduction in overt violence represents a real social benefit, with the potential for positive local economic spillovers. To fully understand the welfare consequences of the amnesty, relative to its substantial fiscal cost, it is necessary to further disentangle these effects, as well as establish a valuation of the relevant positive and negative externalities.
Even without a thorough accounting of the welfare consequences, the preliminary results urge caution. DDR programs such as the Niger Delta Amnesty are a common feature of post-conflict reconstruction efforts, and frequently included on the menu of best practices supported by international donors. The Nigerian experience suggests that such programs may generate perverse incentives if the market structure and political economy of illegal activities underlying the conflict are ignored. In particular, without complementary investments in local governance and law enforcement to fill the void left by departing militant groups, the social and environmental costs generated by resurgent black markets may offset, or at the very least modulate, the dividends of peace.
Jonah Rexer
Doctoral StudentJonah Rexer is a Ph.D. student in the Wharton School at the University of Pennsylvania.
Apikins-Mainia, W. (2015). The State and Conflict Management in Nigeria: An Examination of the Amnesty Program for Militants in the Niger Delta. PhD. Ahmadu Bello University.
Berman, N., Couttenier, M., Rohner, D. and Thoenig, M. (2017). This Mine is Mine! How Minerals Fuel Conflicts in Africa. American Economic Review, 107(6), pp.1564-1610.
Data.worldbank.org. (2019). World Bank Databank. [online] Available at: https://data.worldbank.org/indicator/TX.VAL.FUEL.ZS.UN?locations=NG&view… [Accessed 1 Feb. 2019].
Davis, L. (2008). The Effect of Driving Restrictions on Air Quality in Mexico City. Journal of Political Economy, 116(1), pp.38-81.
Dube, O. and Vargas, J. (2013). Commodity Price Shocks and Civil Conflict: Evidence from Colombia. The Review of Economic Studies, 80(4), pp.1384-1421.
Eia.gov. (2019). International Energy Statistics. [online] Available at: https://www.eia.gov/beta/international/rankings/#?iso=NGA&cy=2017&aid=6&… [Accessed 1 Feb. 2019].
Fearon, J. (2013). Fighting rather than bargaining. Working Paper.
Hausman, C. and Rapson, D. (2018). Regression Discontinuity in Time: Considerations for Empirical Applications. Annual Review of Resource Economics, 10(1), pp.533-552.
Hodler, R. and Bruederle, A. (2017). The effect of oil spills on infant mortality: Evidence from Nigeria. Oxford Centre for the Analysis of Resource Rich Economies Working Paper 196.
International Crisis Group (2015). Curbing Violence in Nigeria: Revisiting the Niger Delta. Africa Report No. 231. Brussels: International Crisis Group.
Nigeria Extractive Industries Transparency Initiative (2011). 2009-2011 Oil and Gas Industry Audit Report. NEITI Audit Reports. Abuja.
Ross, M. (2004). What Do We Know about Natural Resources and Civil War? Journal of Peace Research, 41(3), pp.337-356.
Small Arms Survey (2019). Small Arms, Armed Violence, and Insecurity in Nigeria: The Niger Delta in Perspective. Small Arms Survey Occasional Paper. Geneva: Small Arms Survey.

