
Federal policy shifts, including the rollback of the Investment Tax Credit and cancellation of the Solar for All program, threaten progress in expanding rooftop solar access for low-income households. This digest analyzes the current policy landscape and highlights financing strategies that state, local, and private actors can leverage to maintain momentum in equitable clean energy adoption.
At A Glance
Key Challenge
Low-income communities face high energy costs and limited access to clean energy solutions, especially with rollbacks of federal clean energy incentives.
Policy Insight
State governments, municipal utilities, non-profits and philanthropies can expand policies for clean energy adoption and administer programs that increase access to solar and lower energy bills for low-income households.
Introduction
The clean energy transition in the United States is advancing rapidly; however, its benefits are distributed unevenly, with low-income and disadvantaged communities (LIDACs) receiving fewer advantages due to historic marginalization, under-service, and disproportionate exposure to environmental burdens. Including LIDACs in the transition is essential to help communities reap the benefits of lower energy costs and clean air.
While landmark federal policies like the Investment Tax Credit (ITC) have made clean energy projects more viable, recent federal actions have introduced uncertainties for developers, community organizations, and everyday Americans. Rollbacks of clean energy incentives may slow project deployment where it is needed most, compounding long-standing barriers to clean energy access.
In the absence of federal leadership, non-federal actors, including state and local governments, green banks, and philanthropic organizations, play a critical role in bridging the gap to bring clean energy to communities that are often excluded by market measures.
The Investment Tax Credit (ITC)
The Inflation Reduction Act (IRA) of 2022 extended the Investment Tax Credit (ITC) through 2032, maintaining the 30% base credit, with stackable bonus credits for domestic content, “energy communities,” and low-income serving projects (NC Clean Energy Technology Center 2024), bringing total incentives up to 50-70%.
The ITC has been a central mechanism to make solar financially feasible for low-income households, growing the U.S. solar industry 200x since 2006 (SEIA, n.d.). In 2023, 3.4 million Americans received $8.4 billion in tax credits for clean energy and energy efficiency, not to mention the continued annual savings of more than $2,000 on utilities (U.S. Department of the Treasury 2024).
Originally enacted in 1978, the ITC has undergone iterations but was almost always renewed ahead of its expiration by Democrats and Republicans alike (NC Clean Energy Technology Center 2024). With a bipartisan consensus, the ITC has become embedded in the fabric of federal renewable energy incentives and contributed to the growth of the U.S. solar industry, but we are now experiencing a break in bipartisanship.
The H.R.1
In 2023, the U.S. ranked 28th globally in clean energy, with 15.6% of its electricity generated by wind and solar power (EDF 2025). Supported by the IRA, this share rose to 18.6% by mid-2024 (EDF 2025), progressing towards the Biden administration’s goal of 100% carbon-free electricity by 2035. These advances are now at risk of stagnation following the passage of H.R.1 (the One Big Beautiful Bill Act), which may curtail future clean energy investments.
H.R.1, the U.S. tax and spending package signed into law in July 2025, has created considerable uncertainty surrounding the immediate effects on the ITC as well as the longer-term effects on clean energy. The Bill terminated the ITC for wind and solar facilities placed in service after December 31, 2027, potentially jeopardizing the economic viability of more than 300 wind and solar projects (FTI Consulting 2025). These changes may render clean energy projects less attractive to capital investors and developers. The lack of certainty around whether the ITC will exist, and at what level, undermines its role as a stable financing pillar.

The bill’s stricter Foreign Entities of Concern (FEOC) rules, largely aimed at reducing reliance on Chinese supply chains (Bipartisan Policy Center 2025), may also make it more expensive to pursue the ITC.
Given China’s near-dominance in manufacturing solar panels, inverters, and batteries (IEA 2022), U.S. developers may be forced to procure from higher-cost, capacity-constrained alternatives. The price premium of FEOC-compliant equipment could erode or even negate the ITC’s financial benefit.
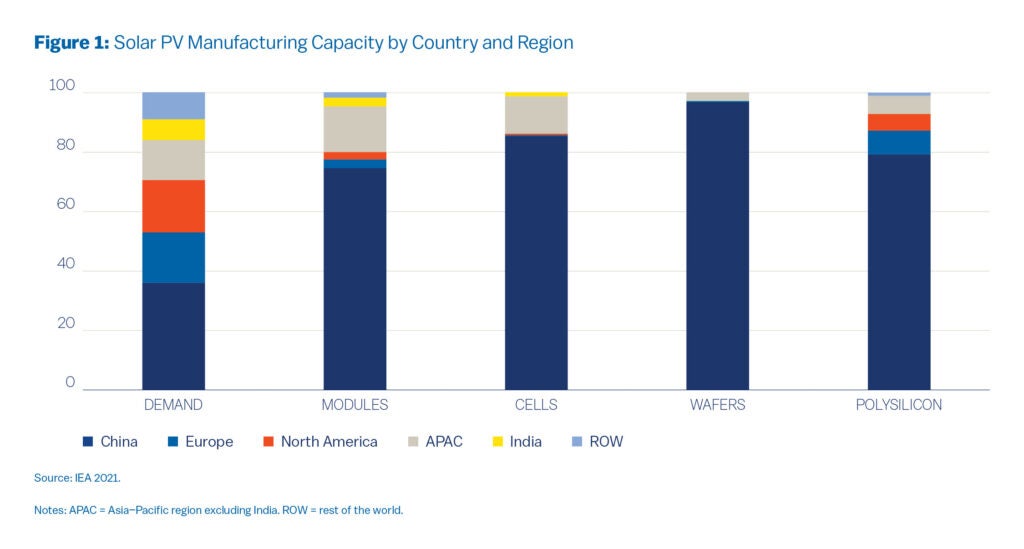
Further guidance and studies on the practical impact of the H.R.1 are still emerging; however, the mere uncertainty of pursuing the ITC under these evolving conditions may already be delaying project timelines. Many developers may be in a holding pattern to see how enforcement plays out and whether costs normalize in new supply chains. In some cases, developers may assume that these rules and the ITC’s current form are tied to this administration and, therefore, choose to pause or stagger new projects in anticipation of more favorable conditions in the future.
The ITC had created more resources and excitement around clean energy in the U.S., especially as the country lags behind other nations in clean energy development. That brings us to the core issue created by H.R.1—at best, a slowdown, or at worst, a loss of momentum in clean energy adoption.

How Does This Impact Low-Income Solar Adoption?
Low-income households are facing a disproportionately high energy burden, with one in four spending more than 15% of their income on utilities (ACEEE 2024), a strain that increases economic insecurity. Increasing access to rooftop solar offers a solution for households to lower their electricity bills and increase their energy security.
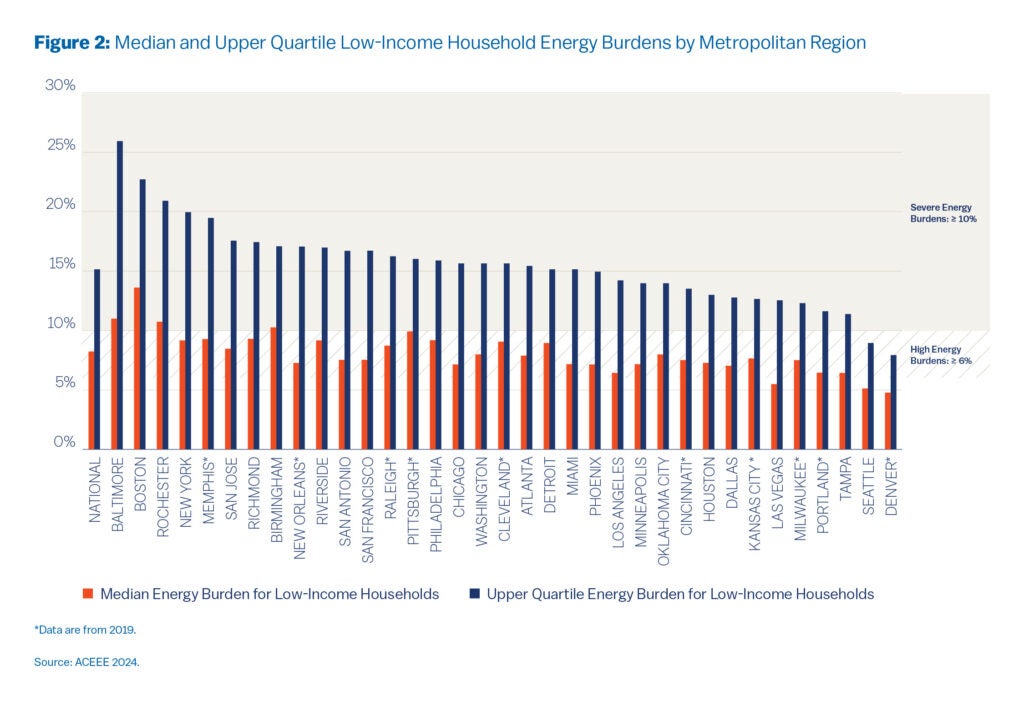
After the H.R.1, the EPA cancelled the Greenhouse Gas Reduction Fund’s (GGRF) Solar for All program, rescinding $7 billion intended to help 900,000 low-income households access rooftop solar and save $350 million annually (Joselow 2025). Although awardees are litigating the cancellation (Joselow 2025), delays will likely disrupt their ability to claim the ITC ahead of the 2027 deadline. This setback is another example of how the current administration’s policy limits low-income households’ ability to access clean energy.
As cities, states, clean energy, and environmental justice nonprofits find themselves at a junction where their programs and mission of delivering affordable clean energy to LIDACs are at risk, it is more important than ever to think creatively and pursue innovative solutions beyond federal grants, to maintain momentum for clean energy adoption for underserved communities.
What Can Different Actors Do to Mitigate Uncertainty?
States
State governments are the next line of institutional defense after the federal government to support solar and clean energy. Several states already have robust incentives for solar technology; however, in states with no such legislation, the course of action over the coming years is to build bipartisan policies that protect residents from rising energy prices, strengthen climate and grid resilience, and lay the groundwork for long-term solar infrastructure. By doing so, states can create a robust solar industry capable of withstanding the uncertainty that comes with changes in federal administrations, so that investments made today will endure and deliver benefits for decades to come.
In Oregon, the Public Purpose Charge (PPC), created under SB 1149 in 1999 and later amended by HB 3141 in 2021, established a stable and predictable funding stream for clean energy and energy efficiency initiatives (Oregon Department of Energy n.d.). The policy requires utilities to collect a small surcharge from all electricity customers, including large industrial users, and directs those funds to state-approved programs administered through the Energy Trust of Oregon. Furthermore, sites with annual electricity usage over 8.76 million kWh can opt to self-direct their renewable and energy efficiency contributions, rather than pay the standard charge, which effectively steers corporate payments toward state-approved clean energy initiatives.
Oregon established the Energy Trust Fund to administer the collected funds from the PPC (Energy Trust of Oregon n.d.). The Energy Trust helped customers manage their energy use and lower their bills, saving more than $1.04 billion on their current and future utility bills over the lifetime of the projects installed in 2024.
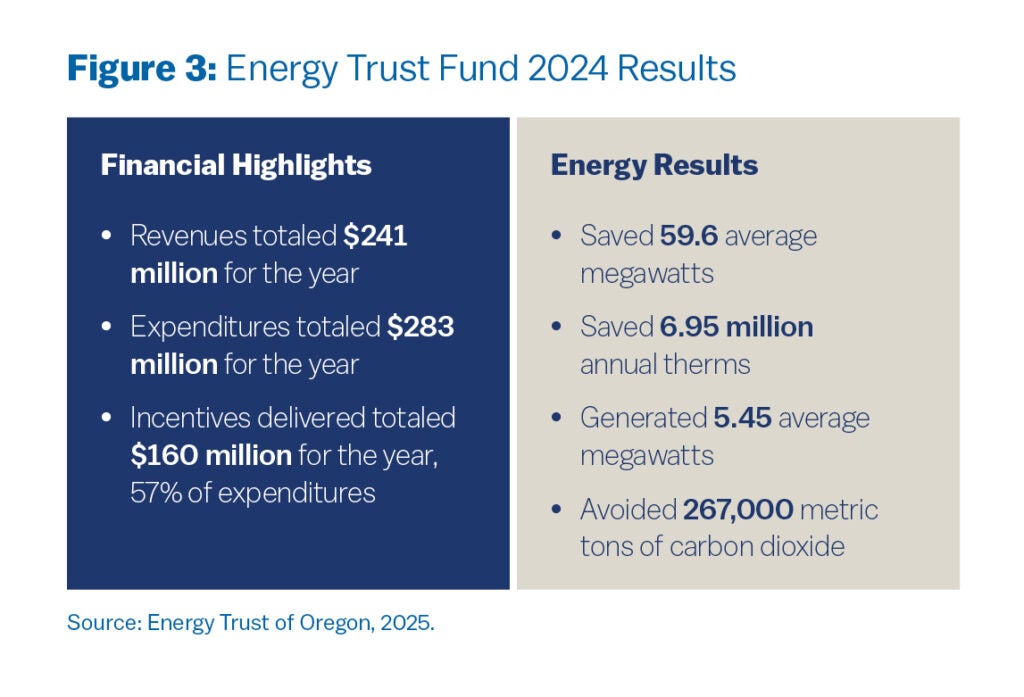
The policy set a floor that 25% of the PPC proceeds must be invested towards renewable energy for low- and moderate-income (LMI) households, and in 2024, the Energy Trust allocated 41% of these funds towards such projects (Energy Trust of Oregon 2025). Private funders contributing to the PPC have also benefited from more stable electricity grids and lower energy costs.
Oregon’s PPC offers a strong precedent for creating a dedicated, long-term funding source to benefit LMI households. By requiring or incentivizing large electricity consumers to self-direct funds into eligible renewable energy or energy efficiency projects, the PPC ensures steady investment in community-focused clean energy.
States seeking to bring the energy and cost savings of solar adoption to LIDACs can build on this model by engaging major private-sector energy users in their region. These “big players” could commit to contributing a set amount of funding toward a state-administered solar program, either through a statutory requirement tied to their electricity consumption or via structured voluntary agreements, incentivized through tangible benefits, such as tax credits, expedited permitting for their own renewable projects, public recognition, and priority access to state grants. This approach merges the reliability of a dedicated funding stream with the flexibility to engage the private sector as a funder, partner, and beneficiary to advance equitable clean energy deployment.
Oregon’s approach has some overlap with the Regional Greenhouse Gas Initiative (RGGI), the U.S.’s first cap-and-trade regulation to reduce power sector CO2 emissions in the states of Connecticut, Delaware, Maine, Maryland, Massachusetts, New Hampshire, New Jersey, New York, Pennsylvania, Rhode Island, and Vermont. Through RGGI, proceeds from carbon allowance auctions are reinvested in energy efficiency and renewable energy programs. RGGI has demonstrated how dedicated, market-driven funding can be redirected to strengthen energy efficiency and reduce household energy burdens.
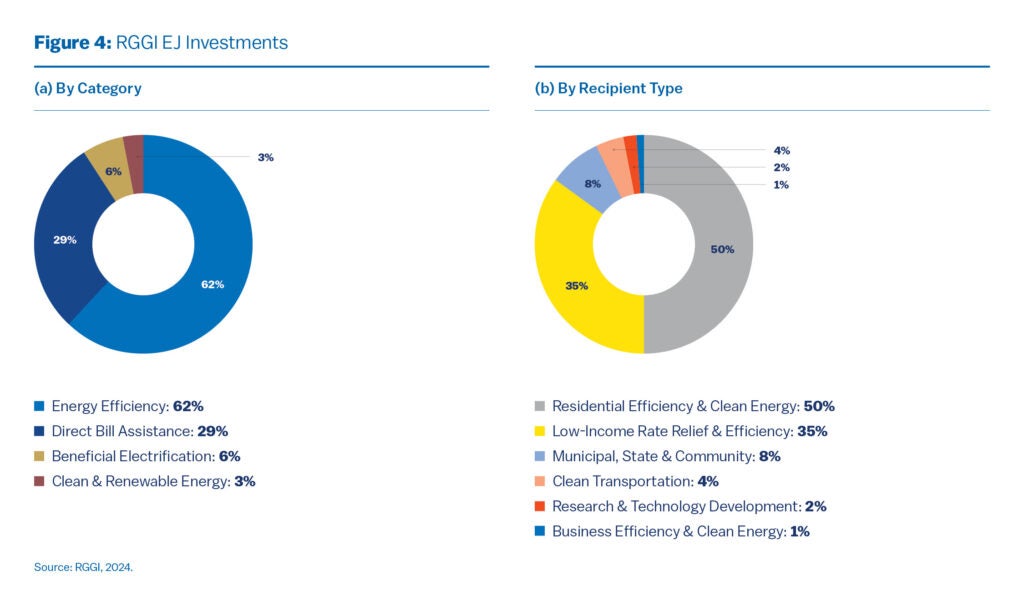
According to the 2023 RGGI investment report, the benefits of RGGI’s 2023 investments amount to $2.7 billion in lifetime energy bill savings (RGGI 2025). However, RGGI’s proceeds are tied to reductions in emissions at the utility or generation level and are not specifically structured to capture contributions from large electricity consumers such as data centers or industrial facilities.
While auction proceeds are also invested in a variety of programs focused on environmental justice (EJ) to deliver benefits directly to EJ communities, the program does not directly guarantee reinvestment into community-level solar and clean energy access for LIDACs. The equity investments in 2023 total to approximately 36% of all RGGI proceeds invested by the participating states in 2023; of this, just 3% of proceeds are channeled towards clean energy development (RGGI 2025). This leaves room for state-level models like Oregon’s PPC or hybrid approaches to fill that gap by targeting both equity outcomes and grid resilience.
In Pennsylvania, with a lower chance of RGGI being deployed, Governor Shapiro proposed the Pennsylvania Climate Emissions Reduction Act (PACER) in 2024—an alternative to the RGGI (The Energy Co-op 2024)—parceled with legislation that includes the Pennsylvania Reliable Energy Sustainability Standard (PRESS) to set more ambitious renewable energy goals. A policy similar to Oregon’s PPC would be complementary to Pennsylvania’s clean energy and equity needs, especially as lawmakers actively position the state as a data center hub (Spotlight PA 2025) to meet the growing demands of the artificial intelligence (AI) industry. While this strategy promises to attract considerable investment, creating jobs and repurposing former manufacturing sites, it risks adding a substantial strain on the power grid, increasing concerns of rising electricity bills for residents. Negotiating agreements with data center investors to self-direct a portion of their capital towards a dedicated clean energy development fund, Pennsylvania can simultaneously invest in renewable generation, grid upgrades, and long-term cost stability for households.
Cities and Utilities
Nonetheless, with the growing political divide on clean energy, securing bipartisan support for solar, even with its cost savings and wide-ranging benefits for residents, may be difficult in swing states and unlikely in many red states. It becomes especially important for city-level actors operating in unfavorable state policy environments to take the reins and enable the clean energy transition in their cities. By advancing clean energy initiatives, cities can help residents benefit from lower energy costs, improved air quality, and greater grid resilience, while keeping the momentum of the clean energy transition alive at the local level.
Nashville faces growing energy challenges as population growth drives up demand and strains affordability. One-quarter of Nashville households are highly energy-burdened, spending more than 10% of their income on energy (Bloom 2025). Most of the state’s electricity is provided by the Tennessee Valley Authority (TVA), a federally owned utility with limited local accountability, leaving Nashville with few levers to increase affordability and renewables (Bloom 2025).
At the state level, Tennessee imposes significant barriers to the expansion of clean energy. Nearly all of the state’s counties have adopted restrictive zoning or permitting requirements for renewable energy, which makes siting utility-scale solar projects extremely difficult. Some counties have even enacted outright bans, notably Franklin County’s 2022 moratorium on commercial renewable projects (Magtoto 2024). These legal and political obstacles hinder clean energy development across the state, leaving local initiatives as some of the only pathways to scale renewable deployment and address inequities.
Despite these conditions, Nashville is a leader in urban renewables development through its community solar format. Nashville Electric Service’s (NES) Music City Solar offers a pragmatic and equity-oriented solution. Music City Solar is a municipally operated community solar project in Davidson County, Tennessee, through which NES’s residential and commercial customers participate in clean energy even without suitable roof space. The program enables “panel subscriptions,” with participants receiving monthly energy credits on their utility bills, proportional to their share of the solar output, through 2038 (NES Clean Energy 2025).
An interesting program feature is the Solar Angels donations, which allow customers to purchase a panel subscription and instead “gift” the energy credit to friends or family or make a tax-deductible donation that provides subscription subsidies to low-income customers or for energy-efficiency and weatherization programs (NES Clean Energy 2025). The proceeds from the program are partially directed toward helping energy burdened communities, designing the program with built-in mechanisms to ensure equitable access to solar.
Music City Solar is an example of how city-level actors operating in adverse state contexts can create innovative routes to increase participation in solar. NES’s model lowers access barriers, increasing options for residents who cannot install rooftop solar themselves.
Nonprofits
In environments where city and state conditions are unfavorable and bipartisan support for clean energy is hard to come by, nonprofits and philanthropic organizations play a salient role in filling the gap. By stepping in to fund and design clean energy initiatives, they can keep projects moving forward, guarantee that underserved communities are not left behind, and maintain momentum toward a more equitable energy future. Their ability to act independently of political gridlock makes them a driver in sustaining progress when other avenues stall.
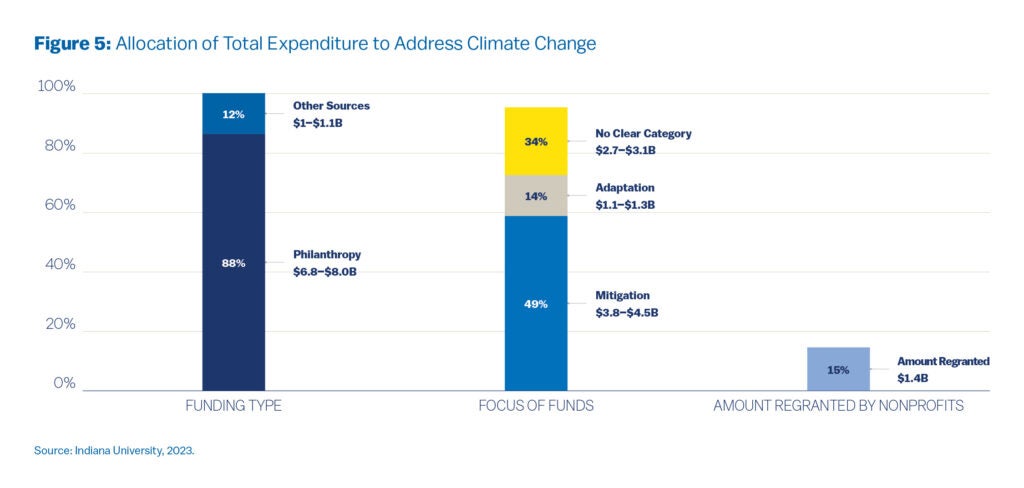
This spotlights how important it is to have a diversified source of climate funding. A crucial contributor to this funding pool is philanthropy. According to a study conducted by the Indiana University Lilly Family School of Philanthropy, approximately 88% ($6.8 billion to $8 billion) of the total climate expenditure of U.S. nonprofits was funded by philanthropy. The study also reported that Green and Resilient Energy Supply comprised 34% ($2.6 billion to $3.1 billion) of the total climate expenditure by nonprofit organizations. This presents a substantial opportunity for clean energy access-centric nonprofit organizations, particularly in scaling their reach.
The Philadelphia Energy Authority (PEA) and its affiliate green bank, the Philadelphia Green Capital Corp. (PGCC) are focused on energy development and equitable energy finance. Solarize Greater Philadelphia (SGP) and Built to Last (BTL) are two pivotal programs administered by PEA and PGCC. SGP focuses on providing low-cost PPA-structured rooftop solar installations, while Built to Last is a grant-based program that directs funding directly into the hands of Philadelphia homeowners to use on home electrification and rooftop solar installations. The chart below shows how SGP has increased LMI participation in solar installations and financing structures.
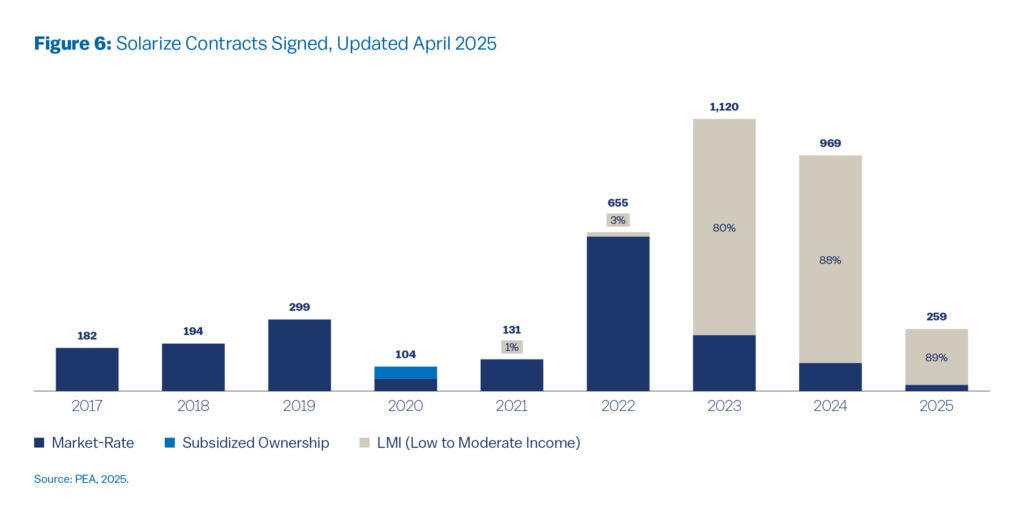
Additionally, BTL assembles funding from philanthropic sources and has served more than 300 households. PGCC provides the administrative foundation for BTL by tapping into philanthropic funding and layering capital to fund whole-home repair, electrification, and rooftop solar grants to low-income homeowners in Philadelphia. By leveraging philanthropy, nonprofits are in the unique position to create a stable administrative backbone for solar and clean energy programs for low-income homeowners. The challenge and opportunity lie in scaling these programs to provide a counter to federal, state, and local policy changes towards clean energy. Establishing a partnership with large foundations and/or corporate social responsibility programs can help counteract the funding uncertainty brought about by cancellations of programs like Solar for All.
One example of a nonprofit and foundation partnership is Financing Resilient Power, a $3.3 million initiative from The Kresge Foundation in partnership with the nonprofit Clean Energy Group (CEG) (Clean Energy Group 2020). This program represents the first time a U.S. foundation has aligned its grant-making and program-related investments in a comprehensive strategy to advance solar-plus-storage technologies in underserved communities. Under this initiative, CEG manages a mix of capacity-building and technical assistance grants alongside financial tools such as loan guarantees, to reduce investment risk and attract private capital.
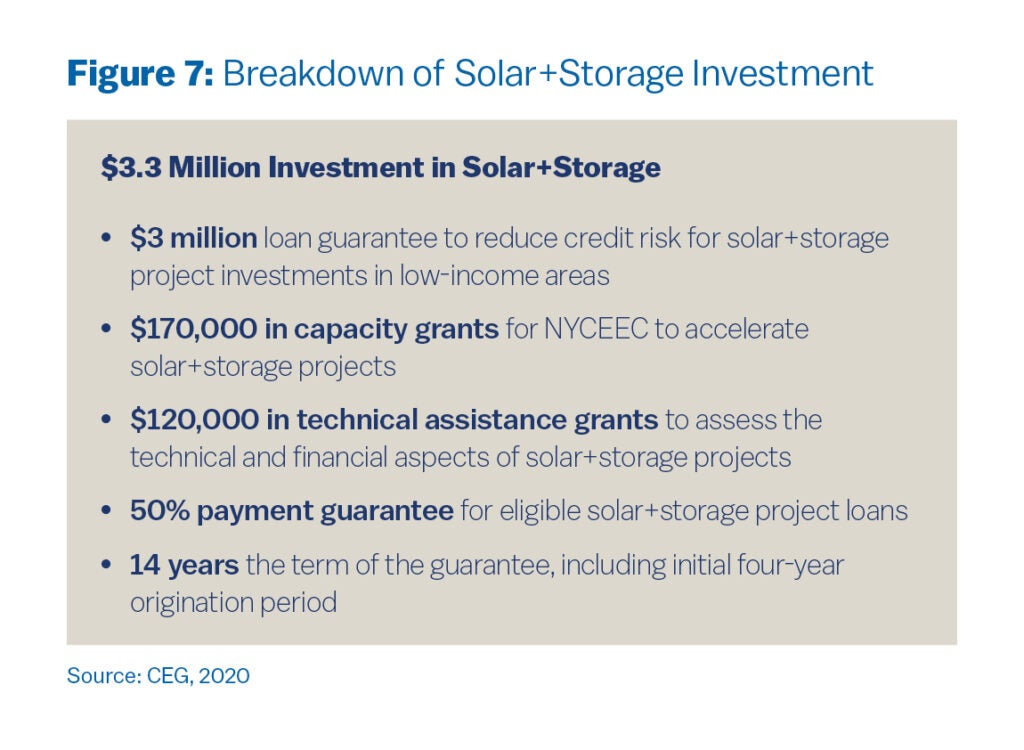
The program is designed to build pipelines for LMI solar+storage projects and increase local capacity for long-term success. By pairing philanthropic funding with nonprofit administration, Financing Resilient Power provides a replicable model for nonprofits and foundations to directly enhance equity in clean energy deployment while providing market stability during times of policy uncertainty.
Conclusion
While there’s no one-size-fits-all solution or silver bullet to preserve excitement and advances in clean energy for the most underserved members of our communities, a mix of tailored solutions, supportive policies, and strategic partnerships can expand adoption and make the economics of clean energy viable for low-income households.
Vanshika Arora
2025 Kleinman PEA FellowVanshika Arora is the Summer 2025 PEA/PGCC Fellow at the Kleinman Center. She is pursuing the Master of Environmental Studies program (MES ’25), focusing on finance and energy. Vanshika is a Kleinman Center Student Advisory Council Member.
ACEEE (American Council for an Energy-Efficient Economy). 2024. “Energy Burden Research.” September 10, 2024. Accessed September 23, 2025. https://www.aceee.org/energy-burden.
Bipartisan Policy Center. 2025. “Unpacking the FEOC Provisions in H.R. 1, the One Big Beautiful Bill Act.” July 28, 2025. Accessed September 23, 2025. https://bipartisanpolicy.org/explainer/unpacking-the-feoc-provisions-in-the-one-big-beautiful-bill-act/.
Bloom, P. 2025. “Renewable Energy: A Crucial Next Step for an Equitable Nashville.” Medium. February 5, 2025. https://medium.com/@celions/renewable-energy-a-crucial-next-step-for-an-equitable-nashville-23807ec4c57d.
Clean Energy Group. 2020. “Financing Resilient Power: Fact Sheet.” September 2020. https://www.cleanegroup.org/wp-content/uploads/Financing-Resilient-Power.pdf.
Energy Trust of Oregon. 2025. 2024 Annual Report. Accessed September 23, 2025. https://www.energytrust.org/wp-content/uploads/2025/04/Energy-Trust-2024-Annual-Report.pdf.
Energy Trust of Oregon. n.d. “History and Mission of Energy Trust.” Accessed September 23, 2025. https://www.energytrust.org/about/who-we-are/history/.
Environmental Defense Fund. 2025. “These 10 Countries Are Winning the Global Clean Energy Race (and the U.S. Is Not One of Them).” EDF Vital Signs, January 13, 2025. Accessed September 23, 2025. https://vitalsigns.edf.org/story/these-10-countries-are-winning-global-clean-energy-race-and-us-not-one-them#:~:text=Where%20does%20the%20U.S.%20rank,of%202023%20%E2%80%94%20to%20pull%20ahead.
FTI Consulting. 2025. “H.R. 1 and the Energy Transition.” July 16, 2025. Accessed September 23, 2025. https://www.fticonsulting.com/insights/articles/h-r-1-energy-transition.
IEA (International Energy Agency). 2022. “Solar PV Manufacturing Capacity by Country and Region, 2021.” Accessed September 23, 2025. https://www.iea.org/data-and-statistics/charts/solar-pv-manufacturing-capacity-by-country-and-region-2021.
Indiana University Lilly Family School of Philanthropy. 2023. Mapping Nonprofit Spending on Climate Change. Indianapolis: Indiana University, Lilly Family School of Philanthropy. https://scholarworks.indianapolis.iu.edu/items/5f000905-6d8f-4f9d-8571-df5c0d69b862.
Joselow, Maxine. 2025. “EPA Cancels Solar Energy Grants.” New York Times. August 5, 2025. Accessed September 23, 2025. https://www.nytimes.com/2025/08/05/climate/epa-cancels-solar-energy-grants.html.
Joselow, M. 2025. EPA sued over Solar for All program termination. The New York Times. October 6, 2025. https://www.nytimes.com/2025/10/06/climate/epa-solar-for-all-lawsuit.html.
Magtoto, J. 2024. “Why It’s So Hard to Bring Clean Energy to Tennessee.” Renewable Energy World, April 17, 2024. https://www.renewableenergyworld.com/energy-business/policy-and-regulation/why-its-so-hard-to-bring-clean-energy-to-tennessee/.
NC Clean Energy Technology Center. 2024. “The Past, Present, and Future of Federal Tax Credits for Renewable Energy.” North Carolina State University. November 19, 2024. Accessed September 23, 2025. https://nccleantech.ncsu.edu/2024/11/19/the-past-present-and-future-of-federal-tax-credits-for-renewable-energy/.
NES Clean Energy. 2025. “Music City Solar.” Nashville Electric Service. Accessed September 23, 2025. https://nescleanenergy.com/music-city-solar/.
Joselow, Maxine. 2025. “EPA Cancels Solar Energy Grants.” New York Times. August 5, 2025. Accessed September 23, 2025. https://www.nytimes.com/2025/08/05/climate/epa-cancels-solar-energy-grants.html.
Oregon Department of Energy. n.d. “Public Purpose Charge (PPC).” Accessed September 23, 2025. https://www.oregon.gov/energy/energy-oregon/Pages/Public-Purpose-Charge.aspx.
Philadelphia Energy Authority. 2025. PEA FY25 Q4 Board Overview – DRAFT. August 2025. https://philaenergy.org/wp-content/uploads/2025/08/PEA-FY25-Q4-Board-Overview-DRAFT.pptx.pdf.
Public Citizen. 2024. “Austin City Council Approves Two Game-Changing Local Solar Programs.” December 13, 2024. Accessed September 23, 2025. https://www.citizen.org/news/austin-city-council-approves-two-game-changing-local-solar-programs/.
RGGI, Inc. 2025. “Investments of Proceeds.” Accessed September 23, 2025. https://www.rggi.org/investments/proceeds-investments.
Solar Energy Industries Association (SEIA). n.d. “Solar Investment Tax Credit (ITC).” Accessed September 23, 2025. https://seia.org/solar-investment-tax-credit/#:~:text=The%202022%20extension%20of%20the,tax%2C%20infrastructure%2C%20or%20decarbonization.
Spotlight PA. 2025. “Data Center Boom Inspires Flurry of Bills from Pa. Lawmakers Hoping to Make State an AI Hub.” July 15, 2025. Accessed September 23, 2025. https://www.spotlightpa.org/news/2025/07/data-centers-pennsylvania-artificial-intelligence-ai/.
The Energy Co-op. 2024. “PACER vs. RGGI: Charting Pennsylvania’s Path to a Clean Energy Future.” May 16, 2024. Accessed September 23, 2025. https://www.theenergy.coop/blog/pacer-vs-rggi/.
U.S. Department of the Treasury. 2024. “U.S. Treasury Releases New Data on American Consumer Energy Savings under Inflation Reduction Act.” August 7, 2024. https://home.treasury.gov/news/press-releases/jy2521.

