Your Uber Has Arrived: How Ridesharing Expands Access, Increases Emissions, and Changes Cities

Ridesharing takes us to more places, more often. With better access, city outskirts open up and bring new commerce... and more emissions.
Introduction
Ridesharing has revolutionized urban travel, allowing riders to access locations with affordable and customizable point-to-point transit. Consumers are adding new vehicle trips at rapid rates, prompting policymakers to ask about the impact ridesharing is having on our cities. Many sources have reported that ridesharing companies are rapidly expanding and are now a major transportation provider (Schaper 2018, Hu 2017, Bialik, Fischer-Baum and Mehta 2015).
These services both compete with, and complement existing public transit as well as personal cars (Hall et al. 2018, Silver and Fischer-Baum 2015). Recently, New York City took a big step in curbing congestion in Manhattan, blamed in part on the rise of ridesharing (Hu 2019a). In 2021, vehicles wishing to go below 60th Street will need to pay at least $10 in congestion fees (Hu 2019b). While congestion policy is central to many large cities, ridesharing’s impact reaches farther than the street. Cities at their most basic consist of people, firms, and the links between them: material infrastructure, and immaterial access costs. Ridesharing changes access costs, leading us to ask in what other ways are these platforms changing our cities?
As with so many new technologies, the good comes with the bad. With ridesharing in particular, the good and bad do not always co-locate, as not all locations within cities are treated equally. For example, ridesharing may cause an increase in congestion in Manhattan as people working and living there travel more often, but open up new swaths of the city to those living in the outer boroughs, historically under-served by public transit and taxis.1
As residents increase trips to previously under-served locations, city governments need to incorporate spatial differences into their transportation regulations. So far, many cities have responded to the increase in ridesharing trips with policies targeted at congestion in the centers; however, targeting congestion alone won’t reduce emissions in a city like New York City, where much of the growth in trips is in the least congested areas of the city.
Ridesharing Improves Access in NYC
Numerous news outlets have reported on the rise of ridesharing platforms in the underserved outer boroughs (Bialik, Flowers, Fischer-Baum and Mehta 2015; Fischer-Baum, and Bialik 2015; Hu 2017). While the yellow cab is one of the most recognizable symbols of the city, it is far from omnipresent outside of Manhattan. Poorer and minority areas have long had trouble hailing yellow cabs, to the extent that the city introduced green cabs in 2013 to provide more options to outer borough residents, those in the Bronx, Brooklyn, Queens and Staten Island.2 In conjunction with the difficulty in hailing a cab, these areas are much less densely served by the subway systems, and are overall harder to access and leave.
Using a combination of publicly available data from the NYC Taxi & Limousine Commission (TLC) as well as data acquired by Bialik, Flowers, Fischer-Baum and Mehta of the website FiveThirtyEight using a Freedom of Information Act (FOIA), we can construct the time series of trip origination locations by car travel mode: yellow cab, green cab, ridesharing platform.3
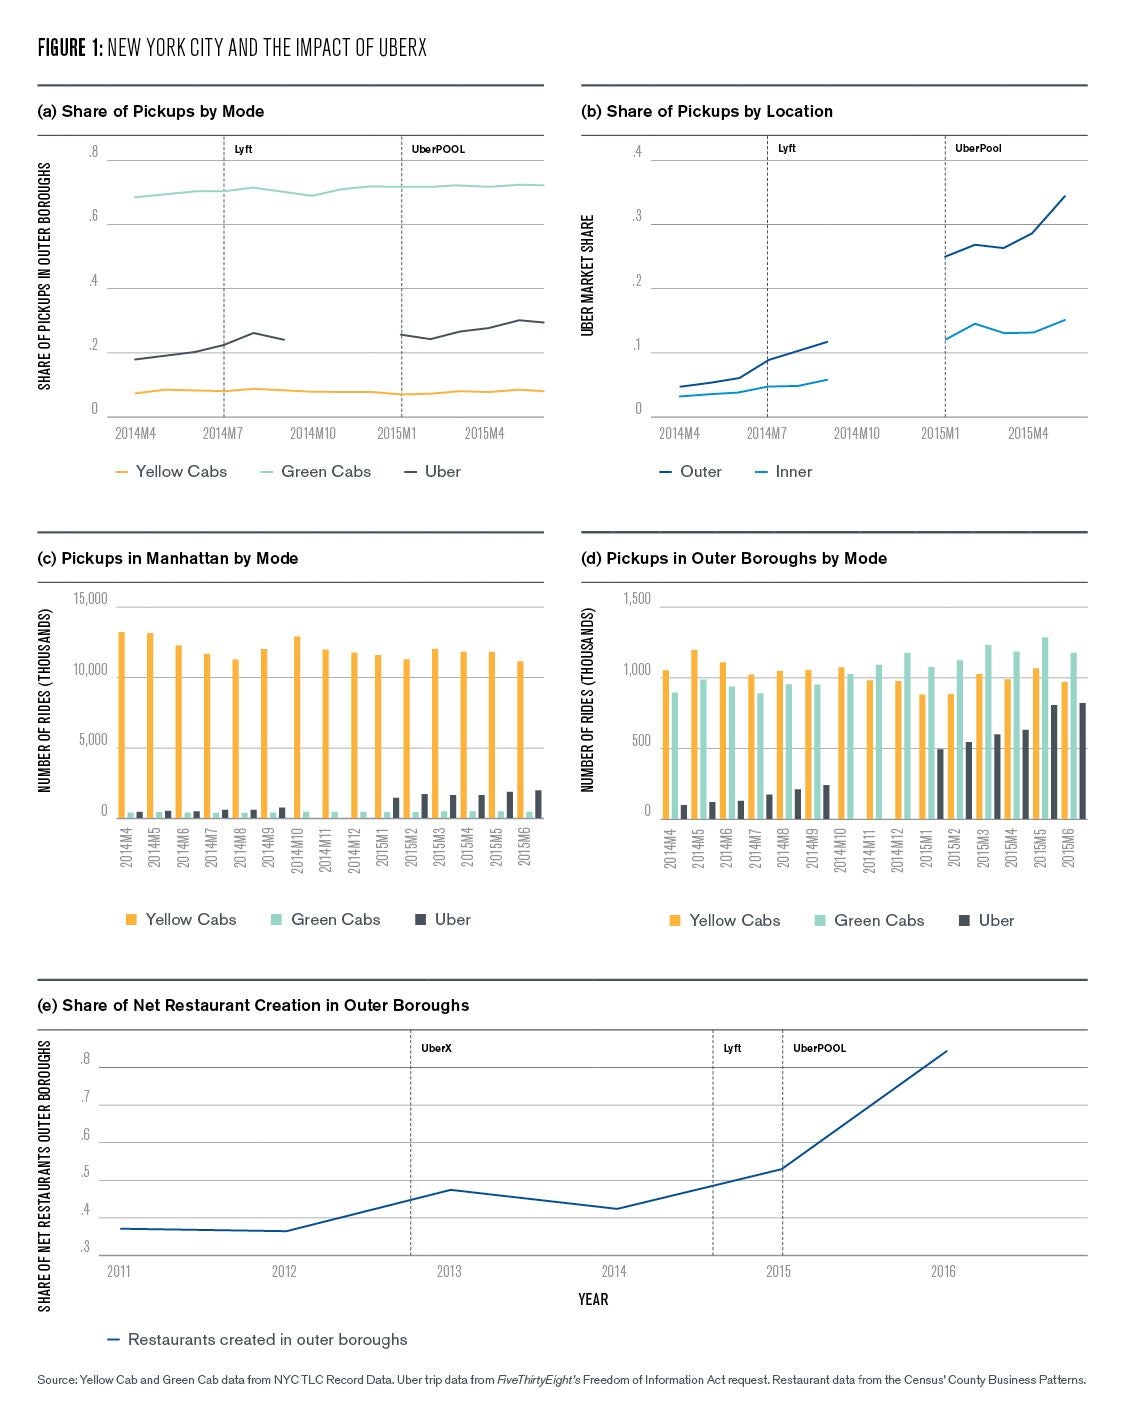
The top four panels in Figure show the time series of trips using yellow cabs, green cabs, and Uber between April 2014 and June 2015. While Uber entered NYC prior to the data, Uber’s chief competitor, Lyft entered in July, 2014, and Uber introduced UberPOOL in January 2015.4 Both of these events likely pushed more users toward the platforms as ridesharing picked up speed.
Panel (a) shows the share of pickups in the outer boroughs between April 2014 and September 2015, for each type of car service. The yellow line, lowest in the panel, shows that only about 10% of all yellow cab rides began in the outer boroughs. In contrast, green cabs picked up around 75% of their riders in the outer boroughs.5 Uber was the only service that saw its share of pickups in the outer boroughs increase over time; the share of Uber’s pickups in the outer boroughs of Brooklyn, the Bronx, Queens, and Staten Island rose from just under 20% to above 30%.
In short, Manhattan’s share of Uber pickups fell by about half, while remaining stable for yellow and green cabs. Panel (b) shows Uber’s market share in inner vs. outer boroughs in NYC, calculated as the number of Uber trips over the sum of Uber, yellow cab, and green cab trips. In 2014, Uber covered about 5% of all pickups, regardless of the borough. As more people adopted ridesharing platforms, and costs fell due to competition and UberPOOL, Uber made up an increasing share of all trips in both boroughs.
By June, 2015, Uber made up nearly 40% of all trips originating in outer boroughs, but only about 18% in Manhattan. Panels (c) and (d) show the number of pickups by car type. Manhattan remains overwhelmingly dominated by yellow cabs, reflecting the fact that this central borough has always enjoyed high transportation access; when you can walk outside and see multiple yellow cabs, there is little need to call an Uber to you.
On the other hand, in the outer boroughs, there are many fewer yellow and green cabs distributed over much larger spaces. Most likely, upon exiting a restaurant in the outer boroughs, you will not immediately find a cab. Ordering an Uber cuts down on search time, and begins to take off in 2015 as a close substitute to the other taxi services in number of trips, increasing the number of trips from all modes from around 2 million in April, 2014 to approximately 3 million in June 2015.
Taken together, panels (a) through (d) in Figure 1 how that while all NYC residents have changed their travel mode choices in the ridesharing era, this is especially so in the previously under-served outer boroughs. While the total number of trips beginning in Manhattan remained around 15 million over the sample period, the number of trips originating in outer boroughs increased by 50%.
What are the implications of this huge growth in trips taken? Once an area becomes more accessible, firms can enter previously empty or poorly-served locations. One type of firm that may benefit greatly from increased access is restaurants. Restaurants must draw customers to them, and travel time and cost is a considerable margin of choice when dining out.
Panel (e) in Figure 1 shows the share of restaurant net creation (the data do not differentiate openings and closings) from the County Business Patterns opening in the outer boroughs over the sample period.6 The share of restaurant net creation in outer boroughs goes from under 40% to nearly 80%, showing a huge boom in restaurant net creation in the outer boroughs.
Restaurants need only attract a set number of customers each day, and they need not be the same ones. Whereas customers used to need visual access to cabs or physical access to the subway, requiring co-location between restaurants and transit, on-line ride hailing breaks that need. Thus, one restaurant can make a profit in a farther flung location if that area has become newly accessible, all while taking advantage of lower rents than in the accessible core.
Figure 1 shows that ridesharing impacts travel decisions and restaurant growth in outer boroughs much more than in Manhattan’s congested core. To measure how much more, we can look to the TLC data on yellow cab trips from 2009-2016.7 Unlike Uber drivers, taxis did not have targeted pickups in which they knew where their next passenger was until late 2015.8 Instead, taxis relied on physical ride-hailing and the most efficient way to do this is to work in dense areas, which cuts down on search and match time between taxis and their clients. This means that taxis follow the economic activity in cities; they co-locate with bars, restaurants, and other venues where they can easily find customers at the expense of less economically dense areas.
Given that taxis follow economic activity, if ridesharing has changed the set of destinations New Yorkers are interested in, we expect yellow cabs to follow. For example, a resident of Manhattan might be more likely to dine out in Queens after Uber entry knowing that she can hail a ride home using an app. Importantly for this analysis, in the context of Manhattan, Uber pickups and yellow cab pickups are closely substitutable; this is not true in outer boroughs.
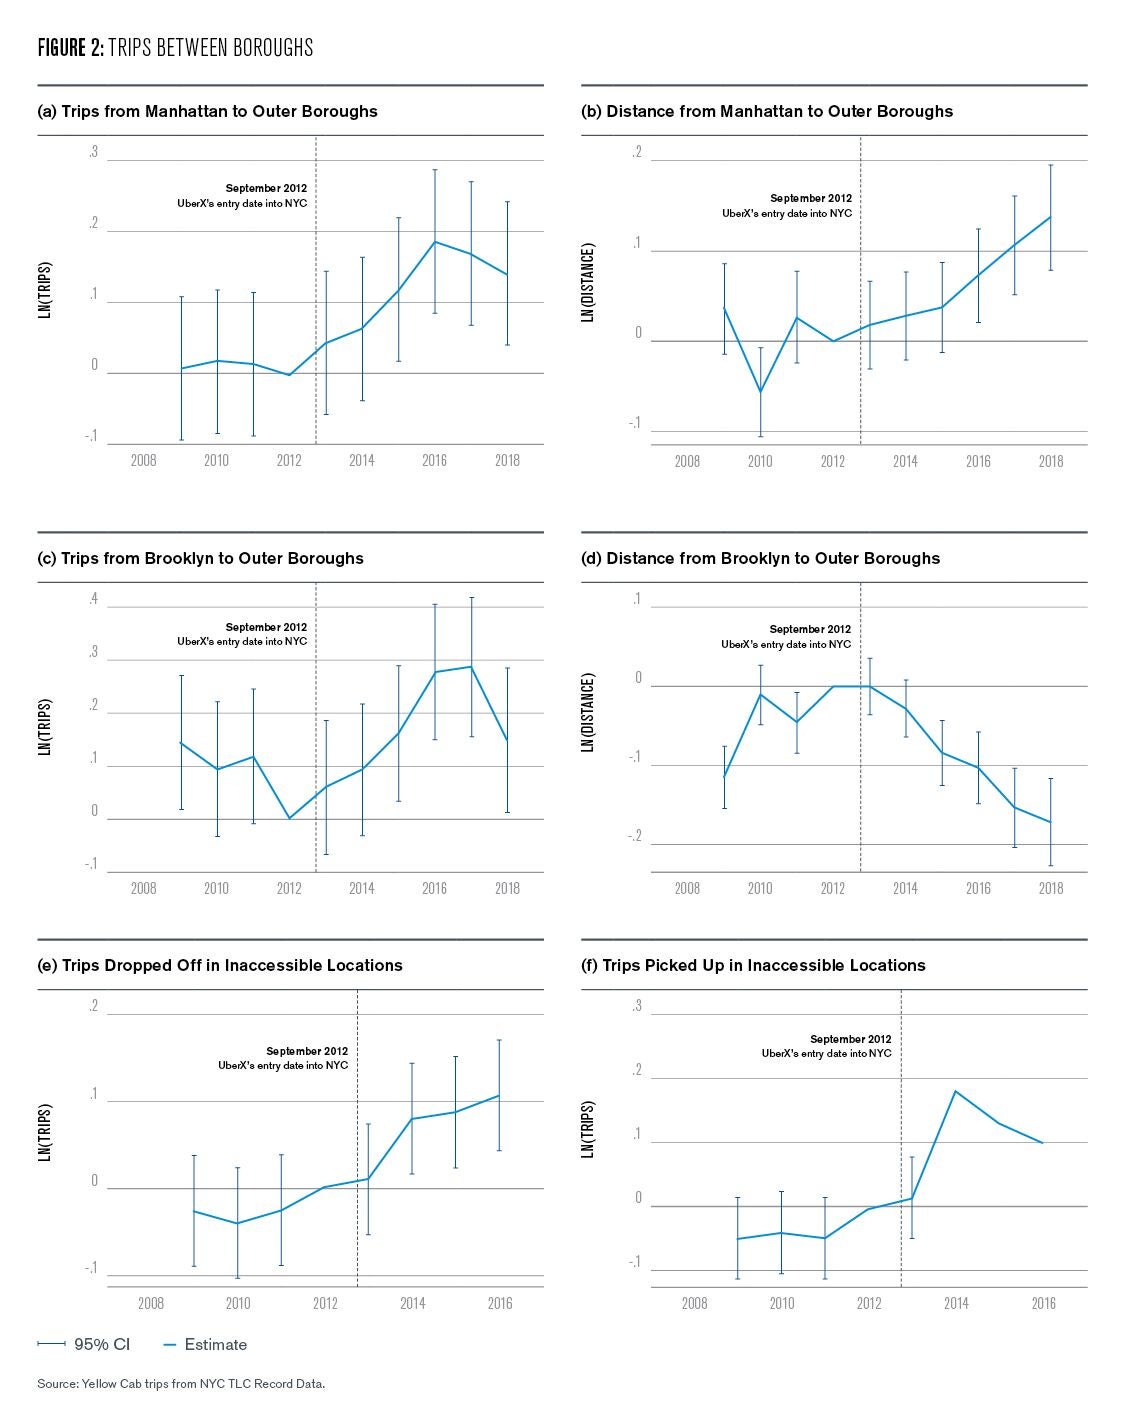
Figure 2 (a) shows that, conditional on taking a trip starting in Manhattan, riders were 14% more likely to travel to the outer boroughs after Uber entered in September 2012. Panel (b) shows that the distance traveled for this type of trip also increased. Panels (c) and (d) show that travelers from Brooklyn also traveled to the outer boroughs more often after UberX entered, but the distance traveled declined, likely as the outer boroughs became more destination-worthy as they filled transit-poor areas in with bars and restaurants easily reached via ridesharing. In sum, panels (a) through (d) show that taxis travel to different locations after Uber’s entry, following new economic activity.
How do we measure trips to new bars and restaurants without asking the rider where he or she is traveling? We can split the set of zip codes in NYC into two groups: those that were hard to reach via public transit if you wanted to eat at a restaurant, and those that were easy to reach via public transit.
Let’s call these the restaurant-inaccessible (RI) and restaurant-accessible (RA) locations. Panels (e) and (f) in Figure 2 compare travel between RI and RA locations, agnostic of borough. Panel (e) shows that the likelihood of being dropped off by a yellow cab in an RI location after UberX enters NYC is, on average, 14% higher than before, relative to RA locations. Similarly, panel (f) shows that yellow cab pick-ups in RI locations increased 9% more than in RA locations after UberX entered. These panels suggest that these ex-ante restaurant poor locations have become more destination-worthy.
Ridesharing Expands Amenities Nationally
Taken together, the New York City results show that the major impact ridesharing has had on our cities in not that of congestion, but rather expansion. Transit-underserved residents are traveling more often to consume goods and services from a more diverse set of destinations.
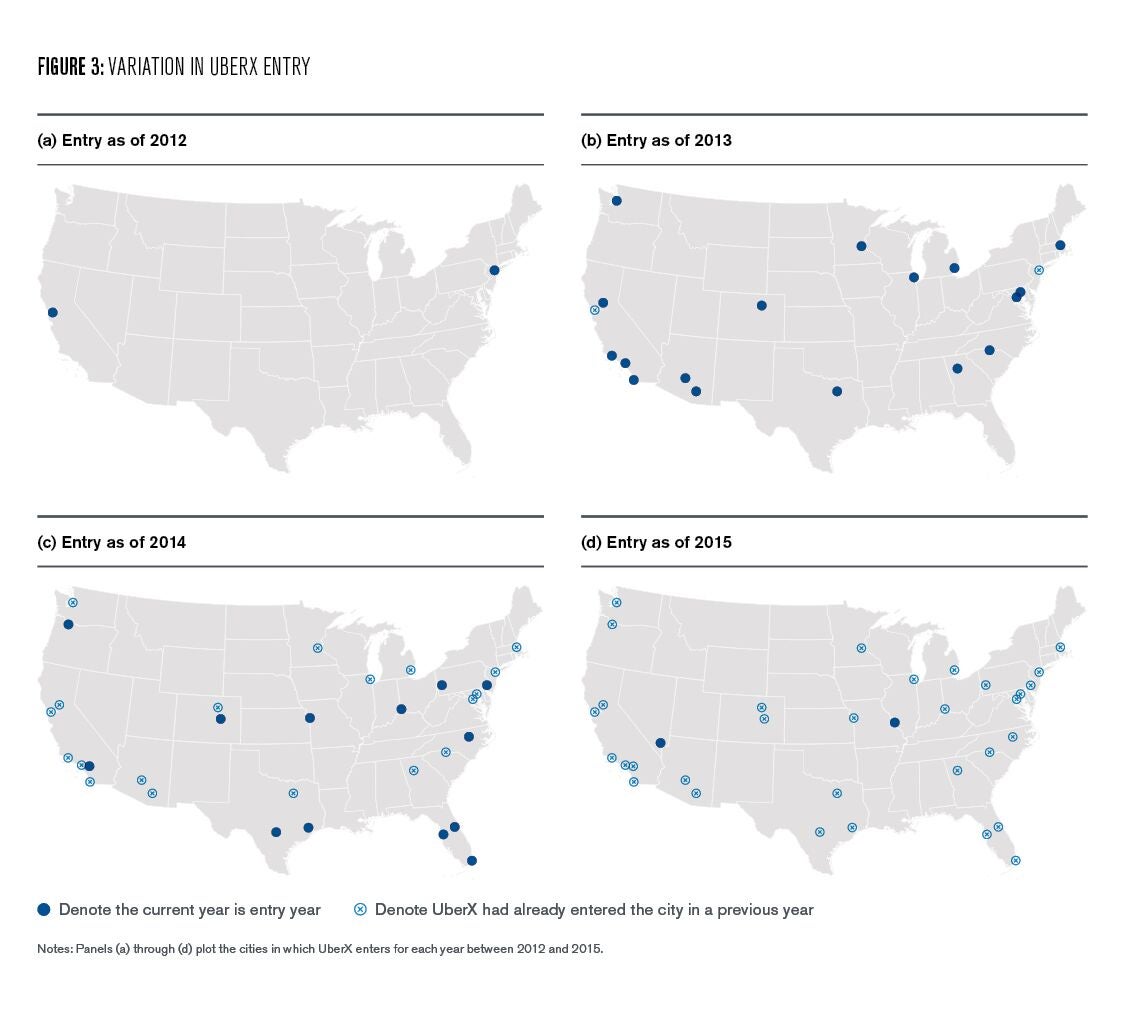
While we do not have the same quality or amount of trip data nationally as in NYC, and so cannot track trips to RI zip codes, the United States Census provides data on how many restaurants exist in each zip code in its County Business Patterns data. We can compare RA to RI zip codes nationally, and at different points in time to measure the increase in restaurants after UberX enters a city.9 Figure 3 shows where UberX entered the most populous U.S. cities, starting in 2012 with just two cities. By 2015, all 34 U.S. cities with above 1 million people had access to UberX.
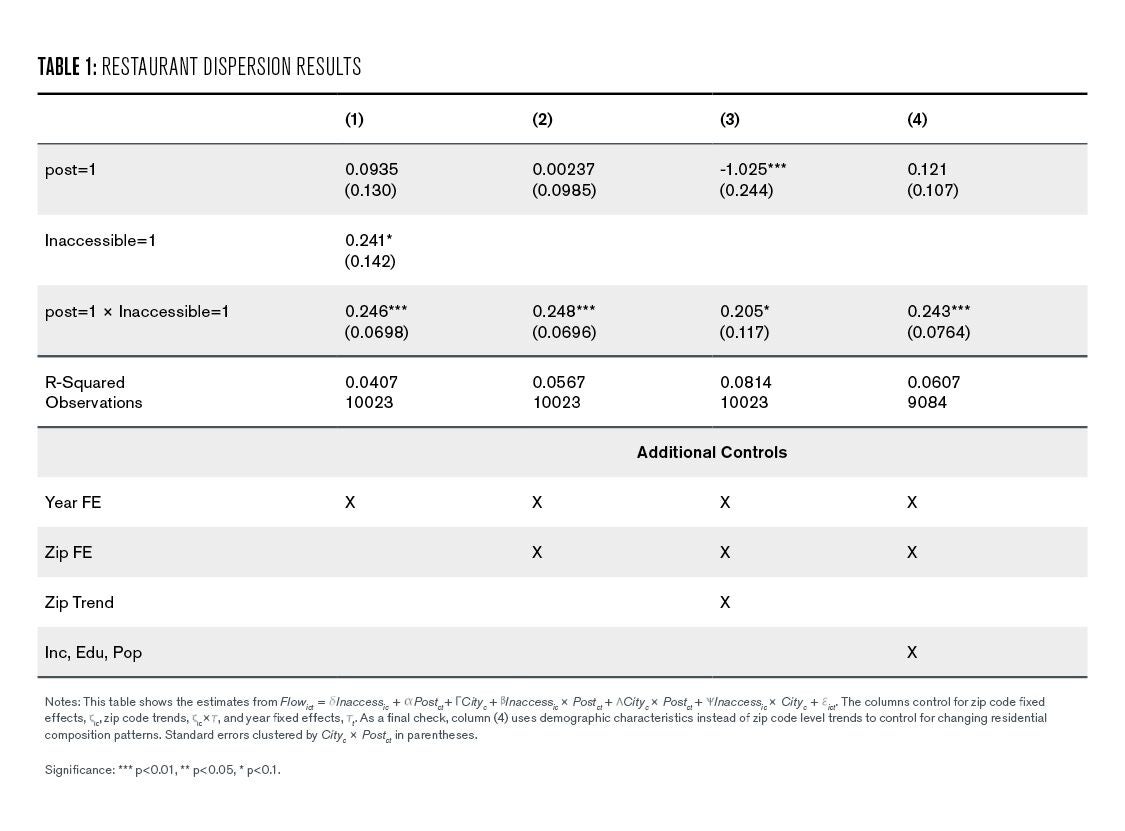
Table 1, row 3 shows that after UberX enters a city in this 34 city sample, RI locations gain on net an additional 0.2 – 0.25 restaurants per zip code, per year, relative to their RA peers. This doubles the net creation rate for RI locations to 0.5 (summing rows 2 and 3), which had on average only 4 restaurants per zip code prior to entry, and grew at 0.25 restaurants per year
This shows that restaurants are dispersing into RI locations after UberX enters a city. Furthermore, there is no need to expect these results should be unique to restaurants. Other services we travel to that depend on travel choice (movie theaters, concert venues, bars) may also be dispersing, but there are fewer observable to researchers in the data.10 Over the same period, there is no change in the provision of dentists, which suggests the restaurant dispersion is not part of citywide dispersion of services. There is also no impact on dry cleaners, which are tied to our residential locations, suggesting people do not move because of UberX, dragging restaurants with them. In short, ridesharing opens a new set of destinations for residents to travel for pleasure, rather than for business.
…But More Access Yields More Emissions
While the results presented thus far show the benefits of increasing access (improved travel options, dispersion of amenities to underserved areas), the gains of more travel come with the cost of more travel; namely, vehicle emissions. The World Health Organization reports that vehicle emissions such as carbon monoxide (CO) decrease concentration and coordination in vehicle operators, and contribute to ground-level ozone formation, which exacerbates diseases such as asthma (World Health Organization 2005). Furthermore, NASA reports that CO contributes to global warming through its interactions with carbon dioxide, methane, and ozone (Shindell 2007). As such, there has been a global push to limit vehicle emissions.
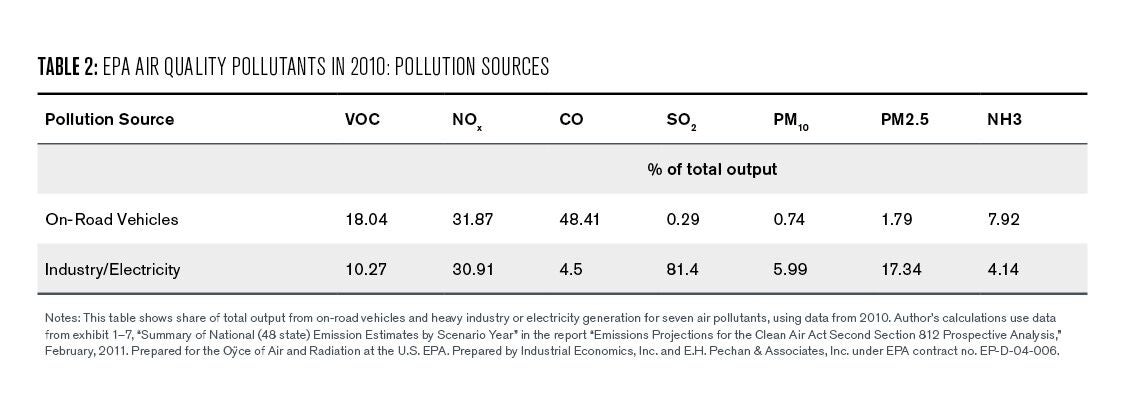
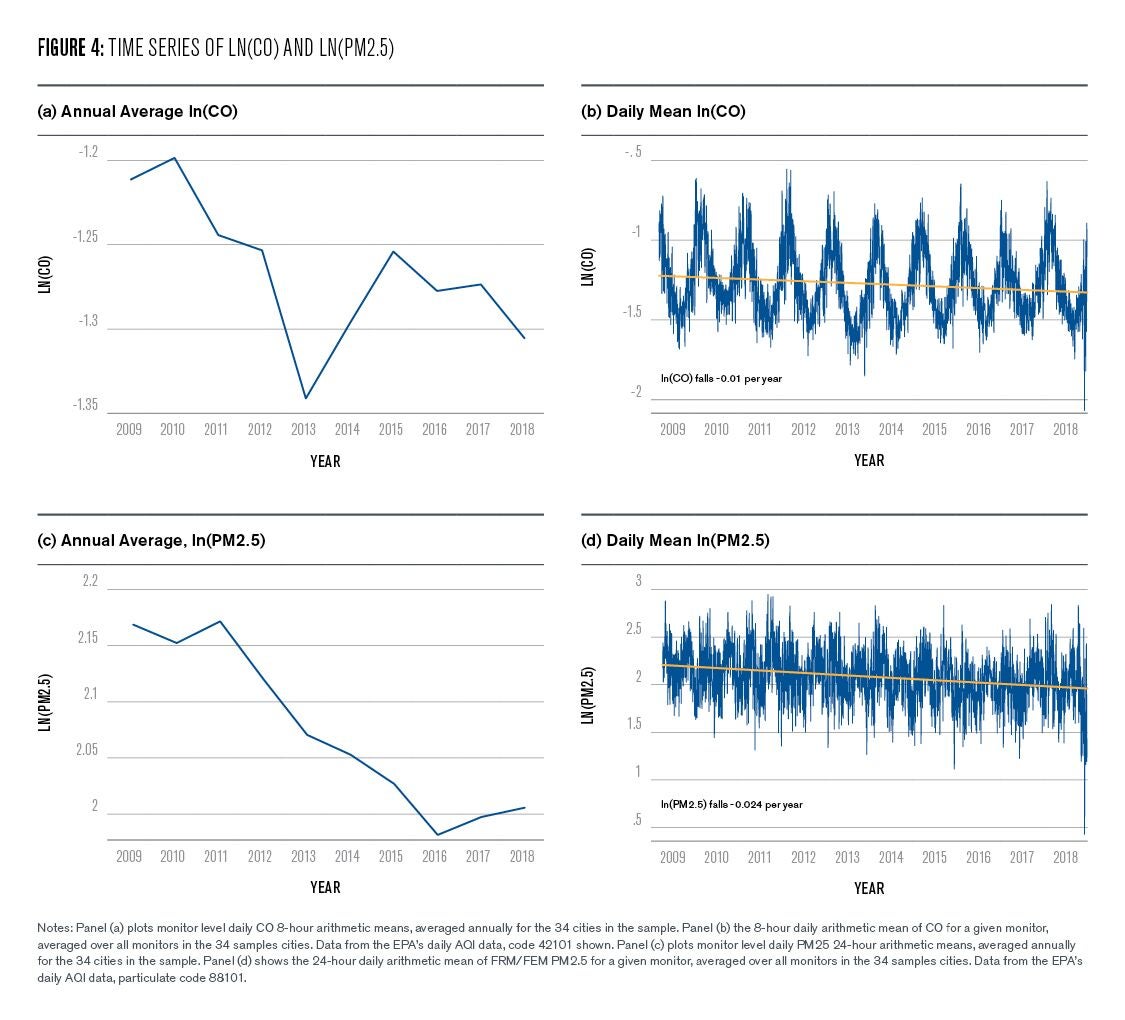
To track ridesharing’s impact on vehicle emissions, we can compare emissions of two types over time: CO, 48% of which comes from on-road vehicles; and fine particulate matter (PM2.5), only 2% of which comes from on-road vehicles, as summarized in Table 2—using national pollution data. The EPA provides data on daily CO and PM2.5 emissions in their Daily Air Quality Index data. Figure 4 shows the time series of the two emissions. Panels (a) and (c) show that the annual average of each emission is falling as environmental policies get more stringent and the types of cars we drive get cleaner and more fuel-efficient. Panel (b) and (d) show the high seasonality of the data, and that on average CO falls 1% per year, and PM2.5 falls 2.4% per year.
Comparing the time series in the sample of 34 U.S. cities before and after UberX enters, Figure 5 shows that after UberX enters, cities see a rise in CO, and the rise is statistically different from zero in all quarters but the most recent.11 After controlling for cities’ trend prior to Uber entry, national trends in pollution, the season, and a city indicator to control for unique city characteristics, we see a 9-11% increase in CO emissions, on average.
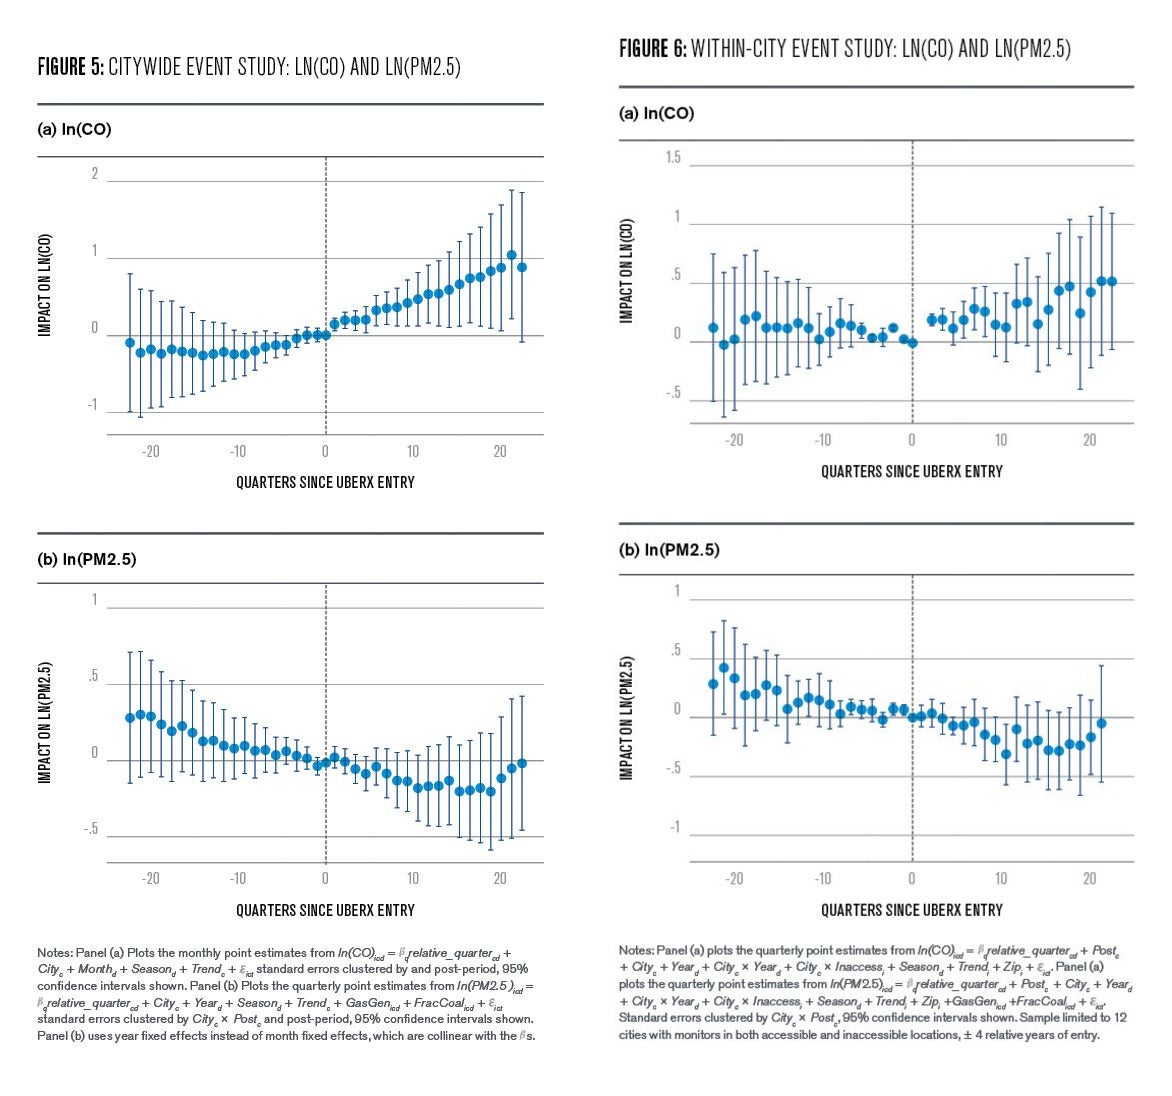
In panel (b), we see a trend much more in line with the raw national trends: cities continue to experience lower levels of PM2.5. These results show that vehicle-related emissions have risen after UberX entered cities by 9-11%, but other pollutants not tied to travel cannot be explained by UberX entry, building the case that UberX is causing higher emissions via more travel.
The NYC and restaurant results imply that we should see emissions increase not only as a whole in cities, but relatively more so in the outlying areas, since those areas have the biggest increase in travel. Because pollutants move around in the air, it is harder to distinguish air in restaurant inaccessible vs. restaurant accessible locations (RA and RI), introducing noise into the within—city analysis. Additionally, only 12 of the 34 cities in the sample have air quality monitors in both RI and RA zip codes, adding more noise
Nonetheless, Figure 6 shows broadly the same patterns at the city-level results: namely, in areas most impacted by UberX’s improvement in access, we see the highest increase in CO emissions, but not the placebo, PM2.5, emissions. Panel (a) in Figure 6 shows that RI locations have on average an 8% increase in CO emissions relative to their RA peers. The same cannot be said of PM2.5.
Takeaways and Policy Implications
UberX has benefited consumers by allowing them to easily travel to previously inaccessible locations. This has led to an increase in the diversity of locations in which we can enjoy amenities; however, the increase in travel mechanically increases vehicle emissions.
The key policy tension is how to balance the goal of reducing emissions from the increased number of trips by car, with the goal of promoting a vibrant and diverse set of amenities for urban consumers. In addition to flat congestion taxes or vehicle quotas, cities should consider location-specific policies. For example, New York City, which is currently planning on limiting trips into Manhattan via imposing a more than $10 congestion fee, could consider a separate vehicle-mile tax to internalize the emissions cost of long trips to hard-to-reach areas, especially as the outer boroughs have added many more ridesharing trips relative to Manhattan.
With the city environment expanding to new destinations in the age of ride-sharing, cities may be fighting a losing battle in trying to reign in vehicle miles traveled. Instead, cities could expand their green vehicle programs, which could be funded through administering a vehicle-miles-tax. For example, Philadelphia’s Electric Vehicle Policy Task force released a report in March, 2018 encouraging more public-private partnership in expanding curbside charging stations (Carroll 2018).
This research shows that expansion must happen outside of Center City, where most of the charging stations currently lie, to cater to the increased trip distance in the ride-sharing era. These policies support both increased travel demanded by consumers and reduced emissions by switching vehicle type.
Ride-sharing is an increasingly important component of urban transit, and cities should strive to make each new trip energy efficient without undoing the benefits from trip affordability and diversity in destinations.

Caitlin Gorback
Doctoral StudentCaitlin Gorback is a Ph.D. student in real estate in the Wharton School at the University of Pennsylvania.
Bialik, Carl, Reuben Fischer-Baum and Dhrumil Mehta. “Is Uber Making NYC Rush-Hour Traffic Worse?” FiveThirtyEight, December 9, 2015.
Bialik, Carl, Andrew Flowers, Reuben Fischer-Baum and Dhrumil Mehta. “Uber Is Serving New York’s Outer Boroughs More Than Taxis Are.” FiveThirtyEight, 10 August, 2015.
Carroll, Michael A. City of Philadelphia Electric Vehicle Policy Task Force Policy Recommendations. Office of Transportation and Infrastructure Systems. March 2018.
Fischer-Baum, Reuben and Carl Bialik. “Uber is Taking Millions Of Manhattan Rides Away From Taxis.” FiveThirtyEight, October 13, 2015.
Hall, Jonathan D., Craig Palsson, Joseph Price. “Is Uber a substitute or complement for public transit?” Journal of Urban Economics, 108 (2018): 36-50.
Hu, Winnie. “Uber, Surging Outside Manhattan, Tops Taxis in New York City.” The New York Times, October 12, 2017.
Hu, Winnie. “Your Taxi or Uber Ride in Manhattan Will Soon Cost More.” The New York Times, January 31, 2019.
Hu, Winnie. “Over $10 to Drive in Manhattan? What We Know About the Congestion Pricing Plan.” The New York Times, March 26, 2019.
Schaper, David. “Ride-Hailing Services Add to Traffic Congestion, Study Says.” NPR Morning Edition, August 1, 2018.
Shindell, Drew. “Understanding Carbon Monoxide as Pollutant and as Agent of Climate Change.” NASA Science Briefs, February 2007.
Silver, Nate and Reuben Fischer-Baum. “Public Transit Should Be Uber’S New Best Friend.” FiveThirtyEight, August 28, 2015.
World Health Organization. Health effects of transport-related air pollution. Edited by Michal Krzyzanowski et al. Copenhagen, Denmark: WHO Regional Office for Europe, 2005.
- In related work, the author has found no evidence yet of more people moving their residences downtown, or more people moving to the outskirts of cities. This suggests we use ridesharing mostly for trips other than daily commuting. [↩]
- Green cabs may not pick up passengers in Manhattan south of West 110th St and East 96th street. This ensures that cab drivers search for pickups outside of the more densely served regions of Manhattan, with the goal of increasing access to the other boroughs. [↩]
- The FOAI’d data contains Uber pickups from April to September 2014, and from January to June 2015. [↩]
- UberPool, available in select large US cities, allows Uber users to carpool with other users nearby, or on their route. Fares are lower, and this is offset by longer wait times and potentially longer routes optimized over multiple pickups and drop-offs. [↩]
- Green cabs may also pick up riders in Manhattan above East 96th street and West 110th street. [↩]
- Net creation is defined as the sum of new entries less the sum of closures; a positive value implies more restaurants exist relative to the previous year. [↩]
- The TLC data do not have latitude and longitude of pick-ups and drop-offs after 2016, limiting the ability to map trips to zip codes, the geographic unit used for studying restaurant and emissions outcomes. [↩]
- TLC began working with Way2Ride and Arro in late 2015 to send drivers to customers. [↩]
- The benefit of UberX entering different cities at different times is that any change in restaurant growth is pegged to the unique city entry date, rather than the national trend in restaurant growth, which could happen at the same time as UberX’s entry. [↩]
- In the case of bars, there are many in the data, but since people may visit more than one bar, they tend to co-locate, and dispersion is harder in groups. Usually, when visiting restaurants, we only eat one meal, allowing restaurants to move apart more easily. [↩]
- The 20th quarter has the fewest cities since not all cities have 20 quarters of data in the after-Uber sample. [↩]
