
As India urbanizes, its residential electricity use has increased 50 times between today and 1971, yet India’s per capita residential electricity consumption is less than a third of the world average.
A Country in Rapid Transition
India is poised at the edge of an energy transformation. This shift is shaped in large part by the country’s ongoing economic, social, and technological transitions. Indian cities will host an influx of 200 million more people by 2030. Most of these people will come from a low base of development, and will demand modern fuels, appliances, and vehicles for improved quality of life.
Demographically, at least 10 million people are expected to enter the Indian job market annually for the next two decades (India’s Half-A-Billion Jobs Conundrum 2017). In addition, two-thirds of India’s buildings that will exist in 2030 remain to be built (McKinsey Global Institute 2010). Managing these transitions is a significant challenge in itself, further complicated by the need to address their immense energy and climate implications.
This policy piece examines an important driver of India’s energy future—electricity demand in households—and argues for why a broader consideration of energy consumption is central to Indian energy and climate debates.
Focusing on Residential Use
There are two motivations for focusing on residential electricity use. The first is the sheer scale. Electricity use in Indian homes—lights, ceiling fans, televisions, refrigerators, among other appliances—has increased 50 times between today and 1971 (Khosla and Chunekar 2017), even though India’s per capita residential electricity consumption is less than a third of the world average (World Energy Council 2016).
Residential electricity now outpaces growth in industrial, commercial, and agriculture sectors (Central Statistics Office 2017). And India’s residences are predicted to account for 85 percent of the country’s floor space by 2050 (Global Buildings Performance Network 2014). The growth of the residential sector combined with increasing incomes and technological development will result in people buying more appliances and using more electricity to run them.
Already, households consume about 25 percent of the country’s total current electricity (Central Statistics Office 2017), even though less than a quarter of all households do not have an have an electricity connection (Saubhagya Dashboard 2018) and those that do face frequent power cuts. As India moves towards one of the largest urban transitions in history (United Nations 2014) in the coming decades, the population’s development needs, coupled with the government’s aim to provide uninterrupted electricity to all homes by 2019, is projected to increase electricity consumption five to six times between 2014 and 2030 (Khosla and Chunekar 2017).
The second motivation is that in spite of the scale of current and future residential electricity use, an understanding of household consumption patterns and their drivers is limited. There is scarce publicly available data on the issue and different studies, whether official government projections or international IEA estimates, predict dramatically different scenarios for the extent to which India’s residential electricity use will grow (Chunekar et al. 2016).
Variations also exist between the government’s own estimates, as seen by the difference in projections of India’s Central Electricity Authority’s 18th (2011) and 19th (2017) Electric Power Survey. This variation stems from differing methods, base-years, and assumptions—rooted in the lack of empirical data on how electricity is used across the country. Apart from the data from the decennial census and the five-yearly National Sample Survey Organization, which cover limited information on energy services, there is little publicly available data. This uncertainty in future demand estimates is a significant barrier to strategic energy and climate planning.
With this backdrop, this piece focuses on three questions:
- How much electricity does a resident consume who lives in the highest use area—the National Capital Region (NCR)–and how does this energy consumption compare with other regions?
- What are the electricity services driving this high consumption?
- How is the ownership of cooling appliances—a central driver of future electricity growth—changing as households are able to consume more energy?
Methodologically, the piece draws from the literature on current debates of India’s residential energy sector. It also draws empirically from a survey conducted in 2017 of 5,500 households that are representative of the NCR’s population, in the states of Delhi, much of Haryana, and parts of Uttar Pradesh and Rajasthan.
The NCR covers approximately 130 cities and towns, a land area of 22,500 square miles, and has a population of over 30 million that is growing at about 20 percent per decade. The survey was conducted in 2016 to 2017 by the Centre for the Advanced Study of India, at the University of Pennsylvania.
Comparing Residential Use
As a starting point, Figure 1 compares the per capita electricity use for a resident of the NCR, based on the survey, compared with recent per capita numbers from the literature for Delhi and India. It also shows estimates for the United States and China to demonstrate the different growth contexts of developed and developing countries.
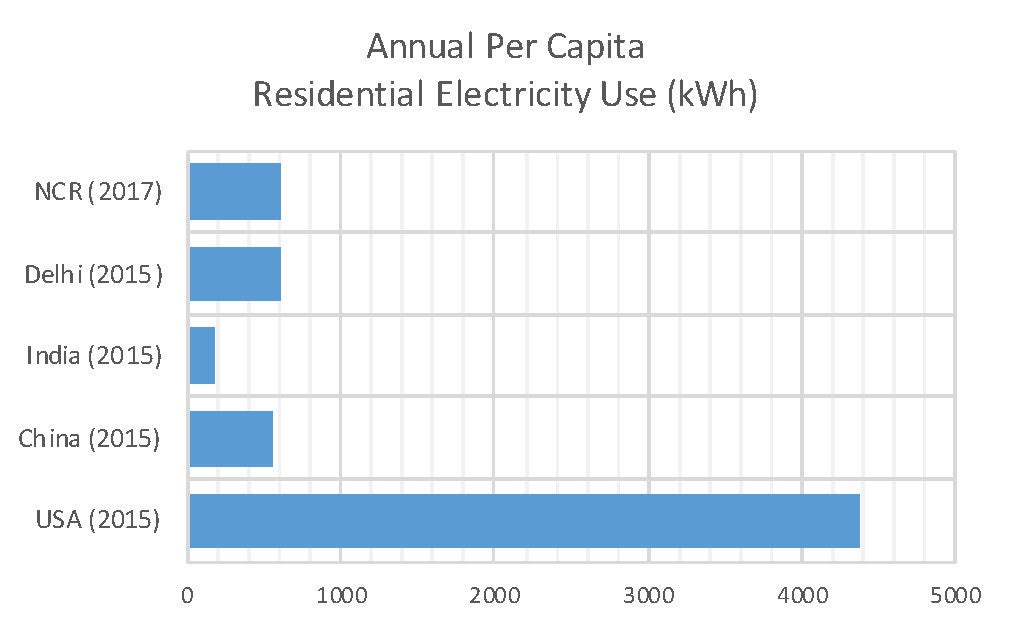
In per capita terms, U.S. residential electricity use is about 25 times that of India’s, and China’s is about three times that of India. Studies also indicate that the difference in per capita consumption between India and China has increased significantly between 2001 and 2013, implying that the increase in per capita consumption has been much more in China than in India (Chunekar et al. 2016). According to the literature, an electrified Indian household consumed about 90 kWh of electricity per month on average in 2014; enough to run four tube-lights, four ceiling fans, a television, a small refrigerator, and small kitchen appliances with typical usage hours and efficiency levels in India. This is three-fourths of the average monthly household consumption in China, a tenth of that in the USA, and a third of the world average (World Energy Council 2016).
Within India, the variation is analogously large. In purely electricity terms, the NCR resident is the highest consuming in the country—a level that is continuing to rise. Based on the NCR survey, the residential electricity use per person is broadly consistent with the statistics on Delhi from other sources, suggesting that Delhi is the driver of the NCR’s energy use. An electrified household in Delhi consumes about 250-270 kWh of electricity on average, approximately the same average amount consumed by an electrified household in Germany (World Energy Council 2016). At the same time, such an electrified household in Delhi consumes significantly more than other Indian cities—Chandigarh: 208 units; Ahmedabad: 160 units; Puducherry: 150 units; and Mumbai: 110 units (Chunekar et al. 2016). The India average, on the other hand, is 3.5 times lower than the NCR number. As incomes rise across India’s other urban areas, it is likely that energy consumption will rise, too—following patterns in the NCR.
Drivers of Household Consumption
To understand the NCR’s high energy use, we break from the conventional emphasis on energy supplies and instead examine how energy is consumed. Such a narrative break was originally promoted in the mid-1980s in the work of Amulya Reddy, who moved the conventional emphasis on “energy sources” to that of “energy services.” From this perspective, the objective of the energy system—and its supply and utilization activities—is to provide energy services such as lighting, comfortable indoor temperatures, refrigeration, etc. to achieve development outcomes.
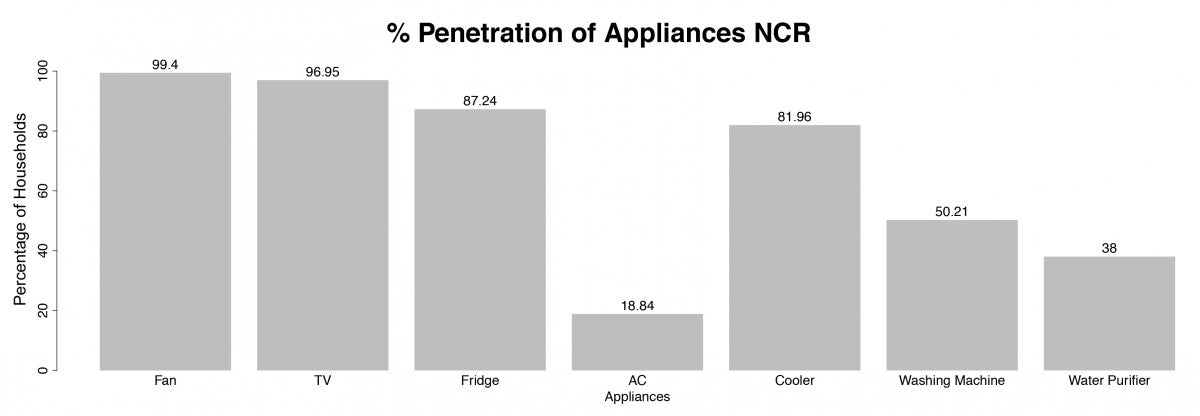
Exploring this end-use rationale, Figure 2 shows that almost every house in the NCR has a fan, closely followed by a TV. TVs are more ubiquitous than air coolers and fridges, in spite of the hot and dry climate and peak summer temperatures of the region. This result aligns with the literature that shows that over the past few decades, TV viewing has become the most important leisure and entertainment activity for middle class families (Wilhite 2008).
Washing machines and water purifiers account for the next set of appliances. Unlike the other appliances on the list, these provide services that potentially replace human labour needed for washing clothes and boiling water. And while not represented here, the data also shows that 63 percent of households in the NCR have a scooter while a smaller 17 percent have a car.
It is useful to contextualize the numbers in Figure 2 with other datasets, specifically from the Census of India and the National Sample Survey, with the latest data available for 2011. While the methodologies of the surveys are different, the comparisons interestingly signal that in the five-year period between the national database (2011) and the NCR survey (2016 to 2017), there has been a dramatic increase in the ownership of air conditioners (ACs). Further, other appliances such as the TV, fridge, and washing machine have a penetration rate that has grown at least 10 percent more compared with the 2011 database.
The implications of such increasing appliance ownership levels, as households transition towards higher levels of income, is potentially most relevant in the case of cooling appliances. Of these, air conditioners are salient because of their energy-intensive nature and their increasing demand in India’s hot and tropical conditions. Market studies predict that India is at the cusp of an exponential growth in the AC market (Shah et al. 2016). The impact of this AC penetration will be two-fold: Access to cooler indoor environments as the probability of extreme temperatures rises; but also, a marked increase in household electricity use and higher bills.
Changing Nature of Cooling Appliance Ownership
In order to examine the changing nature of cooling appliance ownership, Figure 3 uses an asset index, which maps appliance ownership with a household’s overall assets or ability to consume. Figure 3 illustrates the changing nature of cooling appliance ownership. In order to do so, we construct an amenities asset index for households. As the NCR Survey collected information on a large number of amenities with which can be difficult to summarize, we construct a single index of economic well-being from the amenities.
The method entails a two-parameter item response model estimated from the data, which minimizes researcher discretion and provides an intuitive, statistically-robust method of calculating indices of economic well-being. Specifically, the amenity index was created by tracking whether the household owned up to fifteen amenities, such as, the air conditioner, desktop and laptop computer, WiFi internet connection, landline phone, two wheeler (motorcycle/scooter), water purifier, microwave, DVD player, smartphone, car, refrigerator, and washing machine.
Figure 3 shows the ownership of at least one cooling device per household, ranging from a fan, cooler, and air conditioner, as per the asset index. As seen in Figure 3, almost every home in the NCR, irrespective of where it ranks on the asset index, owns a fan. The most prevalent cooling device, after a fan, is cooler, which households start acquiring as they enter the fourth decile. By contrast, only the top decile, at most, have an air conditioner—even in the highest consuming region of the country.
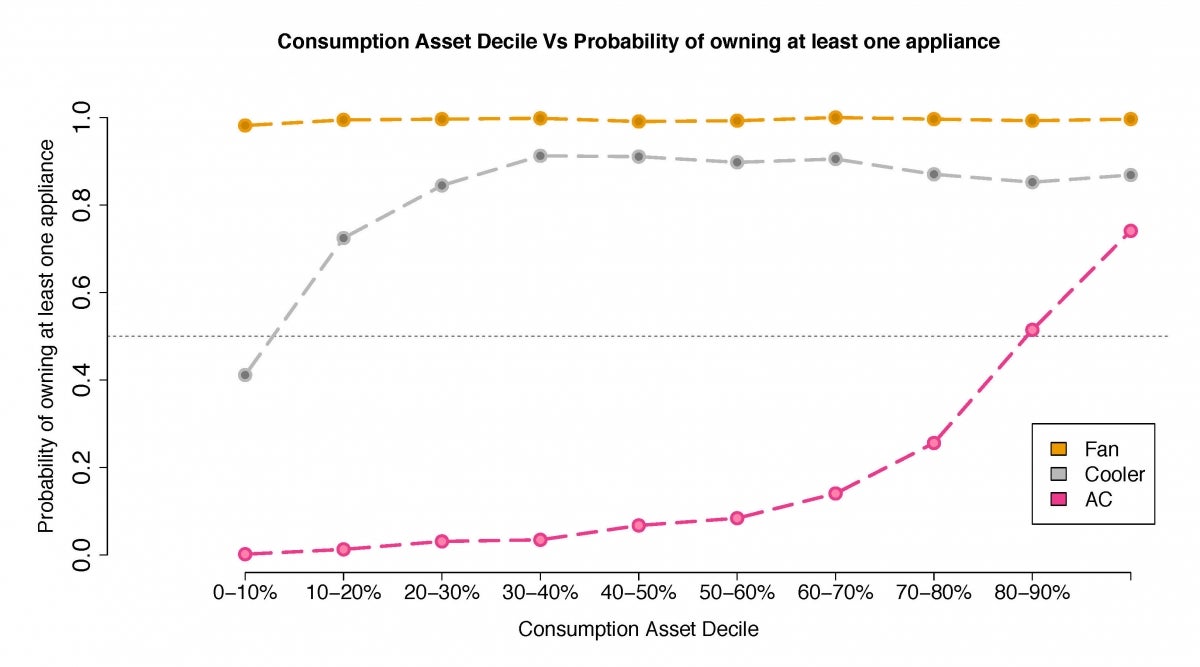
The implications of these cooling appliance ownership patterns are significant for determining the trajectory of energy use in the NCR, and by analogy other Indian cities. As income levels rise, the AC curve will increasingly mirror the current cooler curve. Furthermore, because the AC load (~1500 W) is an order of magnitude higher than that of a fan (~75 W) or cooler (~200 W), the systemic effects of the resulting increased electricity demand and greenhouse gas emissions from AC use are predicted to be dramatic (Shah et al. 2016).
Notably, the yet-to-be-bought cooling appliances, perhaps counterintuitively, offer a potential advantage in India. The reason being that long-term decisions about the types of energy consuming devices to invest in have not yet been made by Indian consumers. Similarly, the building infrastructures corresponding to these devices, along with the supporting networks of transport and streets which are some of the longest lasting structural components of the economy, are yet to take form. These infrastructures, in turn, lead to patterns of energy consumption on the order of similarly long timescales.
These lasting infrastructures and technologies, with analogous institutional structures and resulting behavioral norms, are collectively referred to as lock-in. Because buildings and urban spaces provide a physical setting for shaping preferences and practices, lock-in effects are not easily reversed. More so, once large capital investments are made, the cost of switching to new infrastructure can be prohibitively high. Thereby, if end-use technologies with poor energy performance become the standard in yet-to-exist infrastructures and lifestyles, these can lead to a series of path-dependent outcomes, which will make it difficult to reduce consumption for decades to come.
Therefore, the window of opportunity is now. Current government policies can incentivize households to choose energy efficient appliances (especially air conditioners) and form consumption patterns that increase quality of life without spiking the electricity bill. Through such an approach, the cooling energy requirements of long-term programs, such as building 20 million affordable housing units by 2022, can be reduced considerably (National Mission for Urban Housing 2015). The usefulness of these opportunities, however, will depend on the early decisions that policymakers, industry leaders, and household members make.
Sustainability Through End Use
Reshaping urban trajectories, to overcome existing, and often economically favorable, energy-intensive infrastructures is not trivial. It is often associated with unfamiliarity and unknown financial and political risks. To do so requires an institutional structure that focuses on the end use of energy and on the interactions between energy demand and supply.
In addition to preventing lock-in, demand-side energy planning also: (1) makes managing energy supply easier; (2) reduces the amount of supplies needed; and (3) decreases carbon emissions released.
In fact, end-use sectors such as buildings, transport, and industry can form the bulk of reduction in emissions intensity, 23 to 25 percent from 2005 levels by 2020 (Planning Commission 2011). These could also make a marked contribution to India’s Paris pledge, such as the goal to increase the share of non-fossil fuel based electricity to 40 percent of total capacity by 2030 (Government of India 2015). India must plan for non-fossil based energy sources to achieve this target. But the magnitude of supply in any plan will depend on the size of the grid in 2030, which is ultimately a function of future demand.
There isn’t yet a rigorous forecast of India’s future grid size, and study projections range anywhere between 650 to 1000 gigawatts (Dubash et al. 2017), which could lead to a very different set of supply requirements at either end. Inaccurate demand estimates could thereby risk energy security or result in a series of stranded assets—both issues of concern.
Finally, the traditional supply-dominated orientation has simply not been enough to fix the pathologies of Indian energy. The sector still suffers from inefficiencies and financial losses of electricity distribution companies in spite of increasing electricity production and a slew of policy targets. Lack of energy access remains an overarching characteristic: more than 400 million people have no access to electricity (according to the 2011 Census) and there are challenges of electricity reliability even when there is supply.
Further, at present, India’s power sector is in a unique paradox of energy surplus at the production plants and unmet demand at the consumer end—which stems from a systematic failure in understanding and planning for electricity demand (Josey et al. 2017). Instead of responding to these complexities with the lens of a supply-side crisis, policies could use the demand-side as a way to understand how much supply is actually needed—by whom and when—thereby managing power in a more effective way.
Recent efforts take steps in this direction, particularly through the Bureau of Energy Efficiency’s policies in end-use areas such as promoting LED lighting. These efforts could, however, be taken forward beyond their current sectoral silos by paying attention to the larger structural changes underway in India that will determine patterns of energy use in the long term.
New efforts would also, ideally, account for the synergies with sustainable development, especially as end-use transitions involve daily practices and technologies and have direct implications on quality of life. For instance, shifting user preference from biomass based cooking to liquefied petroleum gas (LPG) has shown positive impacts on health while reducing women’s workloads, resulting in an improved standard of living (Barnes and Sen 2004). In this way, policymakers in India can help deliver on their multiple development priorities, including energy access, jobs, health, and climate change.
Such a shift in imagination will not be easy or automatic—especially because demand-side solutions are often embedded in a complex network of social institutions and practices. Yet, the time is ripe to revisit and recover the demand-side perspective on India’s energy transition as a necessary complement to supply-side efforts.
Because India has a relatively small window of opportunity to lock in sustainable infrastructures, there is much to gain from policies and behaviour changes that can shape currently malleable future demand patterns. If unaddressed, this future demand will put serious constraints on already stretched national resources, posing social, local environmental, and climate change related burdens. But if considered strategically, the increased demand could be an opportunity through which a sustainable development pathway for India can eventually be created.
The author wishes to acknowledge the helpful comments of Dr. James R. Hines. Any remaining errors are the responsibility of the author alone.

Radhika Khosla
Research Director, Oxford India CentreRadhika Khosla is the research director at the Oxford India Centre for Sustainable Development. In 2017-2018 she was a visiting scholar at the Kleinman Center.
Barnes, Douglas, and Mitali Sen. 2004. “The Impact of Energy on Women’s Lives in Rural India.” Washington D.C: Joint UNDP/World Bank Energy Sector Management Assistance Programme (ESMAP). https://www.esmap.org/sites/default/files/esmap-files/The%20Impact%20of%20Energy%20on%20Women%27s%20Lives%20in%20Rural%20India.pdf
Central Statistics Office. 2017. “Energy Statistics 2017.” Ministry of Statistics & Programme Implementation, Government of India. http://www.mospi.nic.in/sites/default/files/publication_reports/Energy_Statistics_2017r.pdf
Chunekar, Aditya, Santanu Dixit, and Sapekshya Varshney. 2016. “Residential Electricity Consumption in India: What Do We Know?” Pune: Prayas (Energy Group). http://www.prayaspune.org/peg/component/k2/item/download/709_95c95aa4a9ad64d4f944fc8dcd78000c.html
Dubash, Navroz K., Radhika Khosla, Narasimha D. Rao, and Ankit Bhardwaj. 2017. “India’s Energy and Emissions Future: A Synthesis of Recent Scenarios.”
Global Buildings Performance Network (GBPN). 2014. “Residential Buildings in India: Energy Use Projections and Savings Potentials.” Ahmedabad: Global Buildings Performance Network (GBPN) and Centre for Environmental Planning and Technology (CEPT) University. http://www.gbpn.org/sites/default/files/08.%20INDIA%20Baseline_TR_low.pdf
Government of India. 2015. “India’s Intended Nationally Determined Contribution: Working Towards Climate Justice.” Government of India.
Housing for All by 2022 Mission – National Mission for Urban Housing. 2015. June 2015.
http://pib.nic.in/newsite/PrintRelease.aspx?relid=122576
India’s Half-A-Billion Jobs Conundrum. 2017. December 2017. http://www.newindianexpress.com/nation/2017/dec/31/indias-half-a-billion-jobs-conundrum-1741132.html
Josey, Ann, Manabika Mandal, and Shantanu Dixit. 2017. “The Price of Plenty: Insights from ‘Surplus’ Power in Indian States.” New Delhi: Prayas (Energy Group).
Khosla, Radhika, and Aditya Chunekar. 2017. “Plugging In-Residential Electricity in India.” Centre for Policy Research and Prayas (Energy Group).
McKinsey Global Institute. 2010. “India’s Urban Awakening.” Mumbai: McKinsey & Company. https://www.mckinsey.com/~/media/McKinsey/Global%20Themes/Urbanization/Urban%20awakening%20in%20India/MGI_Indias_urban_awakening_full_report.ashx
Planning Commission. 2011. “Interim Report of the Expert Group on Low Carbon Strategies for Inclusive Growth.” New Delhi: Planning Commission, Government of India. http://www.moef.nic.in/downloads/public-information/Interim%20Report%20of%20the%20Expert%20Group.pdf
Saubhagya Dashboard. 2018. 2018. http://saubhagya.gov.in/dashboard
Shah, Nihar, Amol Phadke, Nikit Abhyankar, Won Young Park, Saurabh Diddi, Deepanshu Ahuja, P. K. Mukherjee, and Archana Walia. 2016. “Cost-Benefit of Improving the Efficiency of Room Air Conditioners (Inverter and Fixed Speed) in India.” California: Lawrence Berkeley National Lab. (LBNL), Berkeley, CA (United States).
United Nations, Department of Economic and Social Affairs, and Population Division. 2014. World Urbanization Prospects: The 2014 Revision.
Wilhite, Harold. 2008. Consumption and the Transformation of Everyday Life: A View from South India.
World Energy Council. 2016. May 2016. https://wec-indicators.enerdata.net/household-electricity-use.html
