Bye-Bye Bus: Ride-Hail in Philadelphia

This study finds that consumers are more inclined to use ride-hail over public transport and seem unaware of or unconcerned about the environmental impact.
Introduction
Using statistical and survey analyses, this study finds that Uber and Lyft, the two biggest ride-hail service providers in the Philadelphia region, have reduced public transportation usage and have potentially increased gasoline consumption and greenhouse gas emissions.
Ride-hail services such as Uber and Lyft have become increasingly popular in the United States. As of 2019, Uber, the biggest ride-hail company in the world, operates in nearly 300 cities in the United States (Uber n.d.-b). Between 2015 and 2017, Lyft’s ridership increased 120 percent, from 163 million to 376 million in the U.S. and Toronto (Carson 2018). However, due to their recent market entry and lack of publicly available trip data, the body of literature regarding their impact on the transport system, public transit in particular, is still relatively small.
Studies from different regions in the U.S. reveal inconsistent findings regarding ride-hail’s impact on transit ridership and travel behavior. For example, ride-hail companies and some transit agencies report that these services can complement public transportation by providing a viable first and last mile connection to transit stations (Feigon & Murphy 2016; Uber n.d.-a). However, survey studies in Boston and New York City do not support this claim (Metropolitan Area Planning Council 2018; NYC Department of Transportation 2018).
In New York City, for example, less than 1% of residents use ride-hail to connect to or from transit (NYC Department of Transportation 2018). In the same study, 50% of ride-hail users indicate that these services replaced trips previously made by transit (NYC Department of Transportation 2018).The uncertainties surrounding ride-hail pose a challenge to understanding the transport, and subsequently the environmental and energy impact of these services.
Since UberX, Uber’s affordable ride-hail service, and Lyft’s respective launches in Philadelphia in late 2014 and early 2015, the two companies have experienced exponential growth in the city. In 2015, the number of active drivers for Uber increased from less than 3,000 to more than 10,000 (Hall, Palsson, & Price 2018). Between 2016 and 2018, Uber and Lyft saw their trips originating in Philadlephia increase by 13 million (Laughlin 2018). As of 2018, an estimated 25,000 ride-hail vehicles were operating in the Philadelphia area (Laughlin 2018).
Meanwhile, ridership on public transportation has experienced declines to various extents for several major transit modes operated by the Southeastern Pennsylvania Transportation Authority (SEPTA), the transit service provider for the Philadelphia region. Despite ride-hail’s rapid growth and its potential impact on transit in Philadelphia and its surrounding suburbs, the region has received little attention in academic research on ride-hail. This study aims to fill this research gap by analyzing ride-hail’s impact on transit ridership, as well as its implications on energy consumption and greenhouse gas emissions. Findings from the current study will help inform planners and policy makers when facilitating the growth of ride-hail in the nation’s fifth largest city and its surrounding region.
Research Design
With the support from the Kleinman Center for Energy Policy, we conducted an online survey between March and April 2019 of ride-hail users in the Philadelphia area. Our goal was to gather information about their demographics, the purpose of their trip, and the impact of ride-hail on their travel behavior. Responses from this survey allow us to explore the energy and environmental impacts that stem from the ride-hail market.
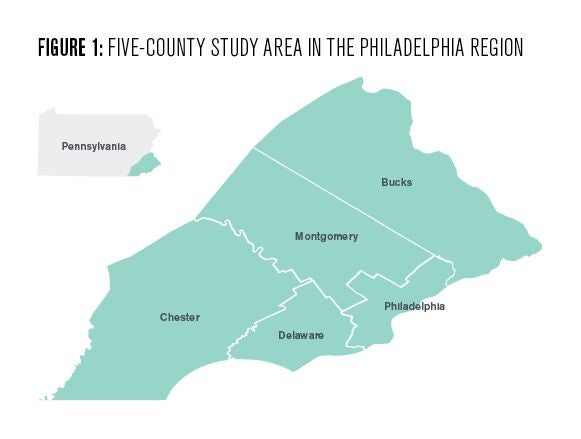
The study encompasses a five-county region in Pennsylvania, including Bucks, Chester, Delaware, Montgomery, and Philadelphia counties (Figure 1). The 2,200 square-mile region has a population of more than 4 million residents. Philadelphia County, coterminous with the City of Philadelphia, is the population and employment center of the study region. The sample for the survey includes 610 ride-hail users above the age 18 who live in the study area. The survey company Qualtrics recruited the respondents and distributed the survey.
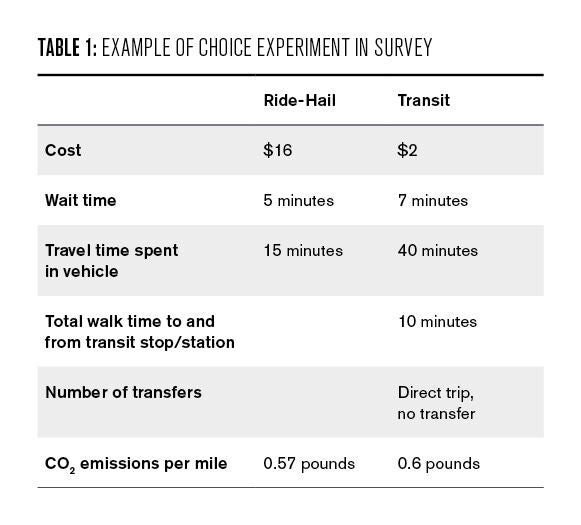
In addition to gathering user and trip information, we also asked each respondent to choose their preferred mode of travel between ride-hail and transit in 12 choice experiments with different combinations of monetary cost, trip time, number of transfers, and greenhouse gas emissions. In each experiment, we asked the respondents to imagine a scenario where they need to make a trip to return home, and the only options available are ride-hail and public transit. Table 1 provides an example of a choice experiment presented to the respondents. CO2 emissions represent the average amount, in pounds, of carbon dioxide emitted from each mode for each passenger per mile of travel. These values measure the average amount of emission and may not necessarily represent the marginal increase in emissions for each additional passenger. Attributes in the choice experiments were calculated based on the 2017 National Household Travel Survey, and data from the Federal Transit Administration, the Philadelphia Parking Authority, etc.
We summarize and cross-tabulate survey responses. Additionally, we use logistic regression to analyze the effect of users’ socio-economic characteristics, trip cost, travel time, and environmental awareness on mode choice between transit and ride-hail.
Demographic Data
Table 2 shows the comparison of the socio-demographic characteristics between the survey sample and the U.S. Census Bureau’s 2017 five-year American Community Survey for the study area. Our survey oversamples females and residents with college degrees or higher, and under-samples residents whose highest education attainment is high school or less (due to the respondents available). The other aspects of the user characteristics are proportional to those for the region as a whole. The number of respondents from each county is roughly proportional to the county’s resident population relative to the region. Additionally, 78% of sample respondents have a driver’s license and more than 80% live in households that own at least one car.

Survey Findings
Mode Choice
Across the choice experiments, respondents chose ride-hail and transit 58% and 42% of the time, respectively. The mode choice exhibits geographic patterns. Respondents living in Philadelphia chose ride-hail 53% and transit 47% of the time. Respondents living in the surrounding suburban counties exhibit a higher inclination toward ride-hail, choosing it 62% of the time, compared to 38% for transit. It should be noted that suburban respondents have a significantly higher average household income than urban respondents and might be less financially constrained when making mode choice decisions. Additionally, infrequent (less than five times a week) transit riders tend to choose transit (39% of the time) less than more frequent (more than five times a week) transit riders (56% of the time). This finding appears to indicate that people who prefer or are more familiar with transit are more inclined to choose transit over ride-hail in the choice experiments.
Trip Making
Figure 2 presents a summary of the survey responses on trip making decisions after adopting ride-hail. Overall, the majority of respondents indicated that adopting ride-hail did not change the number of trips they take. This is especially the case for work or school commute trips, where only 30% of respondents have taken more or fewer trips since adopting ride-hail. In contrast, 38% of respondents have taken more trips for recreational or social events and 26% have taken more shopping or errand trips since adopting ride-hail.

Figure 3 presents the change in usage by mode by percentage of respondents after adopting ride-hail. The majority of respondents indicated that they did not change their current transit usage after adopting ride-hail. Approximately 18% of the respondents have used transit more and 24% have used it less for recreation and errand trips.
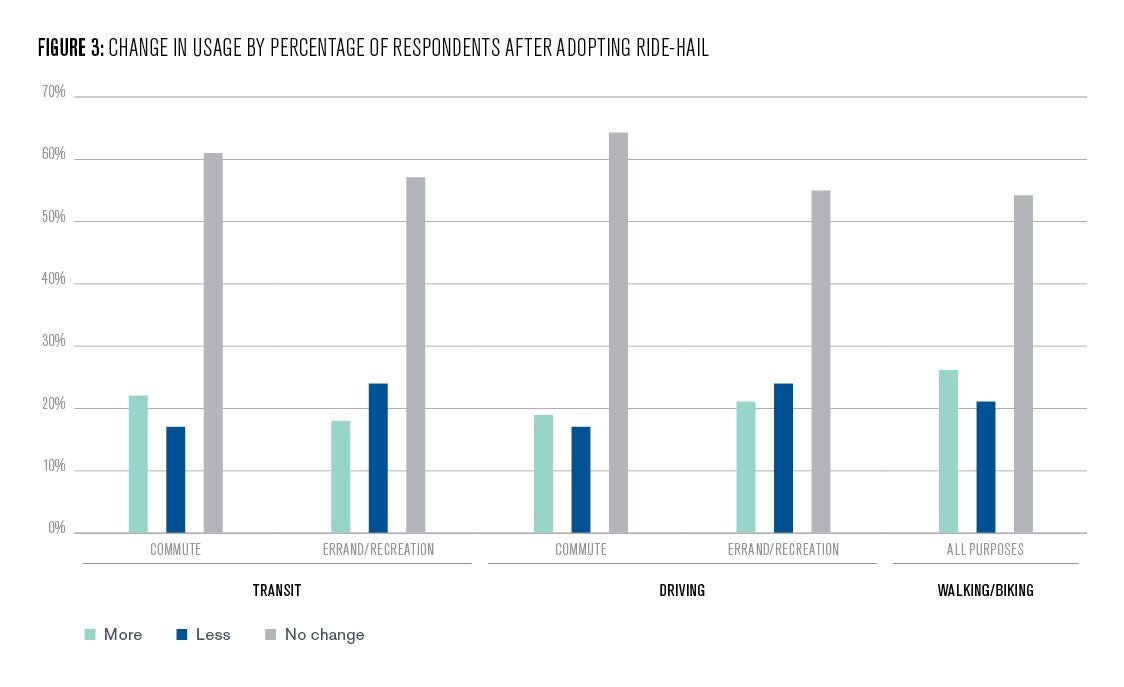
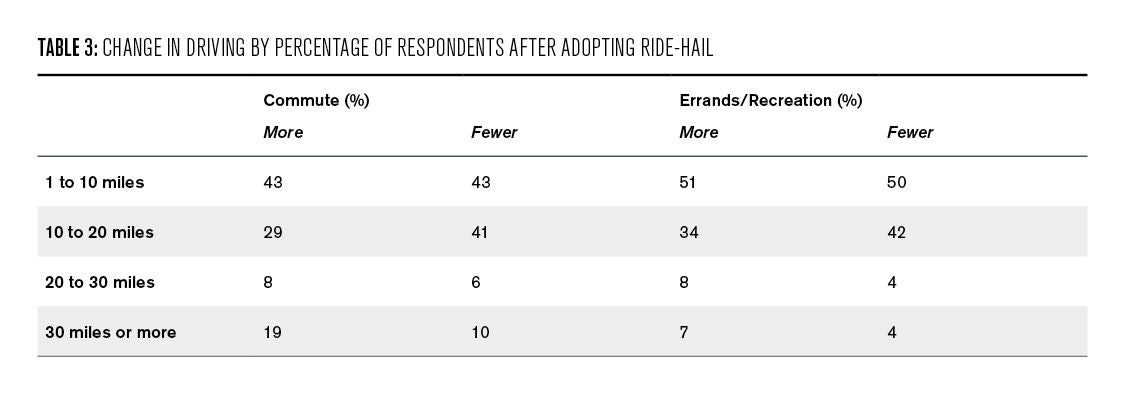
Nearly one-third of the respondents did not change the amount of driving for school and work commute after adopting ride-hail. Only 17% indicated that they have driven less for commute since adopting ride-hail. In contrast, roughly 24% suggested that they have driven less for errand and recreation trips since they started using ride-hail. As shown in Table 3, among those who have driven less for recreation and errand trips, 92% have driven an average 1 to 20 fewer miles per week. Roughly 85% have driven 1 to 20 more miles for recreation and errand trips among respondents who have driven more since they started using ride-hail. For school and work commute, 84% have driven 1 to 20 fewer miles whereas 72% have driven 1 to 20 miles more since adopting ride-hail.
Lastly, results suggest a mode shift from transit and driving to ride-hail. Nearly 27% of the respondents indicated that they would have taken transit to complete their last ride-hail trip had ride-hail services not been available. Similarly, a quarter of the respondents would have driven alone to complete the trip if ride-hail had not been available. Additionally, 16% of the respondents suggested that they would not have made the trip at all if ride-hail had not been available, providing further proof of increased trip making after adopting ride-hail.
It should be noted that responses from questions that ask for the respondents’ change in travel behavior after adopting ride-hail might not indicate causality. In other words, while ride-hail use might have been associated with the respondents’ changing travel behavior, it might not have caused these changes.
Environmental Concerns
Responses suggest that environmental concerns might not have been a crucial factor for most respondents when choosing mode of travel. When asked to rank the most important factors in making mode choice decisions, most respondents selected cost, reliability, and trip time. In contrast, less than 3% of respondents chose environmental impact as one of their top concerns when making mode choice decisions for commute, recreation, and errand trips. Meanwhile, nearly 60% of respondents either were not aware of or did not care about the difference in the environmental impact between ride-hail and transit. Respondents who were unaware of or did not care about the difference in the environmental impact between the two modes chose ride-hail 20% more times than they chose transit. Among respondents who considered transit a more environment-friendly travel mode, transit was chosen as frequently as was ride-hail.
While on average public transit in Philadelphia is a greener option than ride-hail, this might not be the case for all transit trips. A transit bus with only a few passengers on board would certainly consume more gasoline and emit more greenhouse gases per passenger mile than a car.
Results from the preliminary statistical models confirm the limited role environmental concerns play in making travel mode choices. Model output shows that the relationship between CO2 emission profiles of the two modes and mode choice are not significantly associated. In contrast, monetary cost, travel time, and the number of transfers on public transit have a more significant impact on respondents’ mode choice than environmental concerns. This finding suggests that while educational campaign might help to raise the environmental awareness of travel, monetary measures and transit service improvements will likely be more effective in influencing people’s mode choice.
Key Takeaways
Findings from the survey analyses reveal three key takeaways.
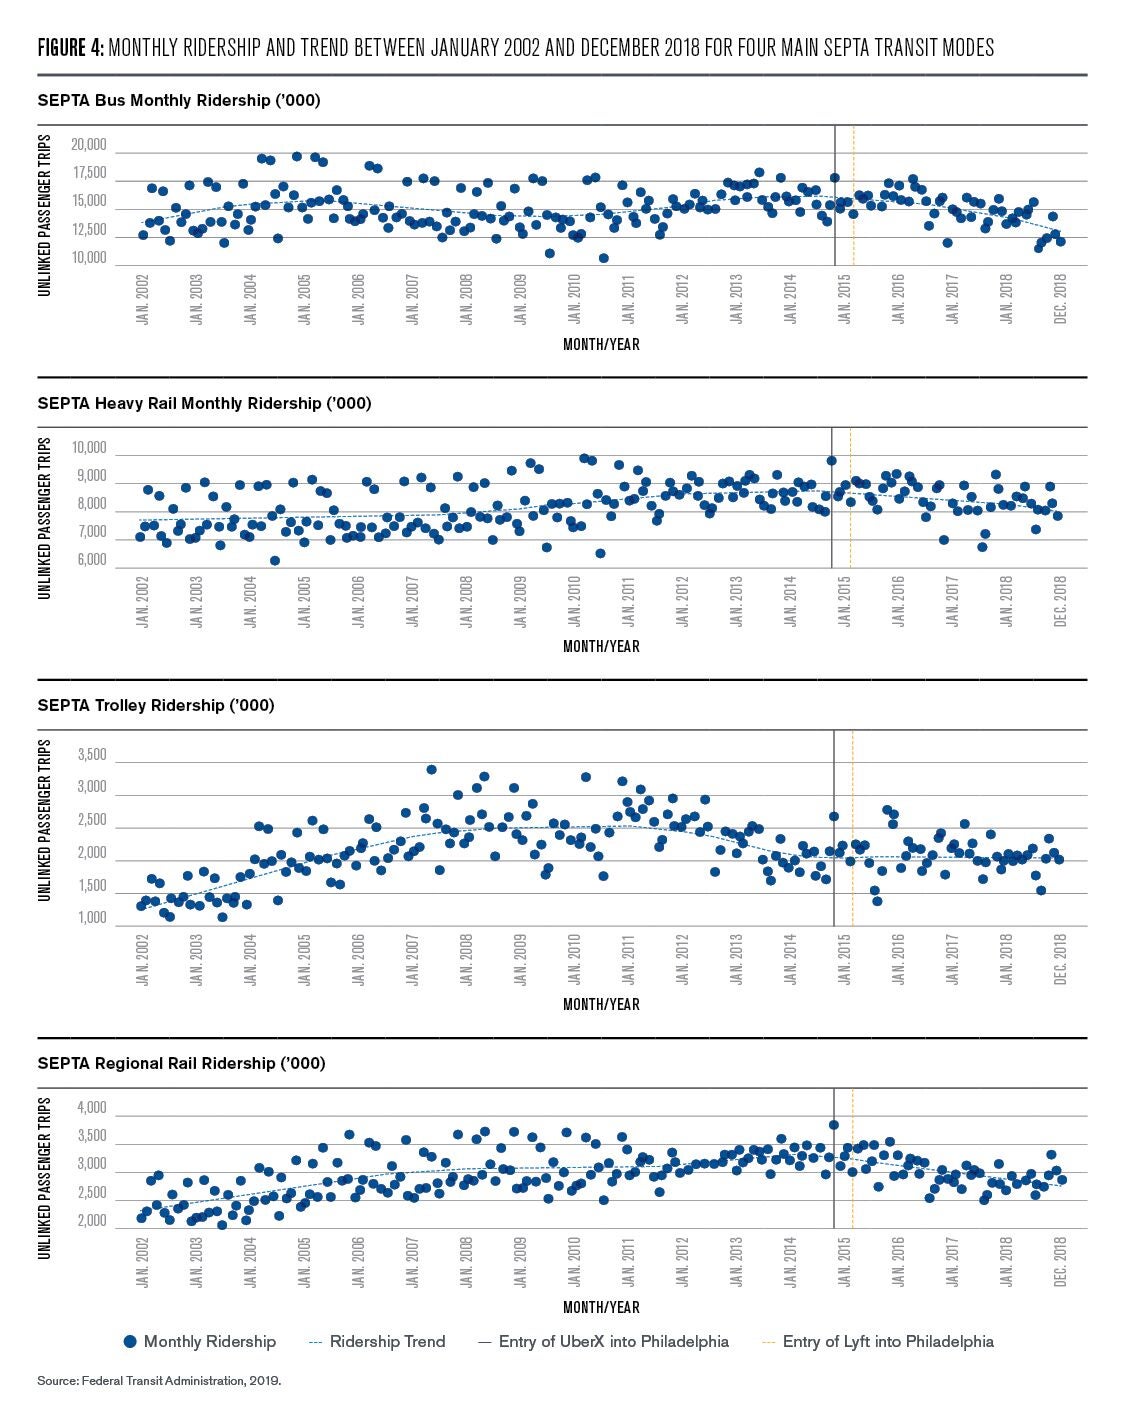
Ride-hail has contributed to the declining transit ridership in the study area. Figure 4 shows the monthly ridership trend before and after the launches of UberX and Lyft in Philadelphia for each of the four main transit services provided by SEPTA. With the exception of the trolley, all public transportation modes experienced declines to various degrees since the launch of ride-hail. While ridership continues to exhibit fluctuation after the market entry of ride-hail services, the overall ridership has been at its lowest since the Great Recession.
Additionally, although a higher percentage of respondents indicated that they have used transit more for commute trips since adopting ride-hail, more respondents suggested that they have used transit less for recreation and errand trips. Moreover, a quarter of the respondents indicated that they would have made their last ride-hail trip by transit had ride-hail services not been available, suggesting a mode shift from transit to ride-hail. While macro-economic factors such as low gasoline price might also have contributed to the decreasing ridership, survey results suggest that services such as Uber and Lyft played a role in diverting transit trips to ride-hail
On average, public transit in the study area consumes less energy and emits fewer greenhouse gases than single occupancy vehicles on a per passenger mile basis, as shown in Table 4. This is especially the case for rail transit, whose per passenger mile energy intensities (measured in BTU) are only a quarter of those for cars (not including light trucks). The energy intensities for transit buses operated by SEPTA are well-below the national average and almost on par with cars based on the current ridership level (calculated by author) (Federal Transit Administration 2019; SEPTA, 2018; Stacy C. Davis & Robert G. Boundy 2019).
In terms of emission profile, all four of SEPTA’s main transit modes have lower greenhouse gas emissions than cars (SEPTA 2019). The emissions from single occupancy vehicles are even higher than SEPTA buses, which emit 0.63 pounds of CO2 per passenger mile (SEPTA 2019).
While ride-hail vehicles may transport more than one passenger on each ride, the per passenger mile energy and emission reductions gained by sharing the ride could be offset by the mileage driven while cruising for customers between rides.
In fact, a recent study suggests that UberX drivers have a passenger onboard about half the time that they have their phone app turned on (Cramer & Krueger 2016). Meanwhile, the fuel efficiency and emission profile of SEPTA buses will likely continue to improve, thanks to the agency’s efforts to upgrade its fleet with hybrid buses. Diversion of passengers from transit to ride-hail compromises public transportation’s environmental advantage as lower ridership begets higher per passenger mile energy consumption and greenhouse gas emissions.

Residents have taken more trips since adopting ride-hail. Approximately 16% of respondents would not have made their last ride-hail trip at all if ride-hail had not been an option. Additionally, a greater percentage of respondents indicated that they have taken more recreation and errand trips than those who have reduced the number of such trips since adopting ride-hail.
Given the fact that the majority of respondents did not change the number of walking and biking trips, it is likely that a large proportion of the additional trips were completed on non-active transport modes such as driving. A greater number of motorized trips intensifies the environmental impact of travel.
There is a lack of awareness of the environmental impact of ride-hail and transit. According to the survey, the majority of respondents either were not aware of or simply did not consider the environmental impact of when making their travel decisions. Furthermore, emission profiles of the two modes are not a significant factor for respondents when making mode choice decisions.
In contrast, monetary cost of travel plays a significant role in the respondents’ mode choice. This factor indicates that monetary measures may be necessary for the cost of ride-hail to reflect its environmental externalities. Additionally, it highlights the importance of strategies such as lowering transit fare and adjust service to shorten trip time in making transit more competitive against ride-hail.
Acknowledgements
The author would like to acknowledge Professors Erick Guerra and Ricardo Daziano for their generous input in the survey design and analysis. Additionally, Professor James Hines at the University of Michigan Law School provided insightful review for the article.

Xiaoxia “Summer” Dong
Doctotal StudentXiaoxia “Summer” Dong is a Ph.D. student in city and regional planning in the Stuart Weitzman School of Design at the University of Pennsylvania.
Carson, B. (2018, January 16). Lyft Doubled Rides In 2017 As Its Rival Uber Stumbled. Retrieved May 6, 2019, from Forbes website: https://www.forbes.com/sites/bizcarson/2018/01/16/lyft-doubled-rides-in-…
Cramer, J., & Krueger, A. B. (2016). Disruptive Change in the Taxi Business: The Case of Uber (Working Paper No. 22083). https://doi.org/10.3386/w22083
Federal Transit Administration. (2019). Monthly Module Adjusted Data Release [Text]. Retrieved May 10, 2019, from Federal Transit Administration website: https://www.transit.dot.gov/ntd/ntd-data
Feigon, S., & Murphy, C. (2016). Shared Mobility and the Transformation of Public Transit. Retrieved from https://www.nap.edu/catalog/23578/shared-mobility-and-the-transformation…
Hall, J. D., Palsson, C., & Price, J. (2018). Is Uber a substitute or complement for public transit? Journal of Urban Economics, 108, 36–50. https://doi.org/10.1016/j.jue.2018.09.003
Laughlin, J. (2018, August 23). Should Philly limit the number of Uber and Lyft drivers? Retrieved December 14, 2018, from http://www2.philly.com website: http://www2.philly.com/philly/business/transportation/uber-lyft-philadel…
Metropolitan Area Planning Council. (2018). Fare Choices: A Survey of Ride-Hailing Passengers in Metro Boston (p. 19). Retrieved from https://www.mapc.org/farechoices/
NYC Department of Transportation. (2018). New York City Mobility Report (p. 42). Retrieved from NYC Department of Transportation website: http://www.nyc.gov/html/dot/downloads/pdf/mobility-report-2018-print.pdf
SEPTA. (2018). SEP-TAINABLE Annual Report (p. 31). Retrieved from Southeastern Pennsylvania Transit Authority website: https://www.septa.org/sustain/pdf/2018-02-septainable-report.pdf
SEPTA. (2019). SEP-TAINABLE Annual Report (p. 32). Retrieved from Southeastern Pennsylvania Transit Authority website: http://www.septa.org/sustain/pdf/2019-03-septainable-report.pdf
Stacy C. Davis, & Robert G. Boundy. (2019). Transportation Energy Data Book (37.1). Retrieved from https://tedb.ornl.gov/
Uber. (n.d.-a). Moving Texas: Improving Mobility. Retrieved November 28, 2018, from uber.com website: https://www.uber.com/info/moving-texas/improving-mobility/
Uber. (n.d.-b). Uber Cities Across the Globe. Retrieved May 6, 2019, from https://www.uber.com/cities
