Energy-Transmission Price Correlation
In recent years, as energy prices in PJM have decreased, the portion of wholesale power costs associated with transmission has risen sharply. Turns out this negative correlation has been driven by policy and is not likely to continue.
Turns out, transmission project spending in PJM has been more attractive as power prices dropped.
I was recently poking around in the treasure trove that is Monitoring Analytics State of the Market report for PJM (yeah, I know, I’m a thrill seeker), initially looking for data on wholesale price trends and the relationship between energy and capacity prices. But, what I found is something interesting about transmission.
But, let’s start at the beginning.
It is widely believed that energy and capacity market prices are negatively correlated, meaning when energy market prices drop, capacity market prices increase, and vice versa. This is explained because a generator’s capacity bid is comprised of eligible fixed costs, net of energy market revenues. So, all things being equal, when energy market prices (and therefore generator revenues) drop, the generator’s capacity market bid should increase in order to maintain revenue adequacy.
However, the capacity price that wholesale energy customers pay relates to the overall capacity market clearing price. The clearing price is impacted by individual generator bids and other factors such as the amount of resources needed, reserve requirements, competitive new entry, etc. Given the oversupply situation in PJM (e.g. NERC’s summer reliability report indicated PJM has a 33% anticipated reserve margin, which is 20 percentage points higher than its planning reference margin), I was interested to understand how oversupply impacts the energy-capacity price correlation.
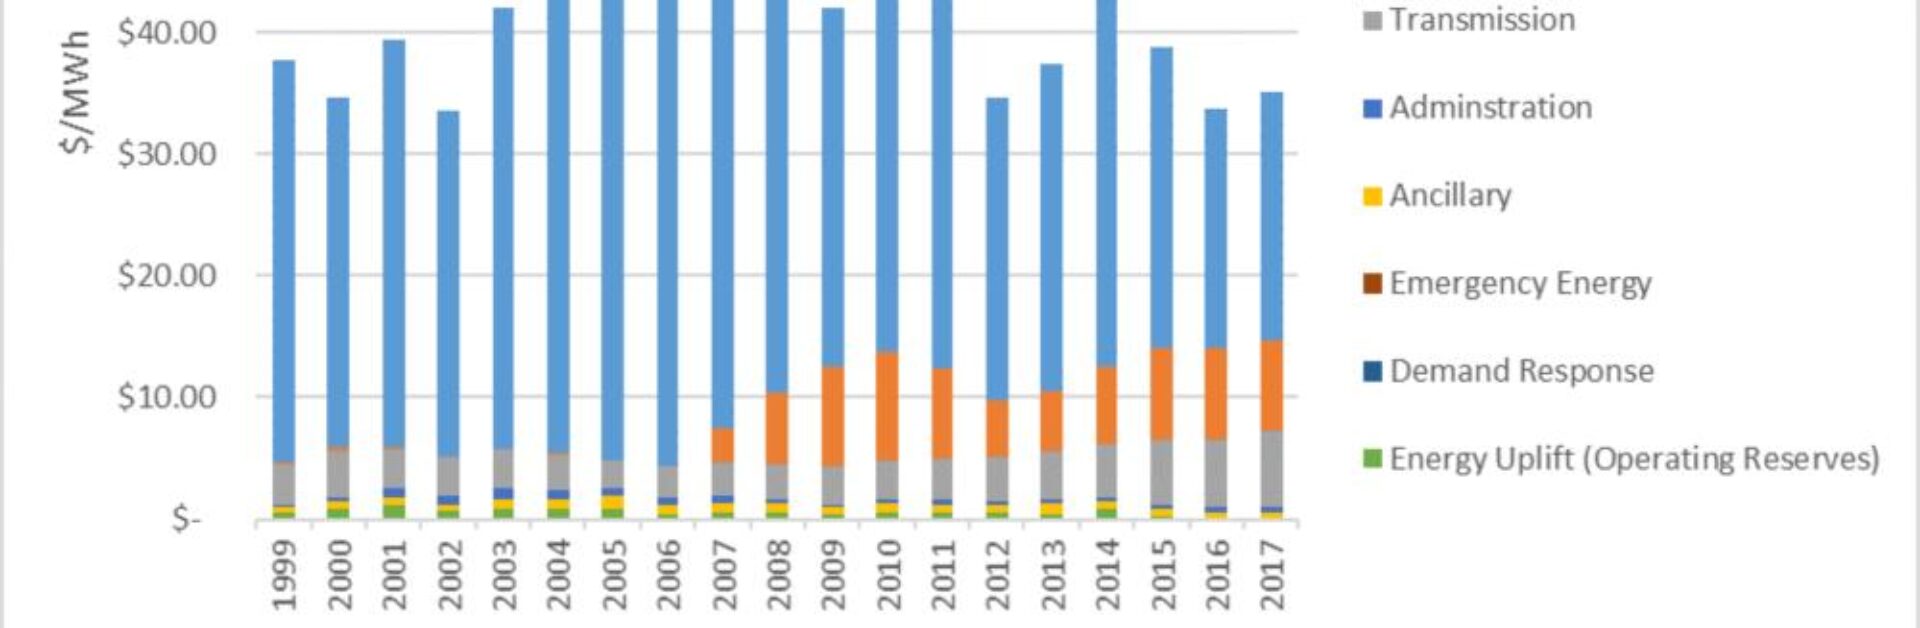
So, I looked at the 2018 Q1 SOTM report, which has annual wholesale power prices broken down by category on an inflation-adjusted basis, back to 1999 (see Table 1-11). When I plotted the data the graph showed something I didn’t expect, a significant rise in the portion of wholesale energy price related to transmission (see the grey segments in the top graphic).
So, on an inflation-adjusted basis, wholesale power customers on average paid about $3.19 per MWh for transmission costs between 1999 – 2013. However, between 2014 – 2017, on an inflation-adjusted basis average transmission costs to consumers increased about 70% to $5.41 per MWh. So, what happened? (more on this soon)
Also intriguing are the correlation coefficients. Correlation coefficients measure the relationship (in direction and strength) between two variables, with 1 indicating a perfect positive relationship, and -1 showing a perfect negative relationship. What I found is between 1999 – 2017, the negative relationship between energy and transmission price was very strong (-0.76) – meaning decreases in the price of energy were strongly associated with increases in the price for transmission – and the negative relationship between energy and capacity prices was quite weak (-0.35).
Owing to my initial inquiry, perhaps the energy-capacity correlation has been weakened due to competitive new entry? Where, in a low energy price environment, generators have had to increase capacity market bids only to see the capacity clearing price drop as low-price supply enters the market (in droves). Therefore, capacity prices do not increase as significantly in response to low energy prices. Seems logical.
But, what is going on with transmission?
It seems transmission, not capacity, has been more inversely responsive to energy price changes. But, there is no real transmission “market” so-to-speak, let alone an established linkage between energy and transmission costs.
One guess would be that with all that generator new market entry comes the need to expand transmission.
But, I’m not sure, so I poked around a bit. In this stunning graph from the EIA (right), it seems utility transmission investments in PJM have skyrocketed in recent years, doubling or tripling investment levels seen in most other NERC regions.
EEI notes that nationally, transmission investments are increasing to replace or upgrade aging infrastructure, to harden the system, to integrate renewables, and to improve reliability and security compliance. But, why is investment so much greater in PJM?
Well, we know PJM’s competitive power markets haven’t been lucrative lately and some vertically integrated companies have or are shifting away from merchant generation and towards regulated returns – like transmission and distribution (e.g. PPL, First Energy).
I’m not well versed in transmission policy, but it looks like “supplemental projects” (see slide #3) in PJM – those not needed for reliability, market efficiency, or public policy drivers (e.g. renewable energy projects) – may be one explanation for the increased spending. These projects do not require PJM board approval, are not competitive, and are generally used to address aging infrastructure, system hardening, and new customer service.
Well, it turns out I am way late to this party. In February 2018, FERC issued an Order finding supplemental project planning processes conducted by transmission owners in PJM were not consistent with FERC Order 890, and required changes to be made to meet compliance.
So, no, I haven’t figured out something new/cool. It just looks like this energy-transmission relationship is explained by rational business behavior enabled by policy. Moreover, given FERC’s Order, it is likely the trend will not continue.

Christina Simeone
Kleinman Center Senior FellowChristina Simeone is a senior fellow at the Kleinman Center for Energy Policy and a doctoral student in advanced energy systems at the Colorado School of Mines and the National Renewable Energy Laboratory, a joint program.
