Blog

U.S. CCS Ladder for Industrial Decarbonization 

Clean Energy

CCS has long been scrutinized for enabling fossil fuels, but in some industrial sectors that produce CO2 as a byproduct, CCS may be one of the only options for decarbonization today. Here’s a look at where CCS should be prioritized as a decarbonization strategy now—and for some sectors tomorrow.

The role of carbon capture and storage (CCS) in the energy transition is often scrutinized for enabling continued fossil fuel use, but in many cases CCS can help decarbonize industrial sectors. The question is: which ones?

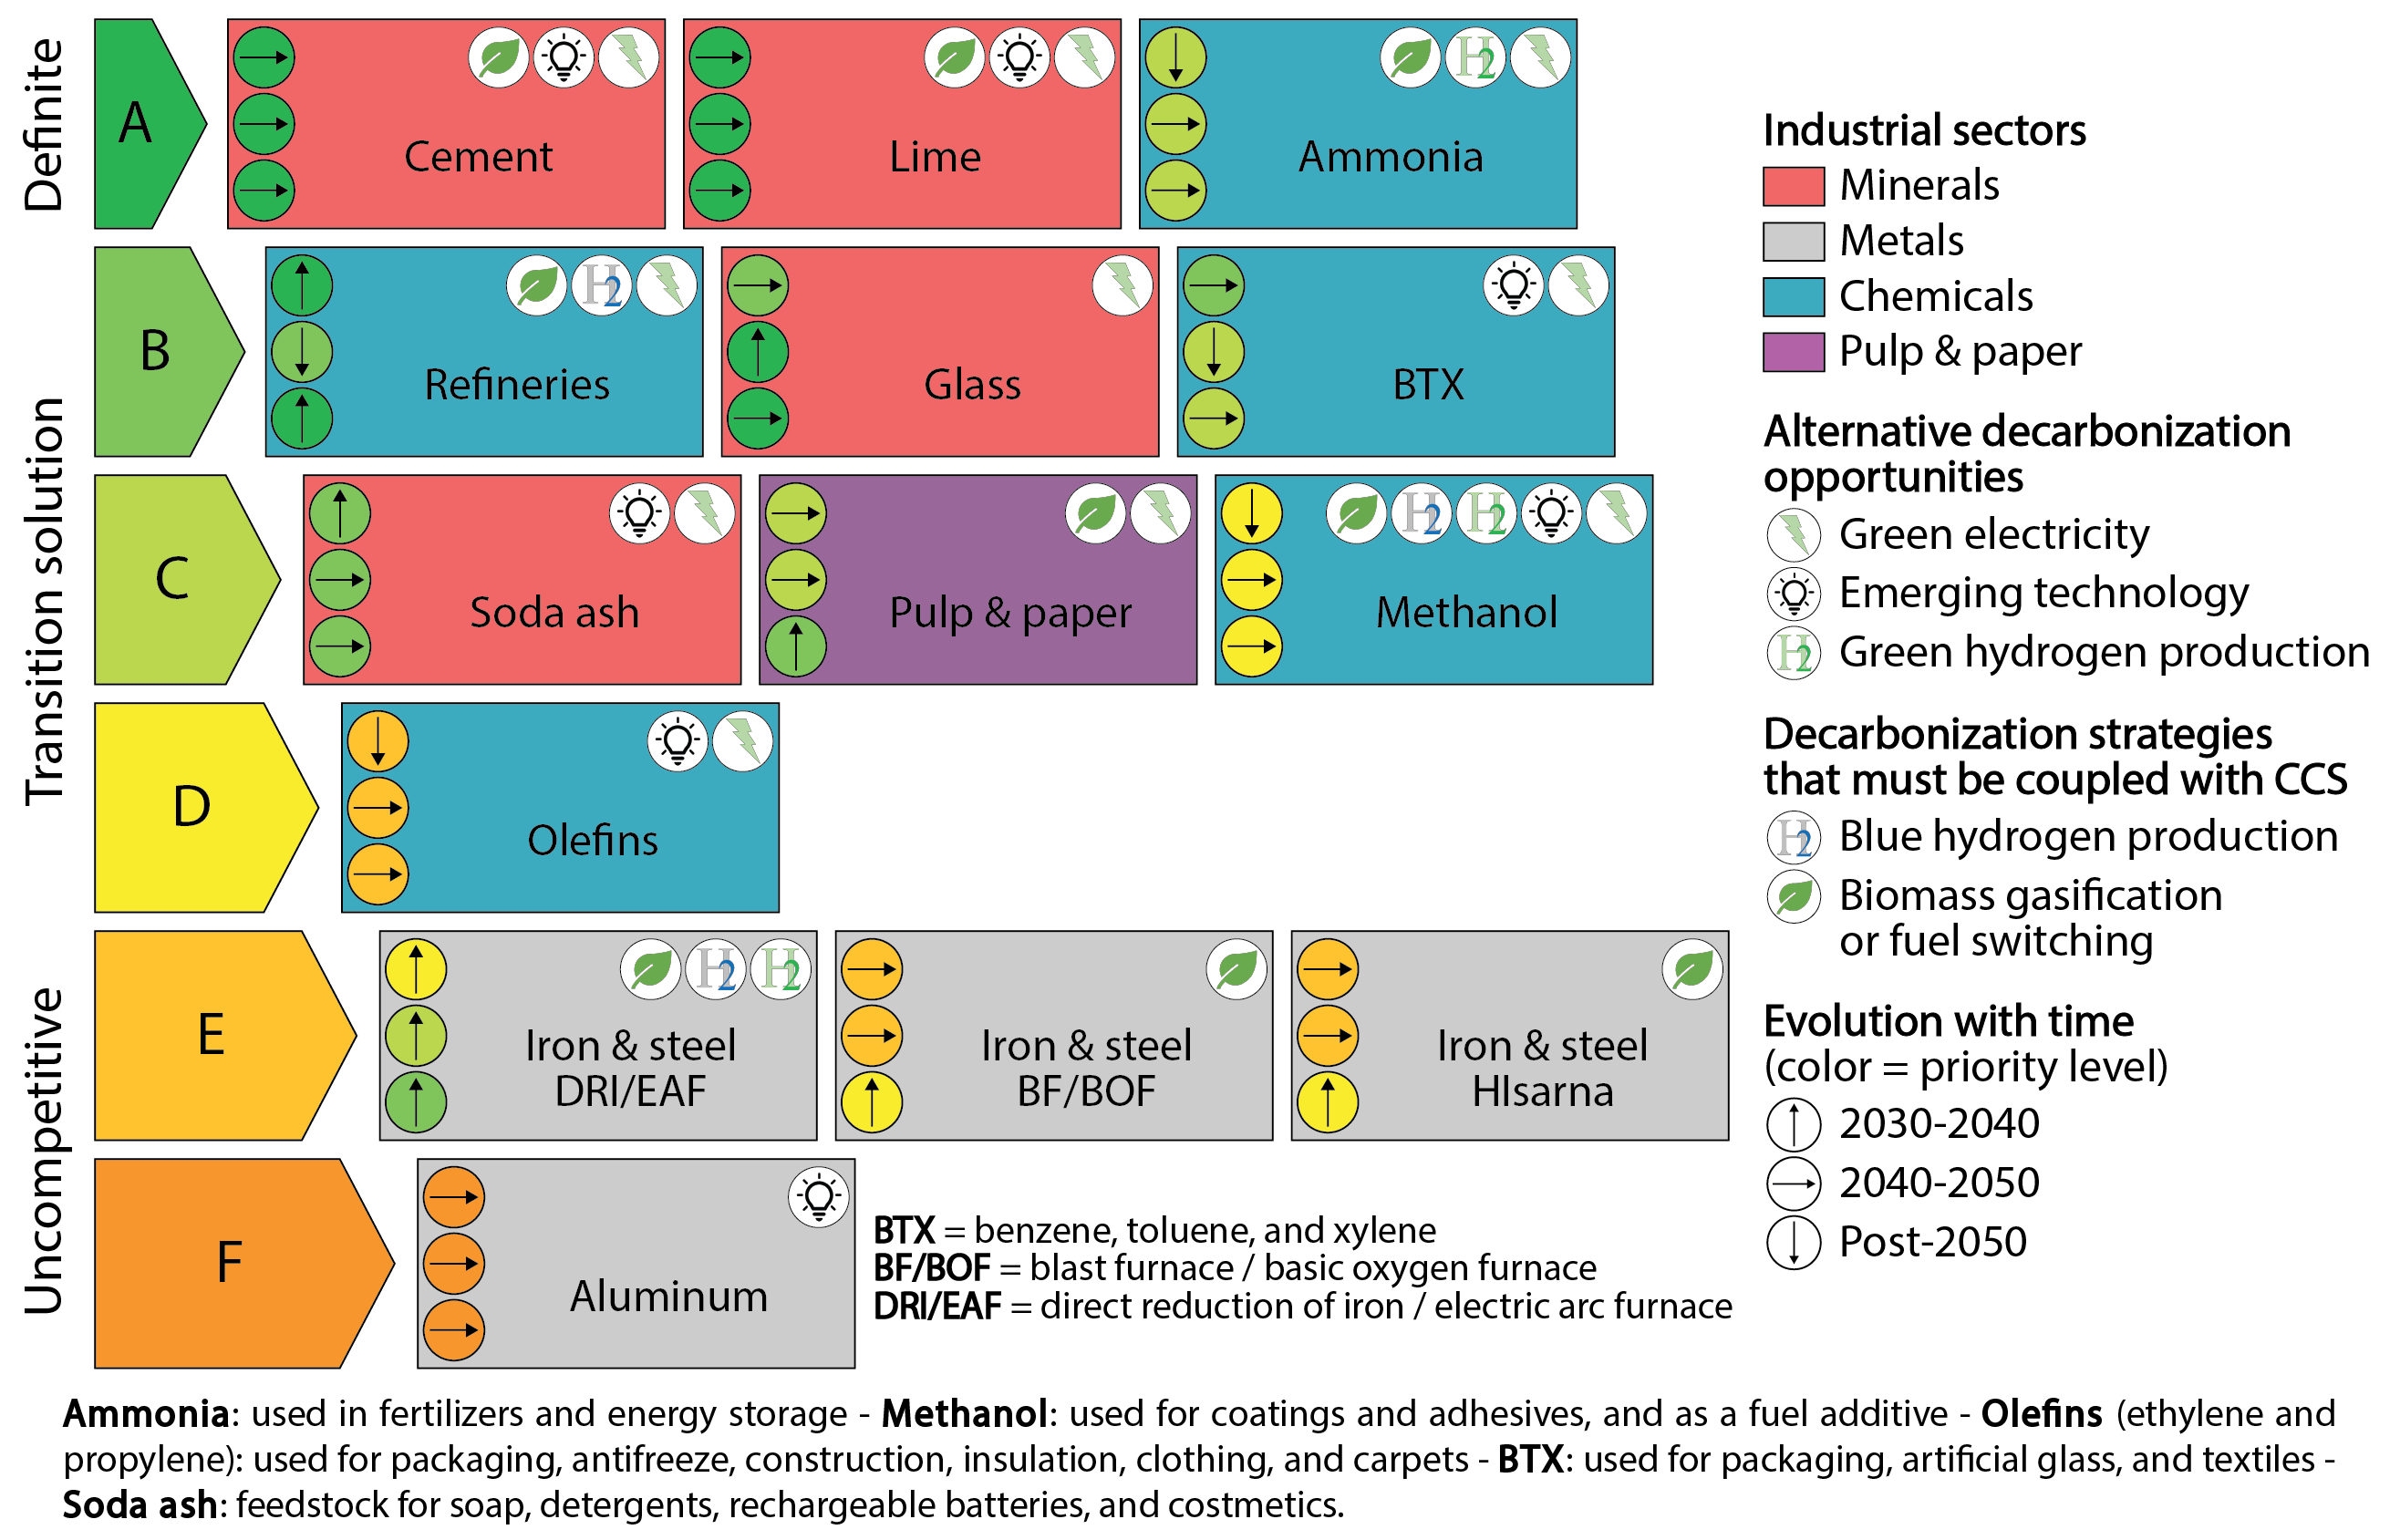
In this new diagram, a CCS ladder for the United States, we lay out the role of CCS in industrial processes like mineral, metal, and petroleum-based sectors. This ladder can help inform policymakers of the prioritization of decarbonization opportunities across industrial sectors, to ultimately champion policies that support CCS deployment in areas where it will have the greatest impact.

CCS is a unique decarbonization option for industrial applications, because of the CO2 emissions produced from both burning fossil fuels (combustion emissions) and splitting molecules (process emissions). Combustion emissions may be eliminated through fuel switching (adoption of hydrogen or sustainable biomass-based fuels) or electrification, but process emissions are harder to avoid. Eliminating these emissions without CCS will require novel chemical pathways or alternative technologies, which may take up to a decade or more to become commercially viable.

Using a similar methodology as E3G and Bellona and the Clean Hydrogen Ladder, we evaluate the relevance of CCS deployment alongside a suite of decarbonization technologies in the United States. We used five criteria to establish a ranking from which CCS is best applied and where other decarbonization tools may take the lead:

  1. CCS feasibility
  2. CO2 mitigation potential
  3. Alternative decarbonization technology readiness and availability
  4. Potential for CCS to enable fossil-fuel or emissions-intensive technology lock-in
  5. Geospatial dispersion

A temporal element was also included by applying the criteria to near-term and long-term timeframes, assessing how economy-wide decarbonization impacts the ranking and CCS viability (Figure 1).

The alternative decarbonization methods we consider include: electrification with renewable energy, fuel switching to hydrogen (H2) or sustainably-sourced biomass, and increased energy and material efficiency. All three of these methods are essential to achieve net-zero GHG emissions in the U.S. by mid-century.

The deployment of decarbonization strategies must be considered regionally, accounting for local resources. Clustered large emitters co-located with geologic CO2 storage may favor CCS, while facilities located in states with a low carbon grid intensity or available sustainable biomass may favor other decarbonization strategies (that may also include CCS in the case of biomass conversion). In addition, subnational policies that include 100% clean electricity or net-zero GHG goals will be strategic locations for siting industrial decarbonization projects that rely on low-carbon energy resources. These important factors should be considered as we move forward with CCS policies.

A prioritization ladder indicating strategic use of CCS in different industrial sectors, with “A” being the top priority and “F” being the industries where alternative decarbonization strategies may take the lead. Each sector was evaluated over 4 different timeframes spanning from now until after 2050. 
In section A, the high priority sectors for CCS are cement, lime, and ammonia. Cement remains in section A from now-2030, 2030-2040, 2040-2050, and post-2050. Cement can benefit from decarbonized emerging technologies, green electricity, and sustainable biomass with CCS to achieve full decarbonization. Lime remains in section A from now-2030, 2030-2040, 2040-2050, and post-2050. Lime can benefit from decarbonized emerging technologies, green electricity, and sustainable biomass with CCS to achieve full decarbonization. Ammonia is in section A from now-2030, but is decreased in priority to section C in the 2030-2040 timeframe, then remains in section C from 2040-2050 and post-2050. Ammonia can benefit from green hydrogen, green electricity, and sustainable biomass with CCS to achieve full decarbonization.
In section B, the second-highest priority sector, are refineries, glass, and BTX, which stands for benzene, toluene, and xylene. Refineries start in section B from now-2030, then increase in priority to section A from 2030-2040, decrease back to section B from 2040-2050, then increase once again to section A post-2050. Refineries can benefit from green hydrogen, green electricity, hydrogen production with CCS (blue hydrogen), and sustainable biomass with CCS to achieve full decarbonization. Glass starts in section B from now-2030 and remains through 2030-2040, then increases to section A from 2040-2050 and remains in section A post-2050. Glass can also benefit from green electricity to achieve full decarbonization. BTX starts in section B from now-2030, and remains in section B from 2030-2040, then decreases in priority to section C from 2040-2050, and remains in section C post-2050. BTX can benefit from decarbonized emerging technologies and to achieve full decarbonization. 
In section C, are soda ash, pulp and paper, and methanol. Soda ash starts in section C from now-2030, then moves to section B in 2030-2040, and remains there from 2040-2050 and post-2050. Soda ash can benefit from decarbonized emerging technologies and green electricity to achieve full decarbonization. Pulp and paper starts in section C from now-2030 and remains there from 2030-2040 and 2040-2050, then moves up to section B post-2050. Pulp and paper can benefit from green electricity and sustainable biomass with CCS to achieve full decarbonization. Methanol starts in section C from now-2030, then decreases in priority to section D in 2030-2040, where it remains from 2040-2050 and post-2050. Methanol can benefit from green hydrogen, green electricity, decarbonized emerging technologies, hydrogen production with CCS (blue hydrogen), and sustainable biomass with CCS to achieve full decarbonization.  
In section D is the olefin sector, which is responsible for producing ethylene and propylene. Olefins begins in section D from now-2030, then decreases in priority to section D from 2030-2040, where it remains from 2040-2050 and post-2050. Olefin production can benefit from decarbonized emerging technologies and green electricity to achieve full decarbonization. 
In section E are iron and steel sectors, the pathways featured include direct reduced iron and electric arc furnace (DRI/EAF), blast furnace and basic oxygen furnace (BF/BOF), and the HIsarna process. The iron and steel - DRI/EAF process starts in section E from now-2030, then increases in priority to section D from 2030-2040, then increases in priority to section C in 2040-2050, then increases in priority to section B post-2050. The DRI/EAF pathway can benefit from green hydrogen, hydrogen production with CCS (blue hydrogen), and sustainable biomass with CCS to achieve full decarbonization. The iron and steel - BF/BOF process starts in section E from now-2030, then remains there from 2030-2040 and 2040-2050, and increases in priority to section D post-2050. The BF/BOF pathway can benefit from sustainable biomass with CCS to achieve full decarbonization. The iron and steel - HIsarna process starts in section E from now-2030, then remains there from 2030-2040 and 2040-2050, and increases in priority to section D post-2050. The HIsarna pathway can benefit from sustainable biomass with CCS to achieve full decarbonization.
In section F, the sector where alternative decarbonization technologies are slated to take the lead over CCS, is aluminum. Aluminum starts in section F from now-2030, and remains in section F from 2030-2040, 2040-2050, and post-2050. The emerging technology in the aluminum sector may contribute to the decarbonization of the sector more than CCS.
For additional context about where these products and industries contribute to the economy:
●	Ammonia is used in fertilizers and energy storage
●	Methanol is used for coatings, adhesives, and as a fuel additive
●	Olefins, which include ethylene and propylene, is used in packaging, antifreeze, insulation, clothing and carpets
●	BTX products are used in packaging, artificial glass, and textiles
●	Soda ash is a feedstock for soap, detergents, rechargeable batteries, and cosmetics
Figure 1: Prioritization of industries for CCS adoption, “A” being the top priority and “F” the industries for which alternative decarbonization strategies may be more competitive. The ranking shown applies to today, and the evolution of that ranking is depicted by the arrows on the left-hand side of each industry box. In addition, alternative solutions for decarbonization or solutions that can be combined with CCS for increased decarbonization are shown on the top right corner of each industry box.

Key Takeaways

  • Mineral-based industries (e.g., cement, lime, glass, and soda ash production) are favorable for CCS. They have substantial process emissions from a single source, so CCS may be a long-term viable solution for decarbonizing these sectors.
  • Hydrogen production at refineries coupled to CCS is promising. It may displace the use of carbon-intensive fuel gas for distributed combustion emissions. Leveraging existing reforming technology at refineries can provide a bridge to refineries of the future, which may use clean hydrogen not just for heat, but, with CO2, as a chemical feedstock for producing synthetic fuels.
  • CCS may be a transition solution for petrochemical industries as alternative technologies eliminate the need for CCS (such as emerging catalytic processes) reach higher technology readiness levels. Some approaches, such as synthesis gas (CO + H2) derived from advanced gasification of sustainable feedstocks (e.g., plastic, biomass, MSW), will still require CCS to achieve decarbonization and will likely be carried out in the long term in parallel to synthetic chemical pathways.
  • CCS on reforming technology at refineries for H2 production and ammonia facilities today may include mostly fossil-sourced methane or natural gas but could transition to renewable methane/natural gas long term. This has the potential benefit of co-locating H2 production from renewable methane as a feedstock for ammonia synthesis for emissions mitigation associated with agriculture. This pathway would likely be deployed in parallel with approaches that include green hydrogen.
  • CCS is a temporary solution for iron and steel production. As adoption of the direct reduction of iron steelmaking process grows, it may displace blast and basic oxygen furnaces for markets demanding higher quality steel (e.g., automotive industry). As steel recycling supply chains increase, the electric arc furnace may become increasingly adopted for markets demanding medium-to-lower quality steel products.
This figure is a pie chart of greenhouse gas emissions from industrial sectors in the United States. Each slice represents one industrial sector (cement, lime, glass, soda ash, refining, ammonia, petrochemicals, iron & steel, aluminum, and pulp & paper). Each of the industrial sectors is divided into two slices, the first showing the carbon capture potential and the second the portion of the emissions that is remaining and can be decarbonized through alternative decarbonization pathways. For each industrial sector, three numbers are given: (1) the total greenhouse gas emissions of the sector in million metric tons of CO2 equivalent per year, (2) the carbon capture and storage (CCS) potential for the sector in million metric tons of CO2 per year, and (3) the remaining greenhouse gas emissions in million metric tons of CO2 equivalent per year, that can be decarbonized through alternative decarbonization pathways. For each sector, these numbers are the following.
●	Cement makes 12.1% of the pie: total emissions are 69.3, CCS potential is 65.8, and remaining emissions: 3.5
●	Lime makes 5% of the pie: total emissions are 27.4, CCS potential is 26.0, and remaining emissions: 1.4
●	Glass makes 1.4% of the pie: total emissions are 7.8, CCS potential is 7.5, and remaining emissions: 0.4
●	Soda ash makes 1.0% of the pie: total emissions are 5.5, CCS potential is 5.2, and remaining emissions: 0.3
●	Refining makes 28.4% of the pie: total emissions are 162.9, CCS potential is 106.6, and remaining emissions: 5.4. In this case the CCS potential assumes that refineries produce more hydrogen with CCS, to use on site as a source of decarbonized heat.
●	Ammonia makes 7.4% of the pie: total emissions are 42.5, CCS potential is 19.8, and remaining emissions: 22.6
●	Petrochemicals makes 11.5% of the pie: total emissions are 66.1, CCS potential is 31.5, and remaining emissions: 34.6
●	Iron & steel makes 11.8% of the pie: total emissions are 67.4, CCS potential is 19.8, and remaining emissions: 47.6
●	Aluminum makes 0.4% of the pie: total emissions are 2.1, CCS potential is 0.0, and remaining emissions: 2.1
●	Pulp & paper makes 21.3% of the pie: total emissions are 122.1, CCS potential is 95.8, and remaining emissions: 26.3
Figure 2: Industrial sectors with total greenhouse gas emissions (including emissions from biogenic sources) in the United States depicted as a slice of the pie chart. Each sector slice is divided into the portion of CO2 emissions that can be addressed using CCS (solid color) and the portion that is remaining and can be decarbonized through alternative decarbonization pathways (patterned) (data from the EPA-FLIGHT database).

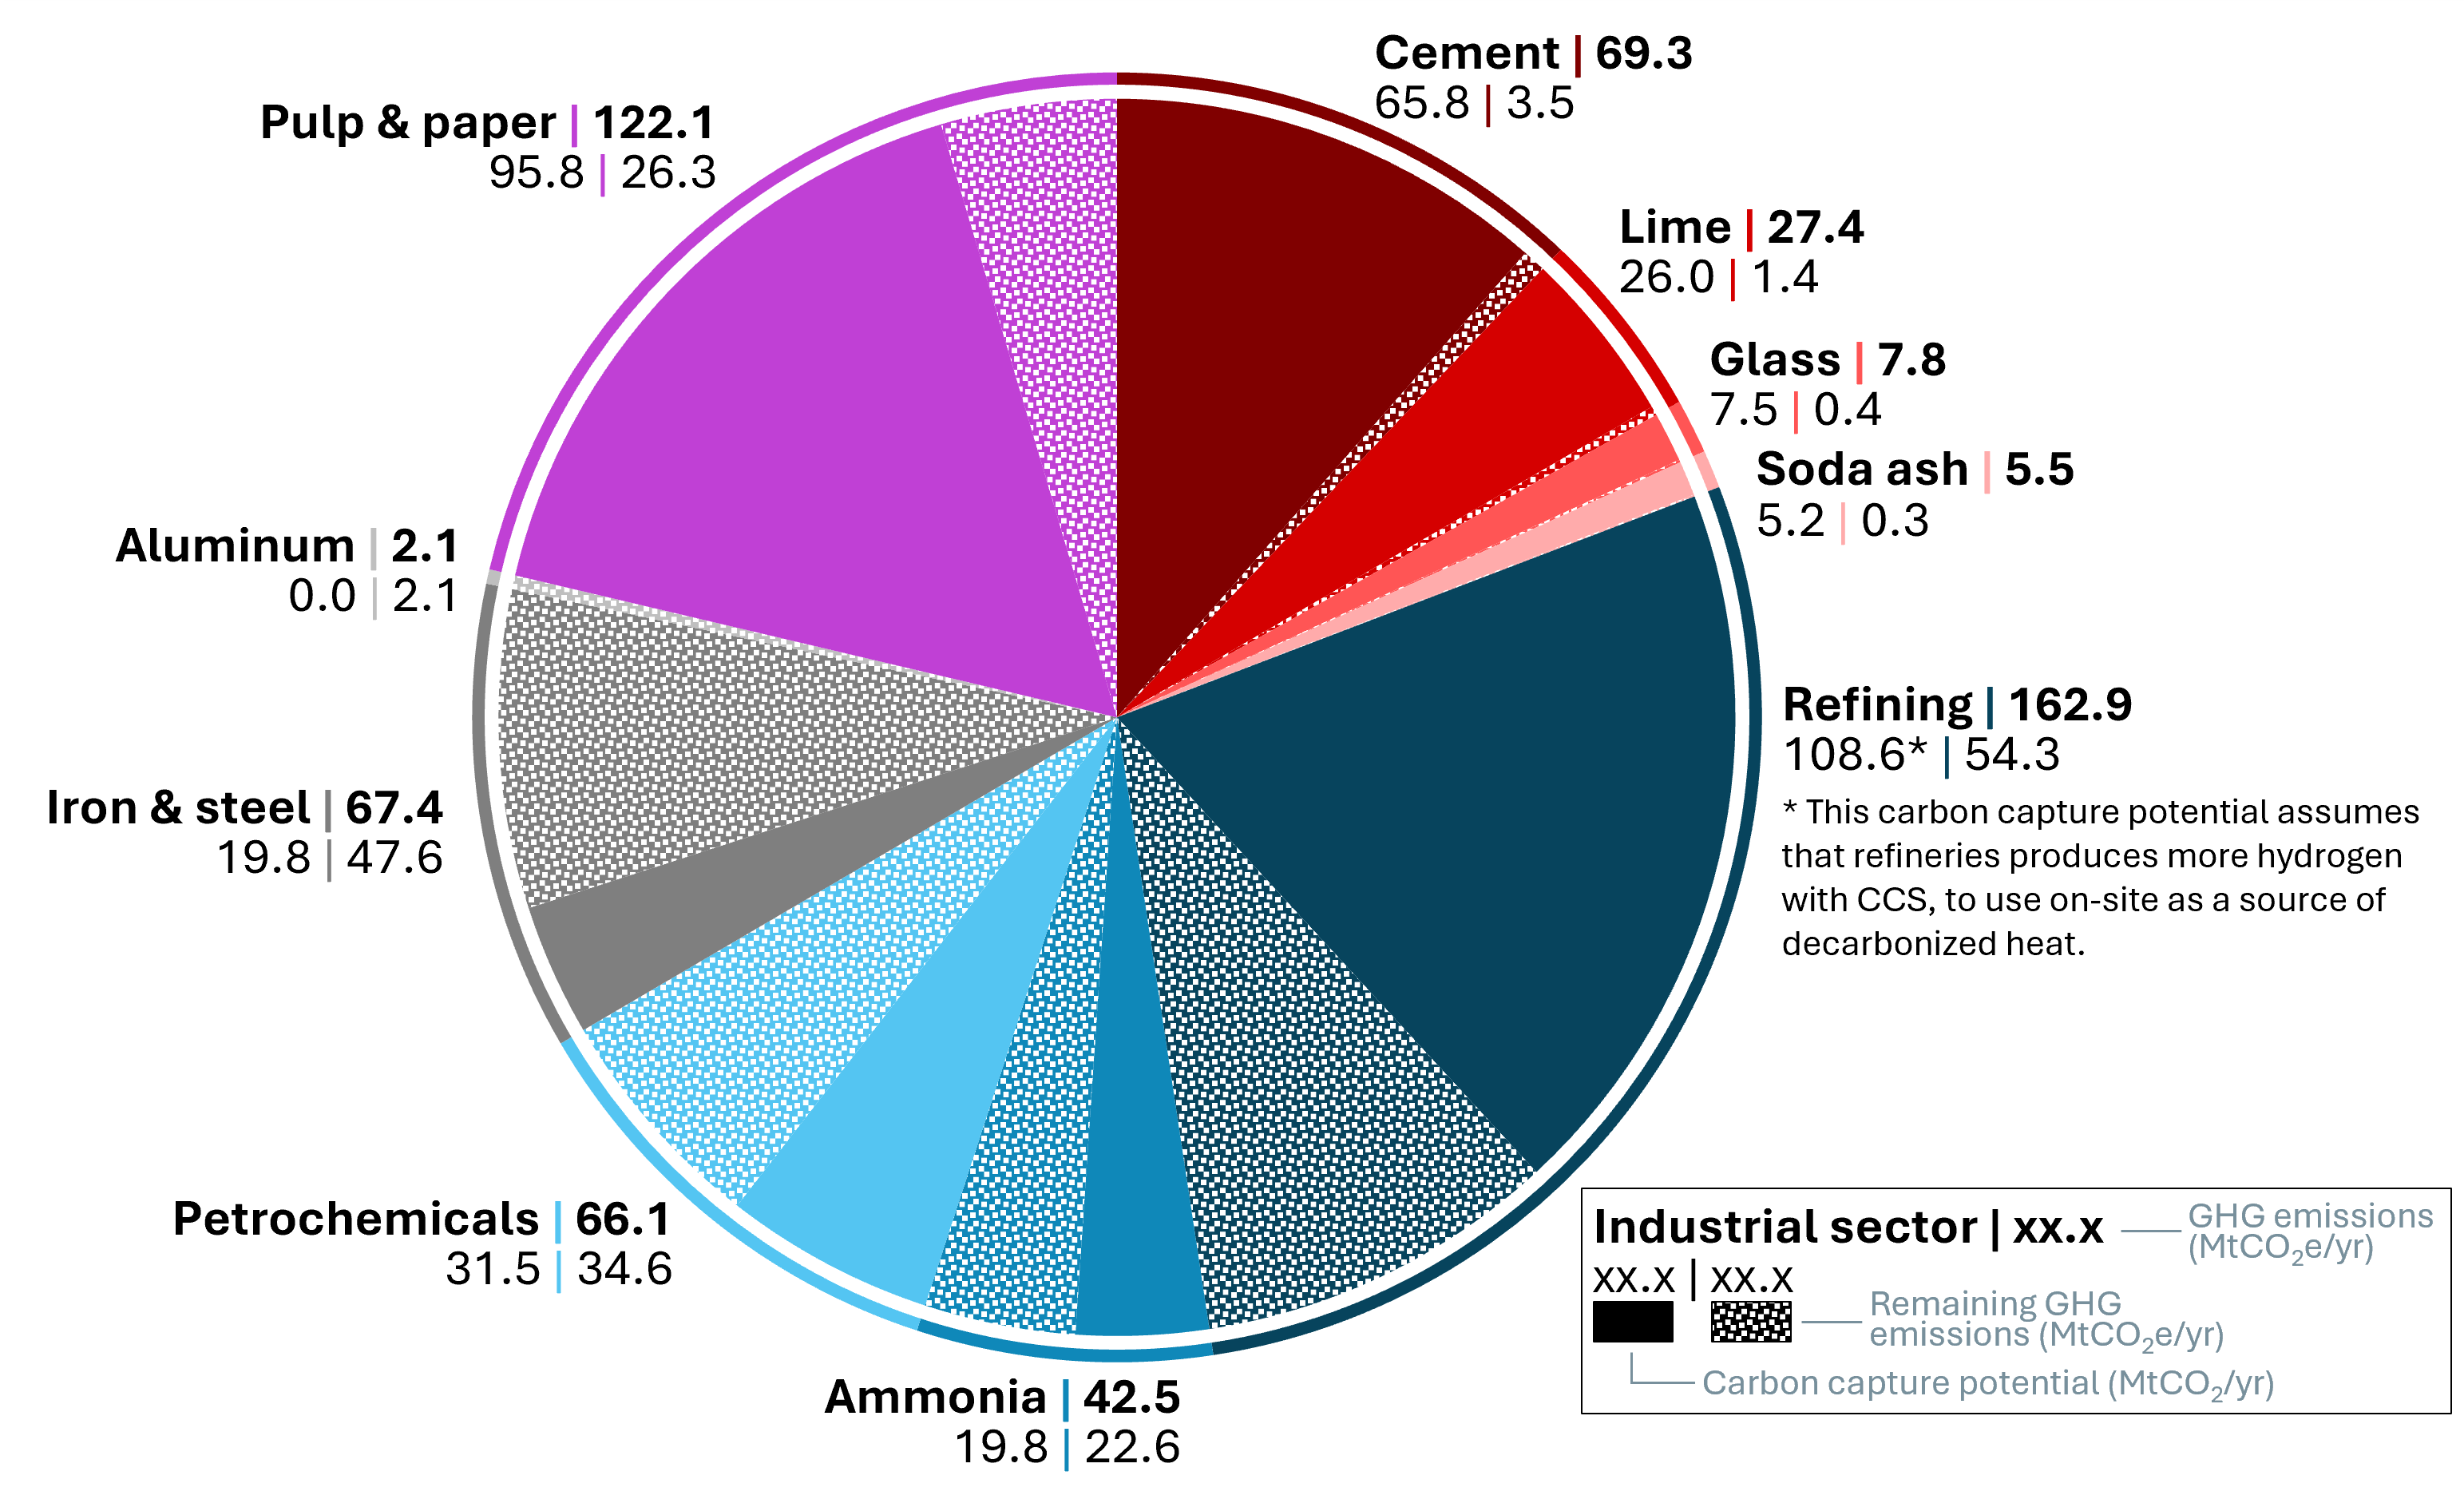
Overall, we see that nearly two thirds of industrial emissions could be decarbonized with CCS (Figure 2), with prioritization of industries that are high on the ladder (Figure 1). The remaining emissions have the potential to be decarbonized with alternative approaches (e.g., fuel switching, electrification, etc.), which will be dominating decarbonization strategies for the industries at the bottom of the ladder (Figure 1).

Maxwell Pisciotta

Postdoctoral Fellow, Clean Energy Conversions Lab

Max Pisciotta is a postdoctoral fellow in the Clean Energy Conversions Lab. They hold a PhD in Chemical Engineering from Penn whose research focused on carbon capture and carbon removal. They served on the Kleinman Center Student Advisory Board and completed the 2021 Kleinman Birol Fellowship.

Shelvey Swett

PhD Candidate , Chemical and Biomolecular Engineering

Shelvey Swett is a third year PhD candidate in the Chemical and Biomolecular Engineering department at the University of Pennsylvania. Her work focuses on carbon capture and storage and on the recovery of critical minerals.

Hélène Pilorgé

Research Associate, Clean Energy Conversions Lab

Hélène Pilorgé is a research associate with the University of Pennsylvania’s Clean Energy Conversions Laboratory. Her research focuses on carbon accounting of various carbon management solutions and on Geographic Information Systems (GIS) mapping for responsible deployment of carbon management.

Shrey Patel

PhD Candidate , Chemical and Biomolecular Engineering

Shrey Patel is a second year PhD candidate in the Department of Chemical and Biomolecular Engineering at the University of Pennsylvania. His research focuses on the integration of low carbon energy sources with carbon capture and storage.

Jennifer Wilcox

Presidential Distinguished Professor

Jen Wilcox is Presidential Distinguished Professor of Chemical Engineering and Energy Policy. Her research expertise is in carbon capture and sequestration technologies, in order to minimize the negative impacts of fossil fuels.