
Pennsylvania’s Gas Discount is Fading
Pennsylvania's natural gas price discount to the Henry Hub is narrowing, even as production soars. The reason? New takeaway pipeline capacity is coming online and moving gas out of state.
What a difference a year makes.
In October 2017, I published a report looking at Pennsylvania’s first decade (2007 to 2016) of shale gas development, focusing on consumer price impacts (and not focusing on other important issues like environmental or employment impacts).
The report found gas development has been a big win for Pennsylvania gas (and power) customers.
A significant factor driving consumer cost reductions was attributed to regional natural gas prices dropping below national benchmark prices set at the Henry Hub. This was dubbed the “Pennsylvania Gas Discount” and it was created by a regional gas supply glut.
The report also noted the extraordinary interest in pipeline development to move Pennsylvania gas to out-of-state markets—specifically 53 applications approved by FERC between 2007 and 2016 representing about 13 billion cubic feet per day of takeaway capacity.
While many of these pipeline projects will never be built, the ones that do go into service will increase demand for Pennsylvania gas and could erode the state’s gas discount.
Sure enough, a year later and a few new pipelines coming into service and the PA Gas Discount looks to be narrowing.
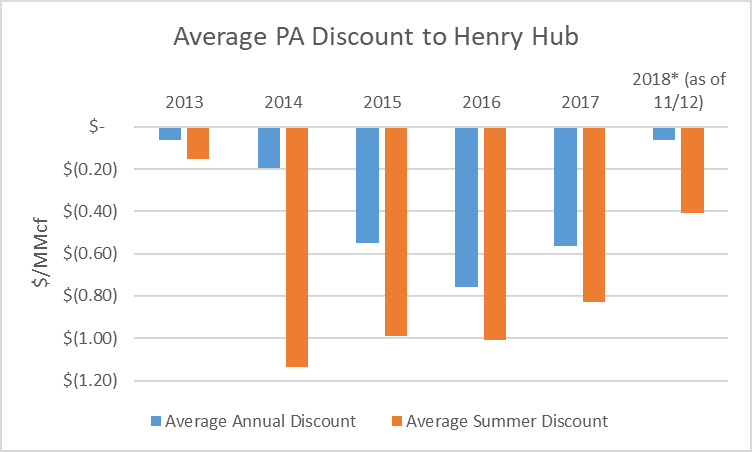
On the graph to the right, you can see the average PA discount to the Henry Hub is significantly greater in the summer gas season (April through October), as marked in the orange columns. An average annual discount also exists, as marked in the blue columns. Both the summer and the annual discount dropped significantly in 2018 (though there is another month and a half left in the year).
Why is the discount narrowing?
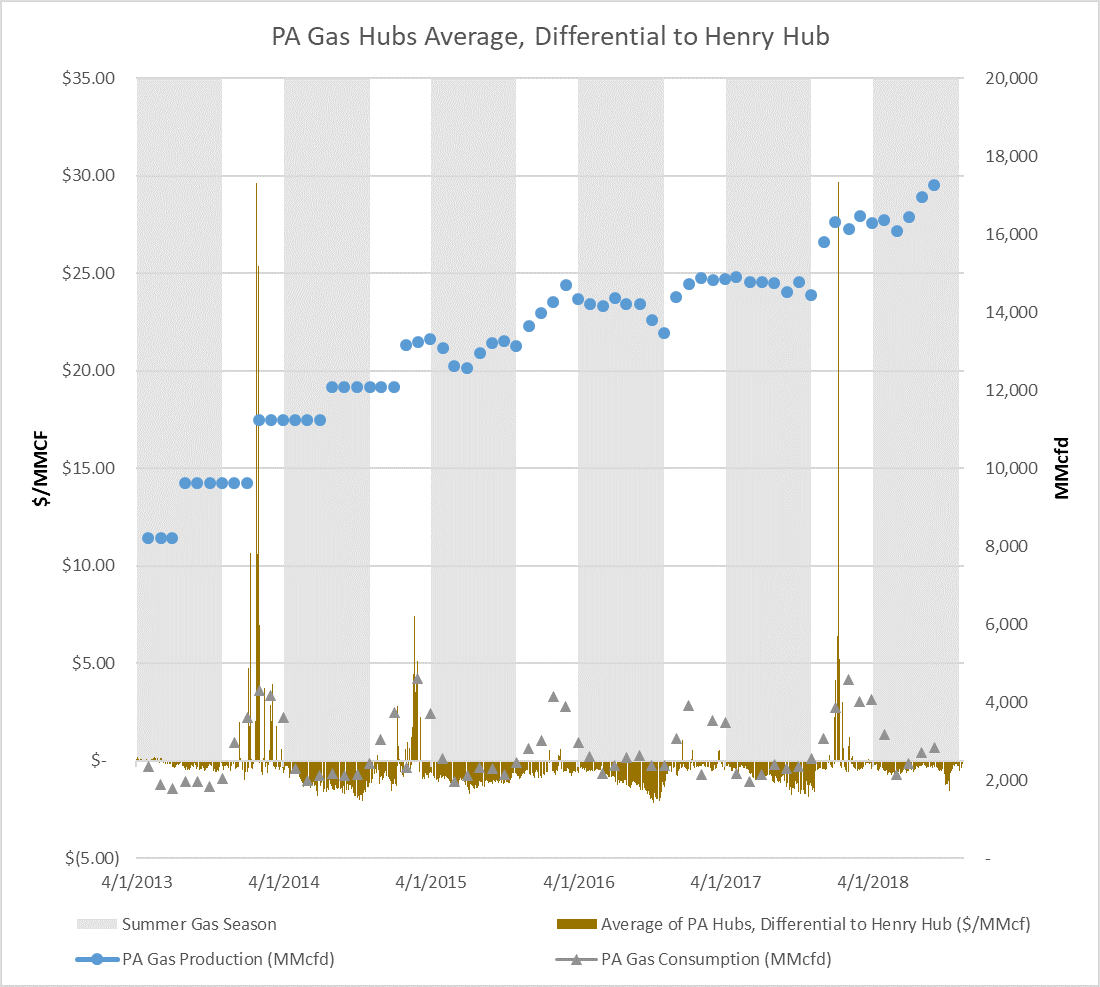
Well, lack of production (i.e. supply) sure isn’t the answer. As you can see by the graph—as represented by the blue dots—production has steadily increased and there was even a big ramp up in 2018.
A big increase in consumption (i.e. demand) from Pennsylvania gas users isn’t the answer either, as can be seen by the grey triangles. And, Henry Hub prices have actually ticked up a bit on average in the three years spanning 2016 to 2018—which would widen the discount, all else equal—so that doesn’t explain things.
So, what is the explanation?
It’s simple, new pipelines (a conclusion repeatedly shared by the U.S. EIA).
EIA has a handy inventory of pipeline projects, just filter for “completed” projects that begin in “PA” (or neighboring Ohio and West Virginia, since new capacity in these states can also free up space for Pennsylvania gas flows) and you will get a sense of the activity. There are a bunch of small projects, but below lists a few of the big ones impacting Pennsylvania gas.
The Rockies Express zone 3 expansion came online in October 2016 to move gas west from Pennsylvania. The Algonquin Incremental Market project to move Pennsylvania gas to the northeast, came in service around December 2016. The Ohio Valley Connector project also came online in late 2016.
In June 2018, the full Rover Pipeline came in service to bring gas to the Midwest and northward to the Dawn hub (Ontario), with the Revolution and legacy lines tying Pennsylvania supply to the system. The Atlantic Sunrise project with 1.7 Bcfd of capacity came online in early October 2018 (which is too late in the year to explain these price data). This expansion of the Transco line will bring Pennsylvani gas southeast, to places like Washington, D.C. and the Cove Point LNG export terminal.
Eroding the Pennsylvania Gas Discount benefits gas producers, as they get to sell product at a higher price. It also benefits consumers at the other end of the pipeline, because they get cheaper gas.
But, for Pennsylvania consumers, the fading discount means gas costs will go up (and power costs too).
Before shale gas development, Pennsylvanian’s customers paid well above national average gas prices. But, as my October 2017 report showed using 2016 data, annual average citygate gas prices in Pennsylvania were equal to national average citygate prices. However, average annual retail prices in the state to residential gas consumers were still above the national average for residential retail consumers.
This is likely a result of higher than national average gas distribution system costs in Pennsylvania. Nonetheless, the narrowing commodity discount is set to raise gas bills for consumers in all customer classes.
Data and Methodology:
Historic spot natural gas weekly index prices were taken from SNL energy for the Henry Hub and compared to a unweighted prices from seven Pennsylvania hubs (Transco Z6 non-NY, TGP Z4 200L, TCO Pool, TETCO M3, Leidy, Dominion N, Dominion S). The PA Gas Discount was identified as the difference between the average price of the seven PA hubs and the Henry Hub for each week. The arithmetic average of the PA hubs discount for the full year and summer season were then developed. These data were complemented by U.S. EIA data for average daily Pennsylvania natural gas production and withdrawals per month. U.S. EIA data for cumulative monthly Pennsylvania gas consumption was converted to daily averages for purpose of comparison.

Christina Simeone
Kleinman Center Senior FellowChristina Simeone is a senior fellow at the Kleinman Center for Energy Policy and a doctoral student in advanced energy systems at the Colorado School of Mines and the National Renewable Energy Laboratory, a joint program.
