Building to Last: Impacts of a Philadelphia Energy-Efficiency Housing Rehabilitation Program for Low-Income Households
This is a working paper by Susanna Berkouwer and Adi Jahić in collaboration with the Philadelphia Energy Authority and funded by the Kleinman Center.
Introduction
Low-income families are more likely to live in homes that are older, more in need of repairs, and have outdated appliances (Rosenthal, 2008; Mayes and Martin, 2022). This can be costly through multiple channels. First, repairs are expensive, often prohibitively so. Lower income homeowners spend the largest share of their incomes on their homes: 8.7% more than the average homeowner. According to the Philadelphia Green Capital Corp, there are over 60,000 low-income homeowners in Philadelphia who cannot afford critical home repairs.
Second, newer, better-kept homes with more modern appliances tend to be more energy efficient (EIA, 2017). This causes poorer families, who are more likely to live in these types of homes, to use more energy, exacerbating the large difference in energy burden between richer and poorer households. The national average energy burden for low-income households is 16.3% as compared to 3% for non-low-income households (Eisenberg, 2014). This furthermore leads poorer households to experience increased discomfort in their homes, as they are more likely to have to deal with issues such as pests, mold, uncomfortable temperatures, bad smells, and noises. In addition to causing significant discomfort, these factors can cause significant health problems when left unaddressed.
The deterioration of housing quality also has important negative externalities. The deterioration of homes can harm the condition and integrity of nearby structures. It can also negatively affect the value or nearby properties. The increase in pest and mold prevalence furthermore constitutes a significant public health issue. And finally, on a more global scale, the inefficient use of energy increases emissions.
A large number of national and local level programs have been created to help low-income families: consider for example the Section 504 Home Repair loan and grant program, the Neighborhood Stabilization Program, the Property Assessed Clean Energy, Home Energy Retrofit Opportunity Program, and the Weatherization Assistance Program. Over half of major US cities have some kind of municipal housing rehabilitation program. These programs take the form of grants, loans, or direct service programs.
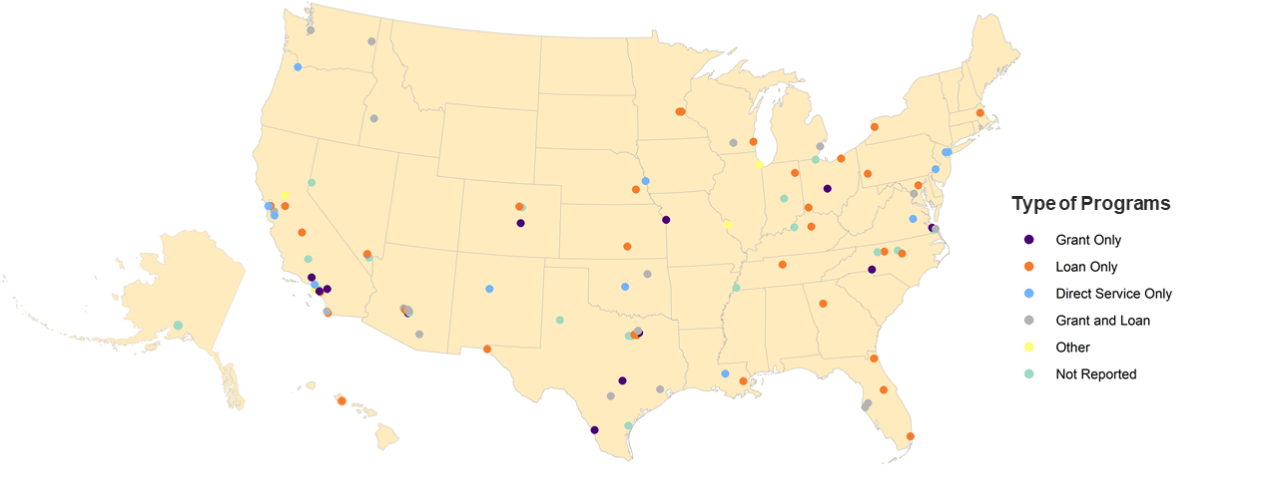
Source: Source: Mayes & Martin, 2022
But how do these programs impact the lives of homeowners? While programs such as WAP may help treated households save money, how do they impact families’ comfort levels in their home? On top of this, how costly are these programs to households?
A lack of coordination across agencies can create a large number of independent programs, which can be difficult for households to navigate. According to the Philadelphia Energy Authority (PEA), “Philadelphia institutions offer dozens of services to assist low-income households to improve their properties and reduce their cost burdens, each of which requires separate applications, often have high denial rates and only address one component of the problem… The order of application is also important, as one program might solve a problem for which another program would deny the applicant.” Because of these bureaucratic frictions and inefficiencies, many eligible households do not take advantage of these services as the application process is time-consuming. For example, the Weatherization Assistance Program (WAP) in Philadelphia typically has an over 50% denial rate, most often related to moisture/mold and structural issues, which may be solved through other programs, properly ordered.
In a small-scale randomized control trial, we measure the impact of the Built to Last program, a housing rehabilitation program in Philadelphia which aggregates the services of several direct home improvement programs and non-profits, for low-income homeowners in Philadelphia.
Setting: Philadelphia Energy Authority’s Built to Last Program
The PEA’s “Built to Last” (BTL) program was created to improve access to local public home improvement programs. The program reduces the complexity of the application process for homeowners by acting as a platform through which households can simultaneously access multiple low-income housing intervention programs. This collaboration allows for BTL to comprehensively retrofit homes for eligible homeowners across a wide array of improvements. This includes providing utility programs which reduce a household’s energy burden, weatherization, repair programs, legal services, and health and housing counseling programs. The goal of BTL is to reduce the applicant denial rate, reduce program costs (such as referral costs), increase inter-agency data sharing, and shorten the project timeline for each home. The program plans to serve at least 250 homes by 2025 before expanding further.
Homeowners who apply to the BTL program first complete a short survey determining their eligibility for the program. If they are deemed eligible, their house is then inspected by a PEA representative. The inspection determines which repairs, weatherization investments, or other improvements the home is eligible for. After the inspection, the PEA shares this information with the relevant housing intervention programs, who then independently fund and send contractors to work on the planned repairs. PEA also specifies the order in which the various components are to be implemented, which is generally determined by engineering efficiency. This process removes the need for homeowners to apply individually to the separate programs, and to know ex-ante the order in which they must apply to the programs, significantly lowering the barriers for homeowners in accessing these programs.
Methodology
In collaboration with the PEA, we evaluated program experienced and impacts for sixty households that had been deemed eligible for the BTL program, meaning that they were homeowners in Philadelphia, with incomes below 150% of the U.S. poverty line, and with no intention of moving in the next three years. Of the study participants, 96% were female and 95% were non-white. During the intake survey, more than half of study participants stated that their home in its current state was already unsafe. Many were already exploring some home improvement or energy-related welfare programs.
BTL home improvements for the 60 households were to be implemented over the course of one year, ranging from January-December 2023. The research team randomly determined the order in which households would receive the interventions. Households in the early treatment group were to receive home improvements between no later than June 2023. Households in the late treatment group were to begin receiving home improvements in September 2023.
Between August and September 2023 we conducted an endline survey to members of both the early and late treatment groups. Importantly, the timing of the survey meat that repairs had been completed in all of the early treatment group households, but in none of the late treatment group households. Surveying late-treatment households before they experienced any interventions made it so that this group functioned as the study’s “control group.”
The survey was conducted over the phone or was sent by mail. We asked questions about the amount of work they had done on their houses in recent months and about participants’ comfort levels in their home. Survey respondents were compensated with a $25 gift card to a major retailer for their time.
We successfully surveyed 26 people at the endline: 12 from the early-treatment group and 14 from the late-treatment group. The remaining participants either did not consent to the phone survey, did not speak English, or did not respond to our phone calls or mailer.
Results
Due to the limited sample size, we lack the power necessary to find results that are statistically different from zero. Because of this, we are unable to make strong claims about the impact of the intervention. Instead, we look at what the direction of the results of the regressions suggest.
We begin by evaluating the on-the-ground implementation of BTL. What home improvements do participants report having experienced in their homes? We run simple statistical regressions to compare the amount of work done and treatment, controlling for socioeconomic factors to improve the precision of the results. Because we randomly assigned households to either the early or the late treatment group, we can attribute differences between the treatment and control groups as resulting from the BTL program. The results of these regressions are presented in Figure 4.
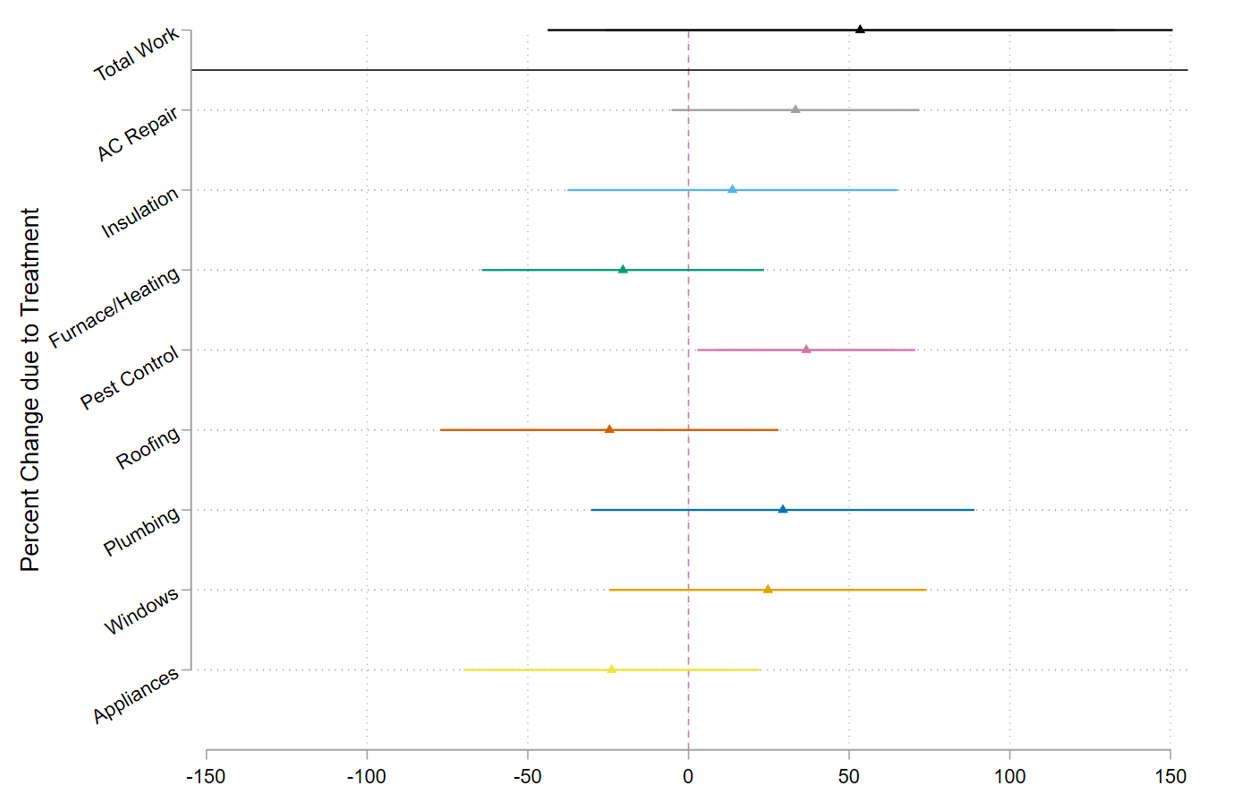
We find that treated households had just over 50% more work done on their households in the past six months and were 27% more likely to have had major work done. The largest self-reported interventions are in pest control, AC repair, and plumbing repair: treated households were between 0.3 to 0.45 standard deviations more likely to have these types of repairs done on their homes.
Interestingly, some of the control group households also reported having work done on their houses in recent months. As we mentioned earlier, many of the households reported that they had worked with other housing intervention programs recently when surveyed at baseline. This suggests that many of these households would receive at least some of the repairs they received eventually, but BTL may have expedited this process by reducing the length of the application process.
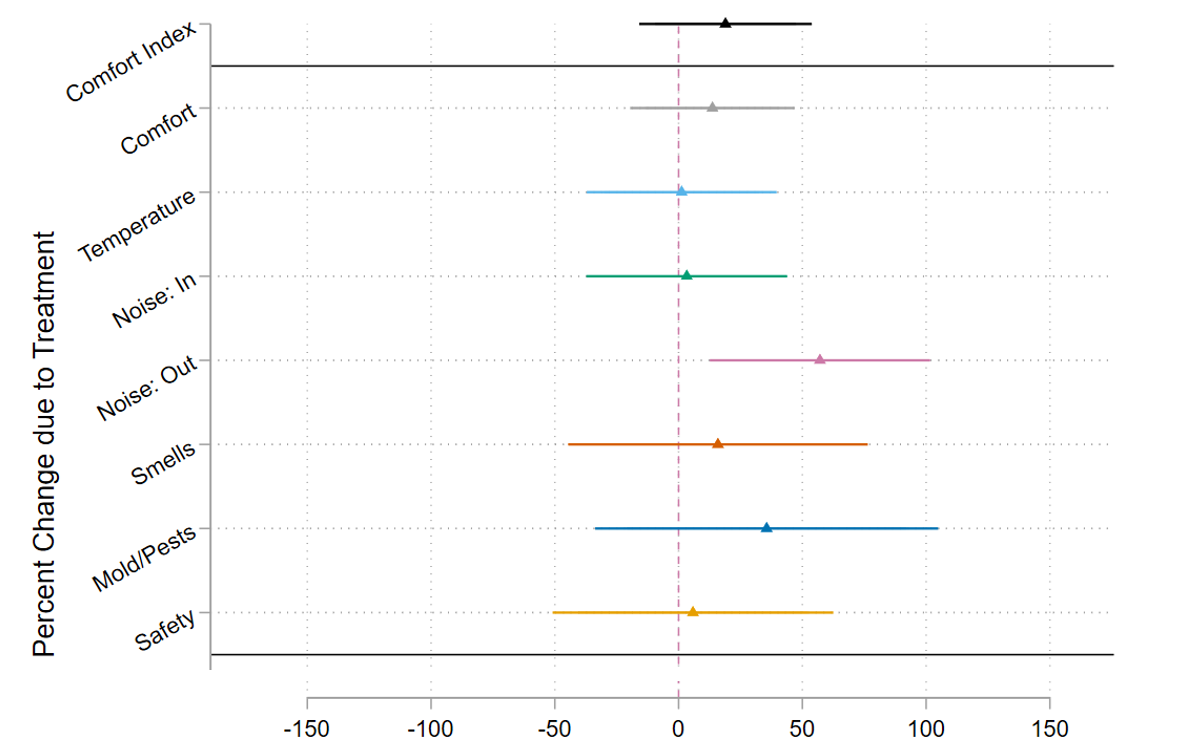
How did the work done by the BTL impact the lives of the homeowners? To answer this question, we turn to survey data on participants’ self-reported comfort levels in their home. We asked participants how comfortable they currently feel in their home, on a scale of 1-10, across several dimensions. These dimensions include their comfort on temperature, noise, odors, safety, and pests and mold. Finally, we combine these variables into a single comfort index to quantify the overall change in comfort.
The results of the regressions are presented in Figure 5. We see a 19% increase in the overall comfort index, which is driven by reductions in outdoor noise, malodors, and mold or pests.
Qualitative Results
Survey respondents were also given the opportunity to give comments on their takeaways from the program thus far and on the quality of the work or repairs done to their homes. These comments help communicate the personal experiences of study participants.
Many participants, for example, expressed support and thanks for the BTL program. One participant who said, “Built to Last is currently working on my home and I’m so grateful and pleased with the job they are doing. I couldn’t ask for more.” Other participants expressed that the work done was of good quality and needed, especially those with major work done such as roof replacements or furnace replacements. Many also praise the ability of BTL to remove the bureaucratic frictions often associated with accessing the programs that are available.
The primary concern conveyed by participants that the program was not able to solve every single concern participants may have had about their homes. Funding constraints mean BTL naturally was unable to implement a wide range of interventions that might have benefited participating households.
Policy Implications of Housing Intervention Programs
Overall, our results suggest that the BTL program was successfully able to aggregate the services of several local housing intervention programs to the benefit of low-income Philadelphia homeowners, successfully implementing a range of interventions. This, in turn, appears to have improved the overall comfort level of people in their homes along several dimensions. Qualitative evidence suggests that many participants had very positive experiences with BTL and that the program did very needed work on their homes. In order to more rigorously evaluate the economic impact of housing intervention programs, a randomized controlled trial with a larger sample size will be needed.
Stuart S. Rosenthal (2008). Journal of Urban Economics. “Old homes, externalities, and poor neighborhoods. A model of urban decline and renewal.”
Tonn, E. Rose, B. Hawkins (2018). Energy Policy. “Evaluation of the U.S. department of energy’s weatherization assistance program: Impact results”.
Joel F. Eisenberg (2014). Oak Ridge National Laboratory. “Weatherization Assistance Program Technical Memorandum Background Data and Statistics On Low-Income Energy Use and Burdens”. Technical memorandum ORNL/TM-2014/133. URL: https://info.ornl.gov/sites/publications/Files/Pub49042.pdf.
Energy Information Administration (2017). “What’s New in How We Use Energy at Home:
Results from EIA’s 2015 Residential Energy Consumption Survey (RECS)”.
Harvard Joint Center for Housing Studies (2021). “Improving America’s Housing (2021)”.
https://www.aceee.org/research-report/h2001

Susanna Berkouwer