The New Climate Normal for Utility Weather Forecasts
In February, Philadelphia Gas Works (PGW) filed a rate increase request with the PA Public Utility Commission, citing warmer weather as a culprit for lower than expected gas sales, prompting the need to raise rates. Though not explicitly stated, PGW has connected the warmer weather patterns to climate change.
Among the proposed changes in PGW’s request is an alteration from the traditional method of defining normal weather – from using the Standard Climate Normal (SCN) of 30-years (updated on a periodic or rolling basis), moving to a much shorter 10-year time frame – in order to better account for the warming climate.
It is important to understand why defining normal weather is vital for utilities. Temperature patterns play a big role in determining how much energy utility customers use, and therefore influence utility sales and revenues. Customer rates are determined in rate cases by balancing predicted utility revenues and costs, so if revenues are lower than expected (e.g. due to weather) the utility may not bring in enough money to cover costs, triggering the need to increase rates.
Some regulators allow for “weather normalization adjustments” that allow customer bills to be slightly increased or decreased if actual weather deviates from expected normals. However, there are usually limits placed on these adjustments, which means they can’t correct for major discrepancies.
NOAA data compiled by the EPA shows a clear national trend of reduced heating degree days (below 65 degrees) and increased cooling degree days (above 65 degrees), with warming trends starting in the 1970’s. For Pennsylvania, the warming trend seems to be more pronounced in the winter, as there were about 180 fewer heating degree days (HDD) from 1955 – 2015 compared to 1895 – 1954, and only 32 more cooling degree days (CDD) experienced over the same periods. All things being equal, in this scenario, gas companies would expect to sell less gas (bad for business), and electric companies would sell more electricity (good for business).
To better capture the warming trend, PGW’s rate increase proposal uses only 10-years of historic data in defining normal weather, instead of the SCN. The SCN is the arithmetic mean of 30-years of weather data (e.g. temperature, precipitation) in a specific location. The SCN has been used internationally for over 75 years to develop climate normals, but within the international community there is mounting debate over the appropriateness of this metric given the changing climate, as past patterns may no longer be predictive of the future.
Utilities are also beginning to move away from the SCN and towards alternative methods and metrics to more accurately define the new normal. When considering alternatives, it is important to understand tradeoffs, including bias error (too warm or cold), standard error (i.e. sampling error), and stability (i.e. volatility between updates of normals). While the SCN is considered to be very stable, it will generally yield normals that are colder than actual observations (i.e. a cold bias).
Two primary alternatives to SCN are emerging:
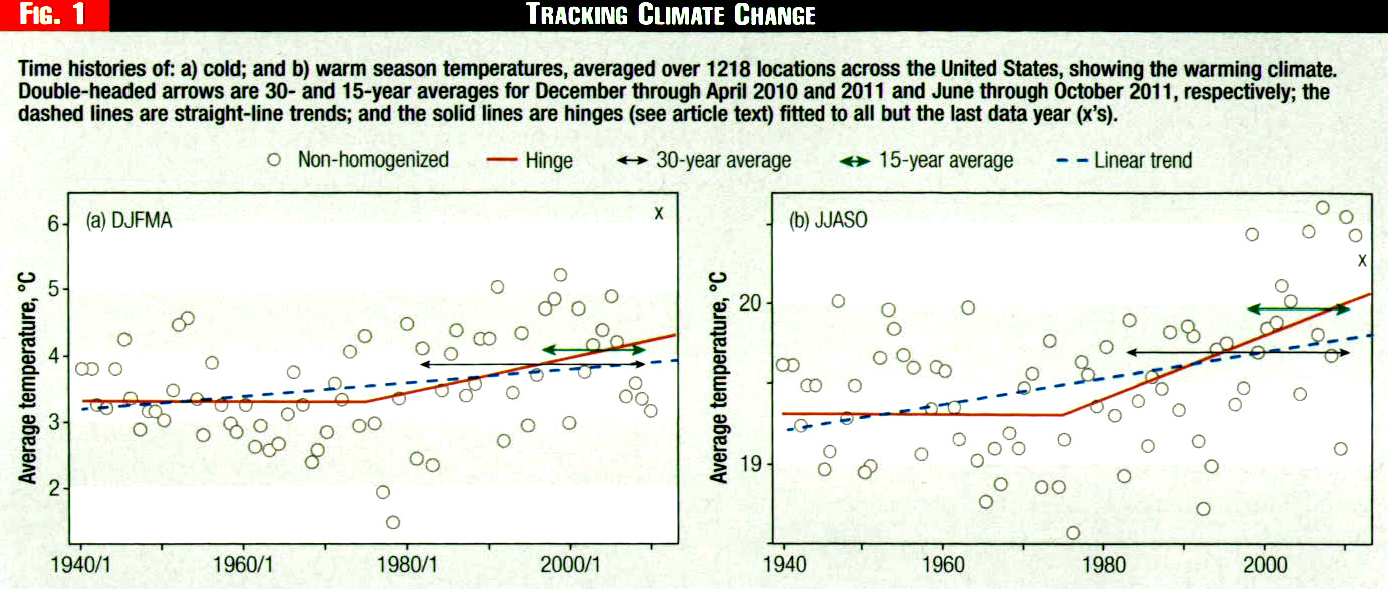
Hinge-Fit: This method increases sampling size beyond three decades, combining two straight-line trends representing pre-warming and post-warming periods, with the pre/post “hinge” occurring around 1975 (for example). This method may somewhat reduce cold bias by incorporating a steeper slope for warming years, and is very stable given the large sample size.
Optimal Climate Normal (OCN): Simply reducing the span of years over which normalization occurs – from 30, down to 20, 15, or 10 years – better captures warming trends (that have generally taken place since the 70’s). This method reduces cold bias, but increases standard error because it captures discrete non-climate weather events as normal and therefore may be considered volatile. The trick is to choose the time frame that reduces total error (bias error plus standard error). But what is the right time span to use? The OCN is the averaging period with the smallest total error, which studies indicate is either 10 or 15 years. In addition, the OCN can be customized to a specific location and season.
The choice between OCN or Hinge-Fit may be influenced by the rate of warming for a particular location and season, so different utilities (gas or electric) in different areas may reach diverse conclusions.
CenterPoint Energy Resources in Minnesota is an example of a gas utility that has moved to a 10-year weather normal. The testimony of CenterPoint’s expert witness, Dr. Robert Livezey, is a great read for those interested in more details. Note that in Minnesota, there has been significant winter warming with a loss of 374 HDDs when comparing the past 50-year period to the 50-year period prior.
(And by the way, the use of SCN can also bias weather normalization adjustments, but that is too much to tackle in one blog.)
If your head is spinning with all these terms and details, the one thing you should take away from this blog is that as the climate changes, many aspects of utility business will also have to adapt.