Introduction
Large-scale energy storage offers a variety of opportunities for the power grid, such as complementing intermittent generation and improving reliability. The “value stack” is a useful framework for examining the multiple layers of benefits that energy storage can provide. For example, Figure 1 illustrates how a hypothetical energy storage project creates value through several different services, which combine to form its value stack. In this context, a recent report from Pacific Gas & Electric (PG&E) provides important data and analysis indicating that different revenue streams may not be perfectly “stackable” in the real world—where projects operate in competitive markets. Monetized revenues, which ultimately drive wider deployment, may be less than the sum of individual parts. The PG&E project provides several key lessons for those seeking to design energy markets that will facilitate the deployment and financing of energy storage projects.
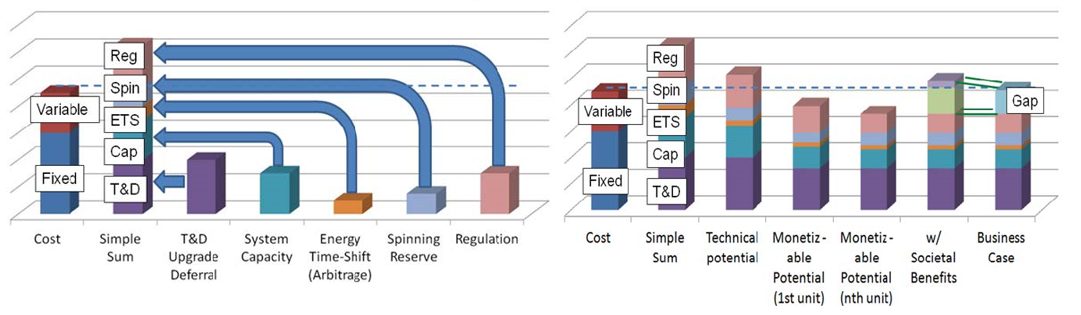
Source Note 1: Transmission and distribution (T&D) upgrade deferral refers to the avoided cost when using energy storage to help meet peak electricity demand, in order to delay expensive upgrades to transmission and distribution equipment capacity. System capacity refers to generation capacity for peak demand, traditionally provided by conventional peaker plants. Energy time-shift (arbitrage) refers to using energy storage to shift electricity load from high-demand times to low-demand times. Spinning reserve refers to on-line reserve capacity that is ready to provide backup on the order of 10 minutes. Frequency regulation refers to balancing short-term mismatches in supply and demand, on the order of seconds to minutes, in order to maintain system frequency (60 Hz in the U.S.).
California is at the forefront of energy storage deployment and policy development. Last November, PG&E released a report documenting its two-year battery storage demonstration project, in which its distribution system-sited Vaca-Dixon and Yerba Buena batteries became the first utility battery storage systems to bid into California’s wholesale electricity markets, called CAISO (PG&E 2016).1 The batteries were funded by the California Energy Commission’s Electric Program Investment Charge (EPIC) initiative, which is designed to support applied research and development for clean energy technologies (California Energy Commission 2016). The example of a battery project connected to the distribution system, with the capability of providing wholesale services, creates many regulatory questions and revenue opportunities. The project deepened operational experience for battery storage and provided real-world performance data.

For Storage, Frequency Regulation is More Profitable than Energy Arbitrage
The EPIC report’s findings about wholesale revenue streams focus on two markets: the energy market and the frequency response market. The energy market is the primary CAISO market where bulk energy is bought and sold. The frequency regulation market helps maintain grid reliability by smoothing out supply and demand fluctuations over seconds and minutes.
Operating in the energy market, energy storage enables energy arbitrage: buy electricity to charge the battery when prices are low (e.g. off-peak), store the electricity as potential energy, and discharge the battery to sell electricity when prices are high (e.g. peak). More specifically, energy storage can help integrate intermittent wind and solar power, whose output depends on the time of day, seasonality, and meteorological conditions. A previous Kleinman Center policy digest examines the economics of using storage for energy shifting, noting that storage as part of a smart grid can “move power across times of the day to more closely match cycles in renewables generation” (Jacobsen).
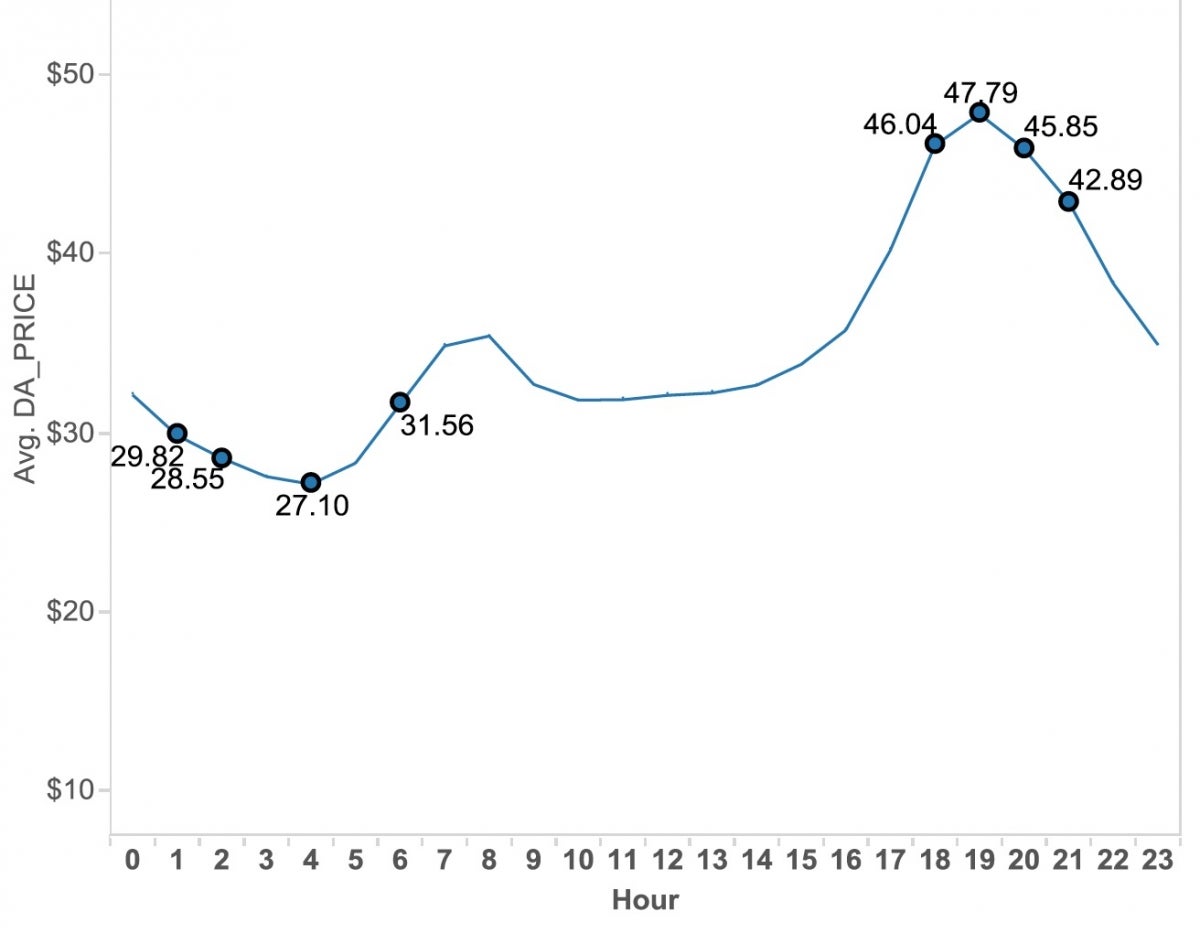
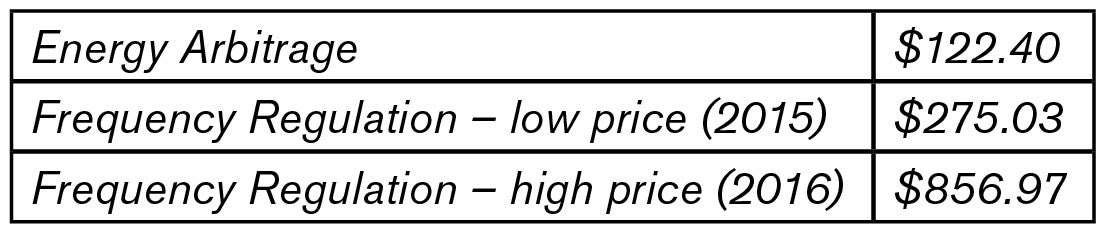
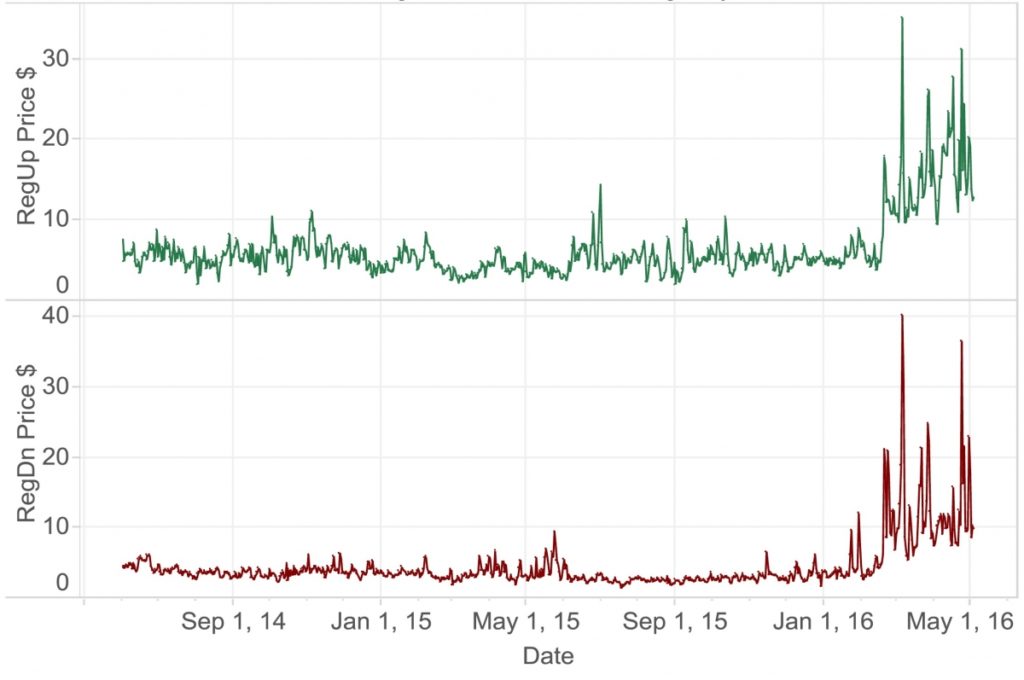
For example, Figure 3 shows representative energy prices during the day, which can be used to calculate energy arbitrage revenues for the Vaca-Dixon battery system. Roughly, each day a battery system charges up at $27 per megawatt hour (MWh), undergoes 25% of round-trip efficiency loss, then earns $48 per MWh of the remaining energy. Assuming perfect foresight and full discharge, the 14 MWh Vaca-Dixon battery system would earn $122.40 per day on average from energy arbitrage—or 14 MWh (-27.10 $/MWh + 0.7547.79 $/MWh). This is not as lucrative as the frequency regulation market. Under a low price frequency regulation scenario, as was observed in 2015, the sum of regulation up capacity ($179.10) and regulation down capacity ($95.93) was $275.03. Under the higher price scenario that prevailed in 2016, the sum of regulation up capacity ($524.43) and regulation down capacity ($332.53) yielded $856.97.
In practice today, energy arbitrage is not the best value stream due to opportunity costs: “a resource can only receive a market award for one power/energy unit in any given time interval” (Fribush, 56). Whenever a battery is being charged up or down for energy shifting, it gives up some revenues that could otherwise be earned from ancillary service markets (e.g. frequency regulation). Frequency regulation “represented the best financial use” of the battery systems, as seen in Table 1, even during periods of low-frequency regulation prices.
Through its operations, the PJM Interconnection (the regional transmission organization that serves the Mid-Atlantic U.S.)2 has demonstrated frequency regulation’s profitability relative to energy arbitrage. The EPIC study is important because it supports the idea of frequency regulation profitability in another major wholesale market, in line with prior valuation models for California (see Appendix).
At the same time, frequency regulation’s spot as the most profitable value stream is not guaranteed. Several long-term trends introduce uncertainty about different value streams’ future availability to energy storage projects. For example, increased deployment of variable wind and solar generation would tend to increase not only short-term fluctuations that drive frequency regulation requirements, but also the incidence of low price times. The resulting “duck curve” (shown in Figure 4) would become steeper, setting up more energy arbitrage opportunities due to increased price differentials. So in some future market condition, energy arbitrage may become more profitable.

Additionally, increased deployment of storage resources can alter value streams—a difference sometimes referred to as first-of-a-kind versus Nth-of-a-kind. Upon meeting the entire 1.3 GW of mandated storage, about 80% of California’s frequency regulation needs would be met, placing downward pressure on prices (National Renewable Energy Laboratory 2015). As new batteries flood the frequency regulation market, other value streams may emerge as the next most profitable. In addition, the Federal Energy Regulatory Commission’s (FERC) proposed rule, requiring new generation resources to possess frequency response capability, may reduce demand for frequency regulation as an ancillary service, but may also raise the value stream for battery storage co-located with renewable generation assets (Heidorn 2016).
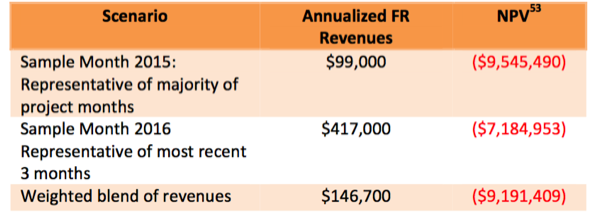
Source Note 2: “FR Revenues” means revenues from the frequency regulation market. The NPV (net present value) calculation assumes 12 years of operation and 7% inter rate. Note that changing the discount rate does not affect the negative NPV, since summing 12 years of revenues still falls short of the capital cost.
Market Design Can Help Maximize Storage’s Value Stack
Actual revenues from wholesale markets alone were insufficient to cover the battery capital costs, based on the negative net present value even in the high price period (Fribush 2016, 60). In addition to projected capital cost declines,3 the profitability of energy storage may depend on monetizing other parts of the value stack.
Specifically, the EPIC report focuses on wholesale revenues and so does not specify the financial performance from providing distribution system reliability. By being physically connected to the distribution system, the Yerba Buena system provided local distribution grid services as well as participated in the state level wholesale (i.e. CAISO) market. The battery was located directly upstream of an R&D facility (owned by the company HGST, which manufactures computer storage devices) to provide support “in the event of a power quality problem or outage on the feeder.” Among other contract structures, these distribution services could be monetized through the deferral of equipment upgrades, where the utility uses energy storage to help meet peak demand in order to delay expensive upgrades to transmission and distribution equipment capacity (Energy Storage Association).
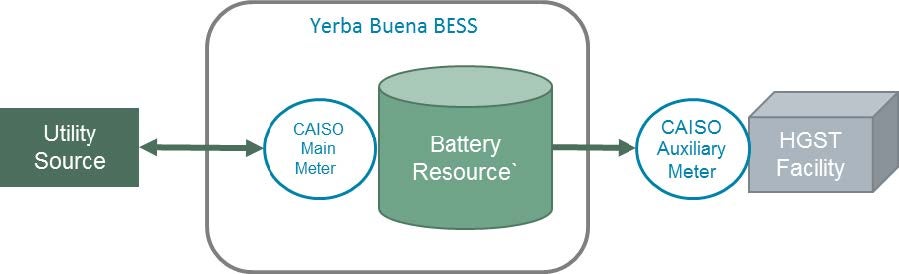
Source Note 3: The two meters were used to determine the net output of the battery energy storage system (BESS). The EPIC report does not specify whether or how PG&E received extra payment for the reliability services.
Yet existing market rules, historically designed in the context of conventional generation and storage, may impose operational obstacles for value stacking. Recognizing these challenges, the EPIC report provides two recommendations that would more closely match market rules to the technical capability of battery storage.
First, PG&E recommends that charging parameters be made more flexible, which would better utilize the full capability of different parts of the value stack. Under current rules, CAISO’s automatic Regulation Energy Management (REM) optimization algorithm requires an average 50% state of charge (SOC). The 50% rule exists to maximize the battery’s capacity in either direction of charging or discharging, since on average the system operator expects symmetric regulation up and regulation down requirements (California ISO 2015). However, the Yerba Buena system reserved 45% of total energy capacity for distribution reliability and applied the remaining 55% towards CAISO market participation. The REM rule would have asymmetrically constrained Yerba Buena’s average discharging capacity to just 5% of the total (and 50% for charging). Allowing user-specified operating ranges would help integrate “resources that are also dedicated for another purpose” (Fribush 63).
Second, PG&E also recommends that charging models incorporate operational limitations, like daily caps on throughput and cycling, in order to avoid degradation and maximize the technological performance of batteries. More carefully managing a battery in this way extends the battery’s useful life for earning revenues. Financially, such limits on throughput and cycling discharge can ensure that warranty conditions are met. This is important for energy storage finance, because addressing technology risk “may require that the project company shift the risk of excessive degradation to a third party through warranties” (Arora).
In November 2016, FERC proposed a rule aimed at more effectively integrating energy storage resources into wholesale electricity markets by developing market rules that would better reflect the unique characteristics of storage resources.4 This FERC order clearly recognizes the need to address the type of charging issues revealed by the PG&E project. In January 2017, FERC issued a policy statement providing guidance on electricity storage resources seeking to simultaneously provide services under different compensation regimes, specifically, cost-based (i.e. regulated) and market-based (i.e. competitive) rates.5 The policy statement may give room for additional value to storage projects that gain wholesale revenues but also have a distribution component, such as PG&E’s Yerba Buena. While the end result is unclear, many believe these actions by FERC will serve to expand opportunities for storage resources.
Conclusion
Wider adoption of energy storage depends on economic viability. In order for battery storage to expand capital market access through project finance, which “is emerging as the linchpin for the future health, direction, and momentum of the energy storage industry” according to a Sandia National Laboratories report, investors need to understand the nature of project cash flows (Baxter 2016). Regardless of whether projects are financed through utility ratepayer recovery or project finance, revenue streams are critical. PG&E’s EPIC report provides valuable data about the real-life financial performance of two battery systems.
Frequency regulation, despite being the most profitable wholesale market monetization for this energy storage project, is currently insufficient to offset capital costs. Part of this financial mismatch results from overly inflexible rules originally designed for conventional resources. Regulators should further streamline market rules, with the unique characteristics of storage technologies in mind, in order to more fully compensate energy storage resources for their entire value stack.

Thomas Lee
Under the California Public Utility Commission (CPUC) regulations for energy storage procurement, proposed projects must be evaluated for cost effectiveness (Public Utilities Commission of the State of California 2013). Solicited projects with more estimated benefits than costs would be approved and become eligible for regulatory cost recovery. The CPUC specifically references two valuation methodologies providing value-of-storage methodologies for a variety of use cases, including ancillary services (Electric Power Research Institute 2013, DNV KEMA Energy & Sustainability 2013).
A valuation model can indicate either the theoretical social value of a project or the value available to be monetized. In this sense, actual performance may contradict a model incorporating “any system price reduction from storage, instead of considering just the revenue that accrues to storage itself” (Huntoon 2016). Such a scenario represents a positive externality, and market reforms are necessary to increase the amount of society-wide benefits available to be captured. On the other hand, a mismatch between actual performance and a model purporting to estimate realizable revenues warrants closer examination of that model’s assumptions.
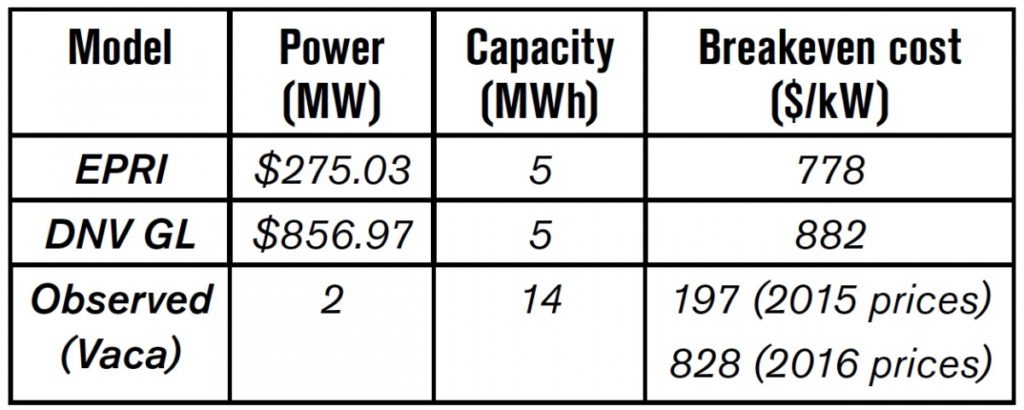
The EPIC report recognizes that actual market participation revenues were lower than those “estimated by models filed with the CPUC”—a difference “driven primarily by lower prices for frequency regulation than those used by the models.” This is actually a conservative assessment, as seen in the following comparison between the models’ break-even costs with that calculated by PG&E using observed profits. Under the 2016 high price scenario, the models are consistent with actual performance.
This begs the question of whether such prices can be expected to persist. Frequency regulation prices increased significantly in the beginning of 2016 as a result of increased regulation requirements by CAISO. According to CAISO, this increase was required to compensate larger forecasting errors due to intermittent renewables (Mullin 2016). So to the extent that greater renewable deployment will drive persistent short-term fluctuations, it is reasonable to assume the high price scenario to continue.
On the other hand, PJM is now investigating whether its current market structure overly compensates fast-responding resources like batteries.6 High frequency regulation prices have recently attracted significant additions of battery resources to PJM. In CAISO, PJM, or any jurisdiction, market prices determine the revenue available to participating storage projects. Thus the interaction of renewable energy buildout and evolving market structures will fundamentally affect the energy storage business model.
Arora, Neeraj. 2016. “The New Frontier – PF for Energy Storage.” Project Finance International 48-52.
Baxter, Richard. 2016. Energy Storage Financing: A Roadmap for Accelerating Market Growth. Sandia National Laboratories. http://www.sandia.gov/ess/publications/SAND2016-8109.pdf.
California Energy Commission. 2016.Electric Program Investment Charge. Accessed November 25, 2016. http://www.energy.ca.gov/research/epic/.
California ISO. 2015. “Energy Storage and Aggregated Distributed Energy Resource Education Forum.” CAISO. April. http://www.caiso.com/Documents/Presentation-EnergyStorageandAggregatedDi….
—. 2016. “What the duck curve tells us about managing a green grid.” CAISO. Accessed November 28, 2016. https://www.caiso.com/Documents/FlexibleResourcesHelpRenewables_FastFact….
Chadbourne. 2013. Synthetic Power Contracts. April. Accessed November 25, 2016. http://www.chadbourne.com/SyntheticPowerContracts_projectfinance.
DNV KEMA Energy & Sustainability. 2013. Energy Storage Cost‐effectiveness Methodology and Results. Energy Research and Development Division.
Electric Power Research Institute. 2013. Cost-Effectiveness of Energy Storage in California: Application of the EPRI Energy Storage Valuation Tool to Inform the California Public Utility Commission Proceeding R. 10-12-007. EPRI.
Energy Storage Association. n.d. T&D Upgrade Deferral. Accessed November 25, 2016. http://energystorage.org/energy-storage/technology-applications/td-upgra….
Fribush, David. 2016. EPIC Project 1.01 – Energy Storage End Uses: Energy Storage for Market Operations. Electric Asset Management, PG&E.
Garleanu, Nicolae, and Lasse Pedersen. 2016. “Efficiently Inefficient Markets for Assets and Asset Management.” SSRN.
Heidorn, Rich. 2016. “FERC: Renewables Must Provide Frequency Response.” RTO Insider, November 21. https://www.rtoinsider.com/ferc-frequency-response-renewables-34477/.
Huntoon, Steve. 2016. “Battery Storage: Drinking the Electric Kool-Aid.” Public Utilities Fortnightly.“>
Jacobsen, Mark R. 2016. Economics and Policy of Large-Scale Battery Storage. June 13. http://kleinmanenergy.upenn.edu/policy-digests/economics-and-policy-larg….
John, Jeff St. 2013. California Sets Energy Storage Target of 1.3GW by 2020. June 11. Accessed November 2016. https://www.greentechmedia.com/articles/read/california-sets-1.3gw-energ….
Lazard. 2015. Lazard’s Levelized Cost of Storage Analysis – Version 1.0. November. https://www.lazard.com/media/2391/lazards-levelized-cost-of-storage-anal….
Mullin, Robert. 2016. CAISO: Forecasting Challenges Drove Increased Regulation Requirements. June 25. https://www.rtoinsider.com/caiso-regulation-requirements-29299/.
National Renewable Energy Laboratory. 2015. Operational Benefits of Meeting California’s Energy Storage Targets. December. http://www.nrel.gov/docs/fy16osti/65061.pdf.
Pacific Gas and Electric Company. 2015. Advanced Energy Storage Systems for Enabling California’s Smart Grid. California Energy Commission.
PG&E. 2016. PG&E Battery Storage Systems are First to Successfully Participate in California Electricity Markets. November 10. Accessed November 25, 2016. https://www.pge.com/en/about/newsroom/newsdetails/index.page?title=20161….
Platts. 2016. California ISO eyes changes to flexible capacity product. November 21. http://www.platts.com/latest-news/electric-power/portland-maine/californ….
Public Utilities Commission of the State of California. 2013.Decision Adopting Energy Storage Procurement Framework and Design Program. October 17. http://docs.cpuc.ca.gov/PublishedDocs/Published/G000/M079/K533/79533378.PDF.
- More information about California Independent System Operator can be at CAISO’s website at http://www.caiso.com/ [↩]
- More information about PJM Interconnection can be found at http://www.pjm.com [↩]
- While the sodium sulfur (NaS) technology used in the PG&E demonstration are technologically mature and have “inherently higher costs,” other battery types are forecasted to see more dramatic cost declines: 47% for lithium-ion and 38% flow batteries over the next five years (Lazard 2015). [↩]
- More information on FERC proposed rule on electricity storage can be found at FERC’s website https://www.ferc.gov/media/news-releases/2016/2016-4/11-17-16-E-1.asp#.W… [↩]
- More information on FERC policy statement on cost recovery by electric storage resources can be found on FERC’s website at https://www.ferc.gov/media/news-releases/2017/2017-1/01-19-17-E-2.asp#.W… [↩]
- More information about PJM’s ongoing Regulation Market Issues Senior Task Force can be found at PJM’s website at http://www.pjm.com/committees-and-groups/task-forces/rmistf.aspx [↩]